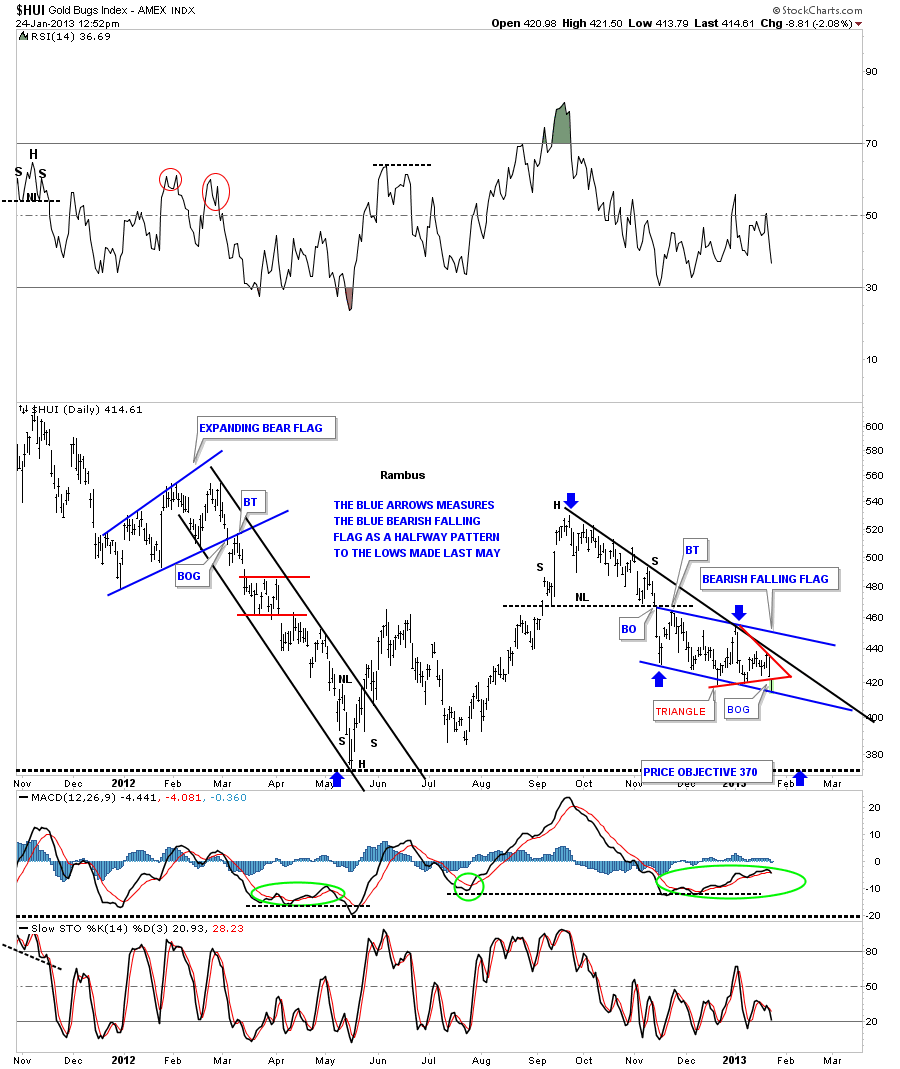
I just want to show you what I think is happening right now with the HUI. You can see the blue bearish falling flag that actually started out as a bearish falling wedge but morphed into the falling flag. Same bearish setup but the original pattern just morphed alittle bit. This morning the price action gapped below the bottom rail of the red triangle that has formed within the blue bearish falling flag. The price action is now sitting on the bottom blue rail. Its totally possible that we get a backtest to the bottom rail of the red triangle before we move lower. If we do then I’ll take another 1/3 position in the Kamikaze Portfolio with the capital we raised yesterday when we got stopped out of our DSLV trade. The blue arrows shows how I measured the blue bearish falling flag as a halfway pattern that shows the price objective to the previous low made last May. Important note here. That May low is also where the neckline form the big H&S top comes into play. Things are starting to get interesting again after the long chopping action over the last several months or so.
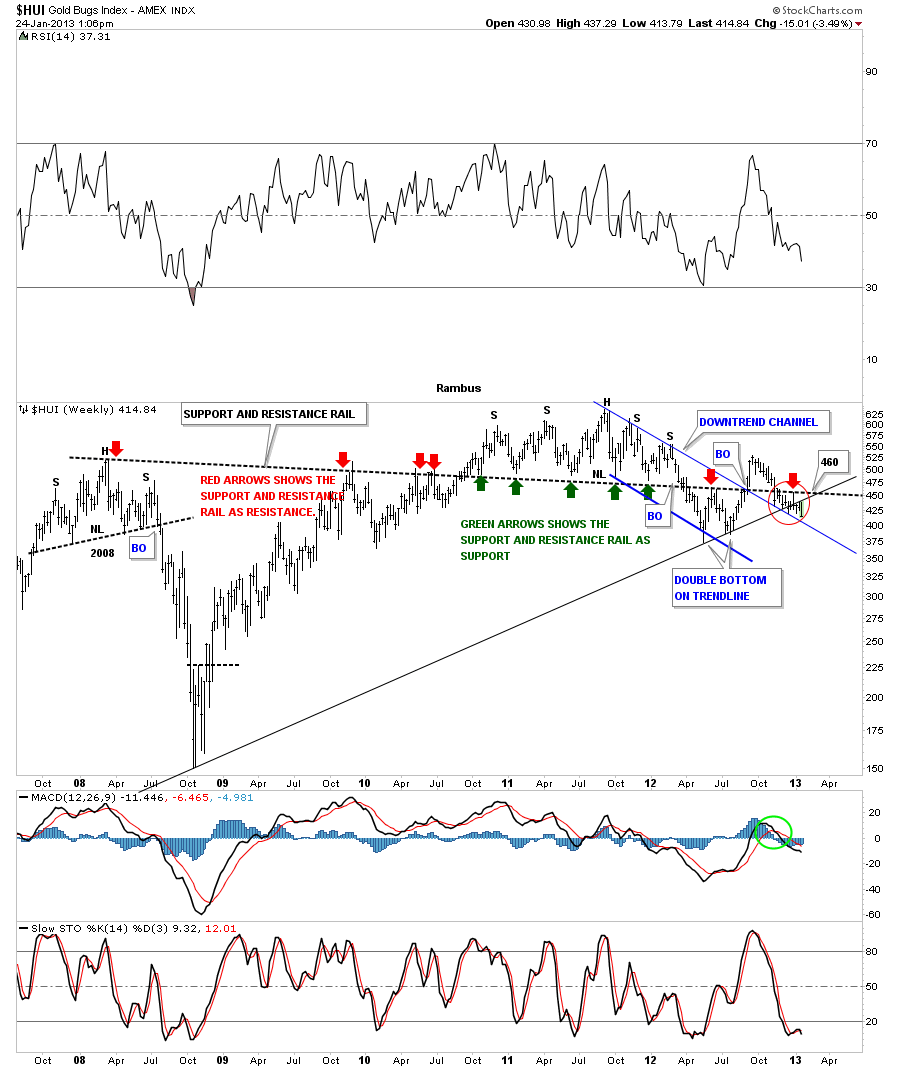
Below is a weekly chart that shows the price action in the red circle that has been backtesting the long black dashed support and resistance rail that goes all the way back to the H&S top in 2008. There is also the uptrend rail made off the 2008 low that is being backtested. The only support rail left is the top blue rail of the small downtrend channel.
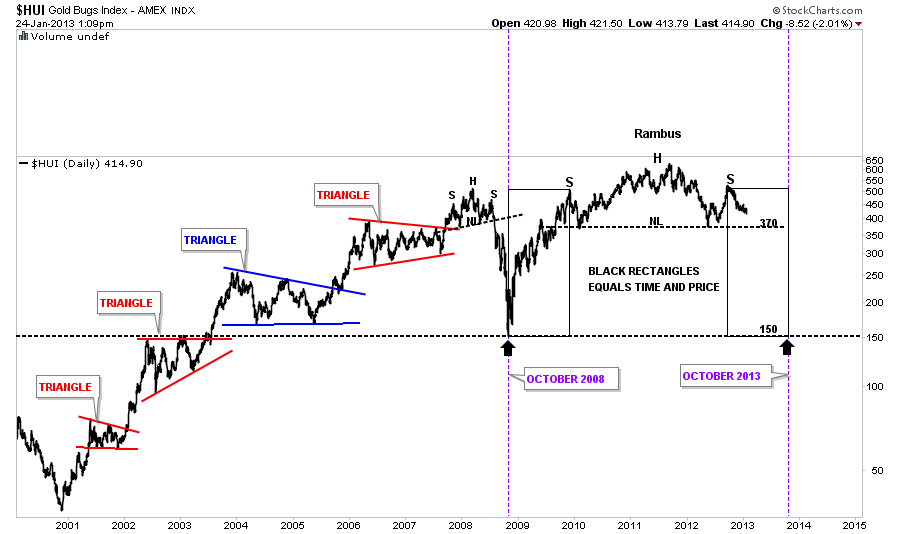
Below is a chart I built sometime ago that shows the beautiful symmetry taking place in the big picture for the HUI. This chart shows the possibility of what to expect if the neckline is ever taken out. First things first tho. A move down to the neckline is the next thing we have to see happen before we get to excited about the prospects of the massive H&S top. I actually started thinking about the prospects for the big H&S topping pattern back in December of 2011. When you live through the development of a massively large pattern like this it seems like it takes forever to come to fruition. But as long as it keeps on developing the way that you envision you have to think you might be on the right track until something derails your idea.
EDITOR’S NOTE :
Rambus Chartology is Primarily a Goldbug TA Site where you can watch Rambus follow the markets on a daily basis and learn a great deal of Hands on Chartology from Rambus Tutorials and Question and Answers .
Most Members are Staunch Goldbugs who have seen Rambus in action from the 2007 to 2008 period at www.goldtent.org and now Here at Rambus Chartology since early 2012 .
www.rambus1.com
To review his Work and incredible calls from the 2007-2008 period click on the top right sidebar in the “Wizard of Rambus” ….”What If ?! ”
To Follow Rambus Unique Unbiased Chart Work and participate in a Chartology Form with questions and answers, and learn the Art and Science and Mindset of a Pro Trader you may Join us by subscribing at
www.rambus1.com
We have many subscribers from all over the world who are glad they did as they enjoy the many daily updates and commentaries provided at this exciting new site.
As you will see Rambus (Dave from The Ozark Mtns in Arkansas) has prepared us for this difficult period by being one of the only ones to see and warn about the incredibly debilitating PM smackdown as early as Jan 2 2012 …click on the” HUI Diamond in the Rough” Post in the “Wizard of Rambus” top right
More Recently Rambus called a Bottom in HUI in this post…and has had subscribers on board for a Powerful Run to the Upside
rambus1.com/?p=5651
Followed again by his timely bearish call in this SLV Update which has had us on the sidelines and or short
rambus1.com/?p=8876
BUT
What is he seeing Now ?
You will find Rambus to be a calm humble down home country tutor with an incredible repitoir of all the TA based protocols tempered with his own one of a kind style…simply put…He wants to keep his subscribers on the right side of these crazy volitile and downright dangerous markets
See you at the Rambus Chartology


