
Tonight’s chart is a daily bar chart for gold that shows all the consolidation patterns since hitting the top of the rectangle back in October of last year at 1800 or so. If gold was ready to break below the bottom rail of the big rectangle, today would have been a good time to do so. Because it didn’t breakdown this morning that tells me the sideways correction that has been going on already for almost 3 weeks now, still has more work to do. Below shows what I think could be a smaller red rectangle that is forming below the brown shaded support and resistance zone that may end up being just one more consolidation pattern to the downside. The possible red rectangle is about 60 points and with today’s close around 1575 or so would leave about 45 more point to go to reach the top rail. At our most recent bottom there have been 3 main declines out of the H&S top and the two consolidation pattern. This is a good example of how a downtrend works. It starts out with a top that breaks down hard and then a consolidation pattern forms and then when its finished you get another hard down and so on until you get a reversal pattern form at the bottom. I’ve labeled these 3 hard down phases A B & C. 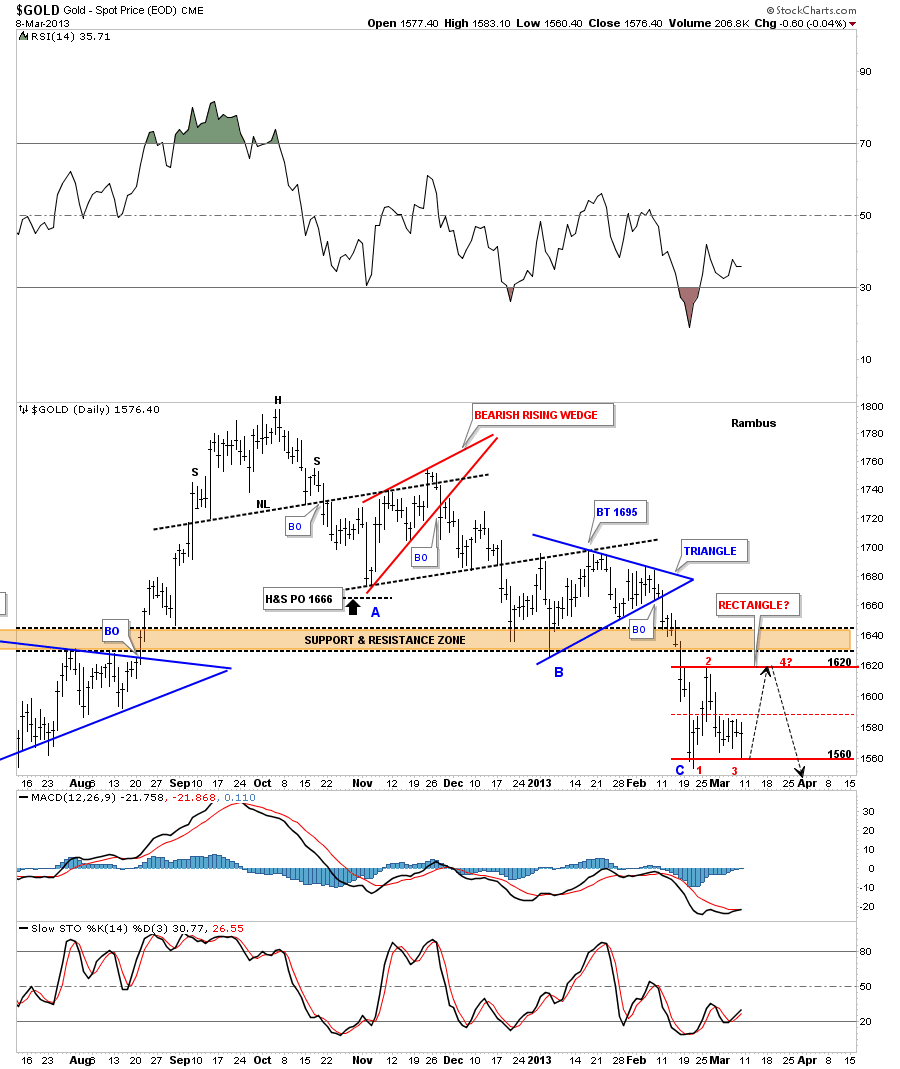
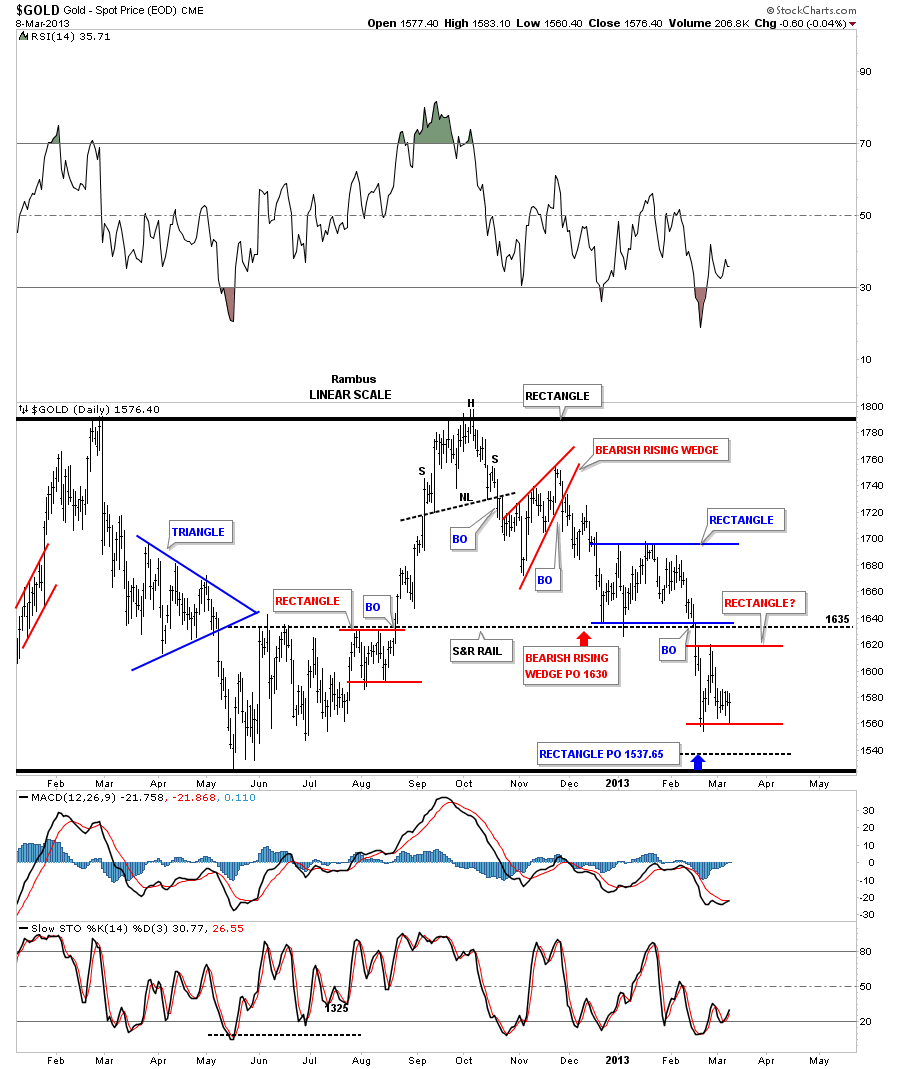
This next chart is another daily chart that goes out a little further out in time that shows the top and bottom rails of the large rectangle gold has been in for 18 months or so.
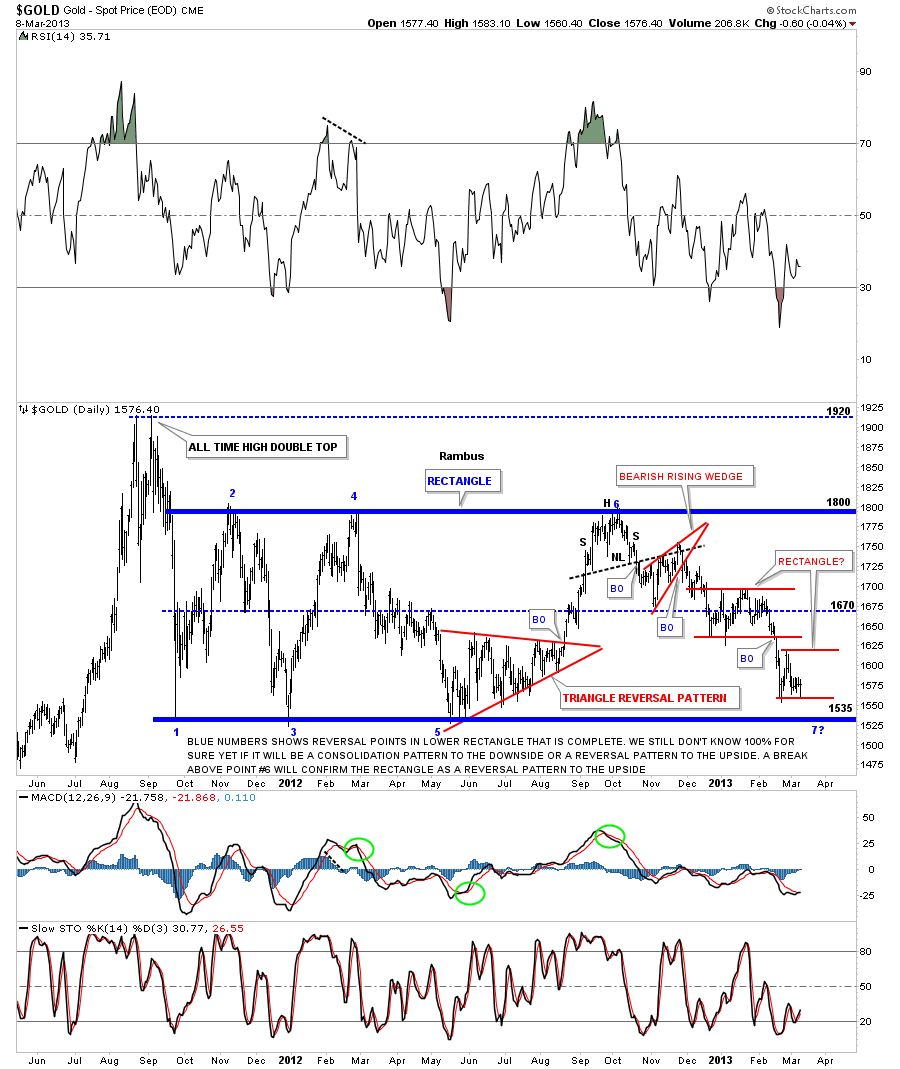
This next long term daily chart shows the big trading range, blue rectangle, and our latest decline towards the bottom.
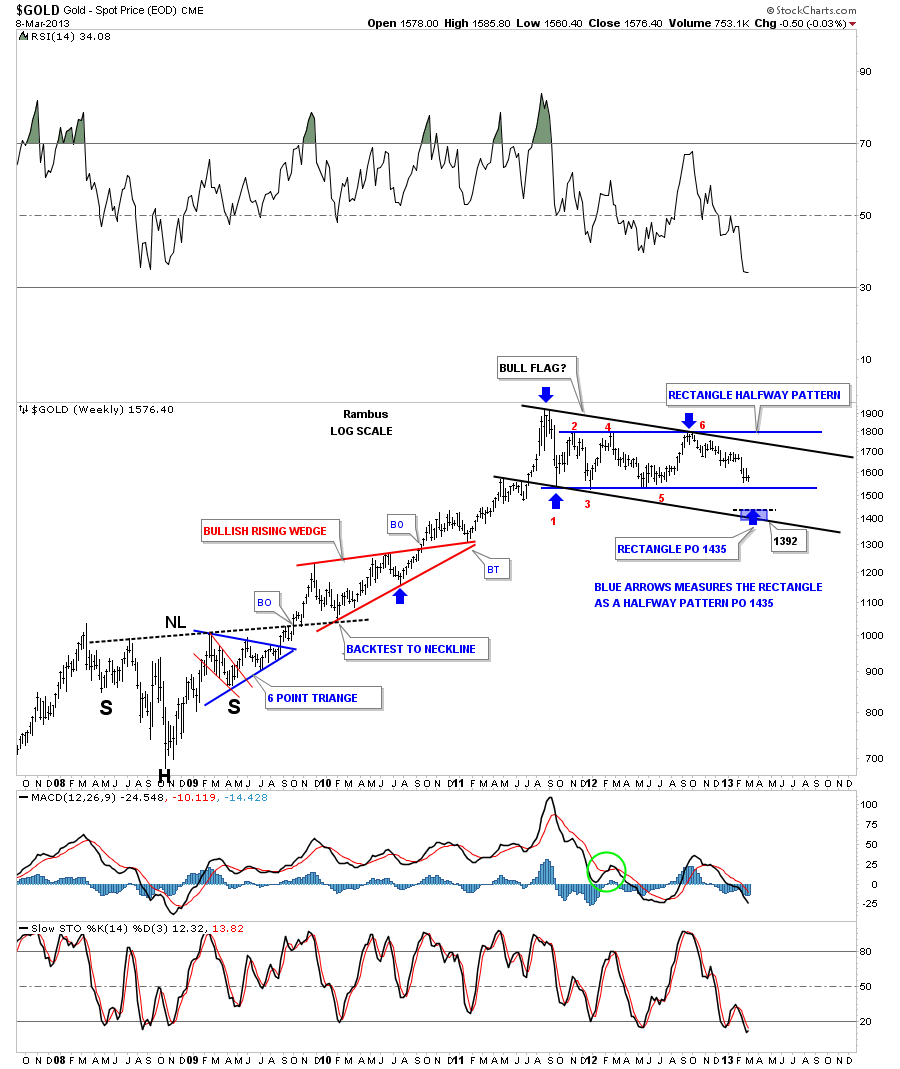
The next chart is a long term weekly look that goes all the way back to the 2008 crash low. This chart gives you a good look at our big Blue rectangle that I think is going to eventually break to the downside. Until it does its still consolidating.
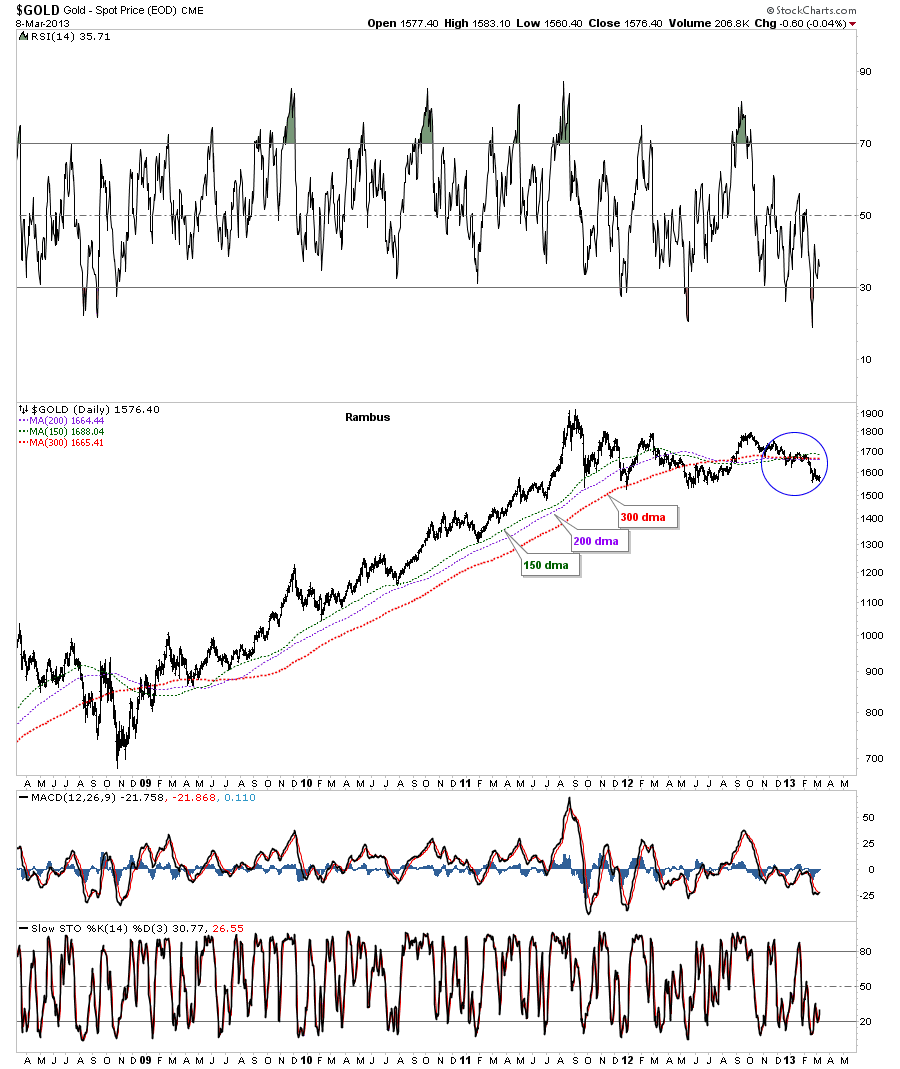
This last chart shows what I consider the most important moving averages on the daily look. As you can see the price action is trading well below all three moving averages which is a negative.
This should get everyone up to speed on how gold is trading. I don’t really expect much action until the smaller rectangle is finished forming. All the best…Rambus
Editors Note:
Rambus Chartology is a Precious Metals Based Technical Analysis Site with a twist
“Give a Man a Chart and he can eat for a day : Teach a man To Chart and He will never Starve”
More Info and Charts at