In this past Weekend Report,” Gold Bulls Do or Die”,
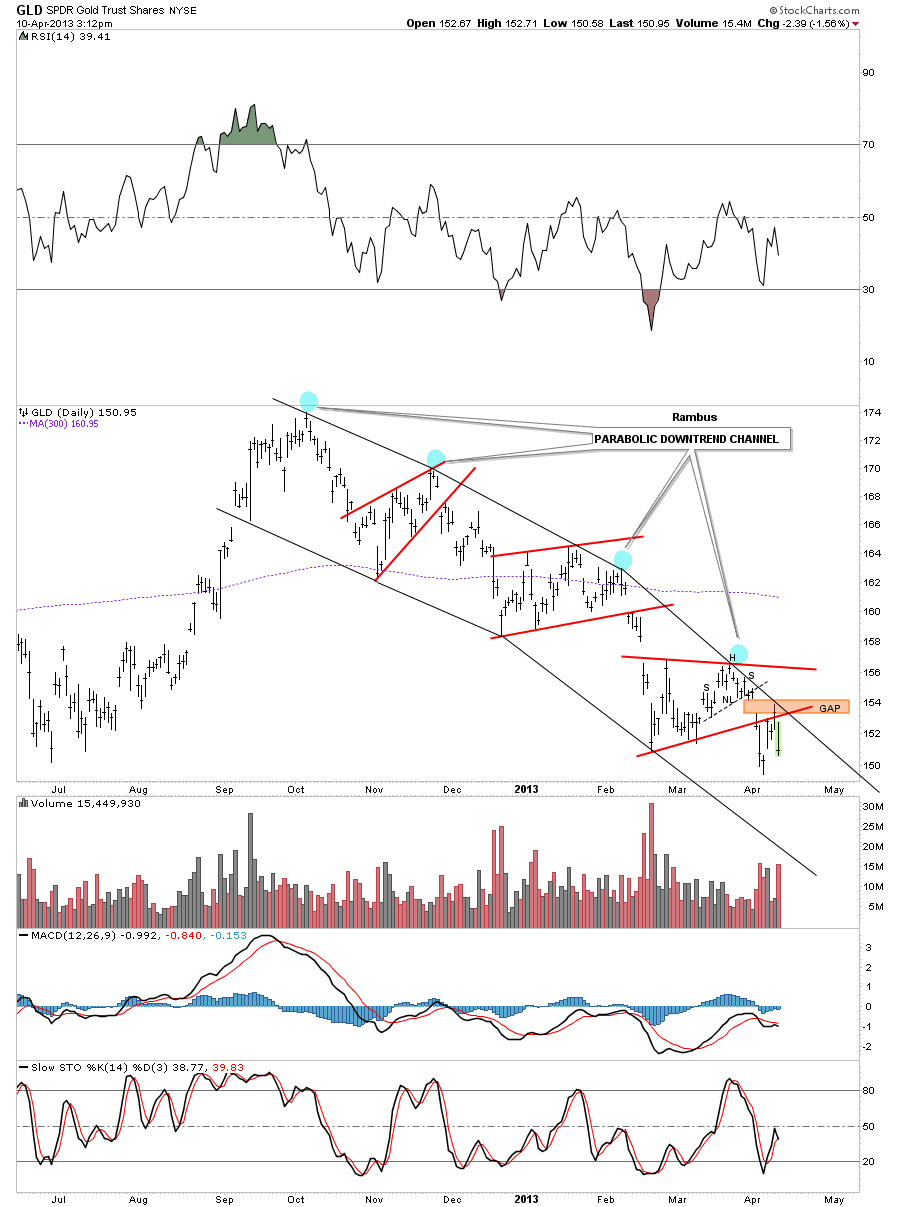
I showed a daily chart for the GLD that showed a parabolic downtrend forming. That was the first time I posted that chart. GLD was in the process of backtesting the triangle that had been forming since the end of February. The backtest was a little strong, which happens sometimes, but with the brown shaded gap area and the latest rail of the parabolic downtrend channel, just above the bottom rail of the triangle, I thought there was a good chance that the GLD would fill the gap and touch the new downtrend rail one last time before the GLD started the next impulse leg down. Below is the undated chart for the GLD that shows yesterday’s price action did in fact trade slightly above the bottom red rail of the triangle, closing the gap and bouncing off the newest rail of the parabolic downtrend channel. I can guarantee you won’t find a chart like that anywhere on the planet just here at Rambus Chartology.