
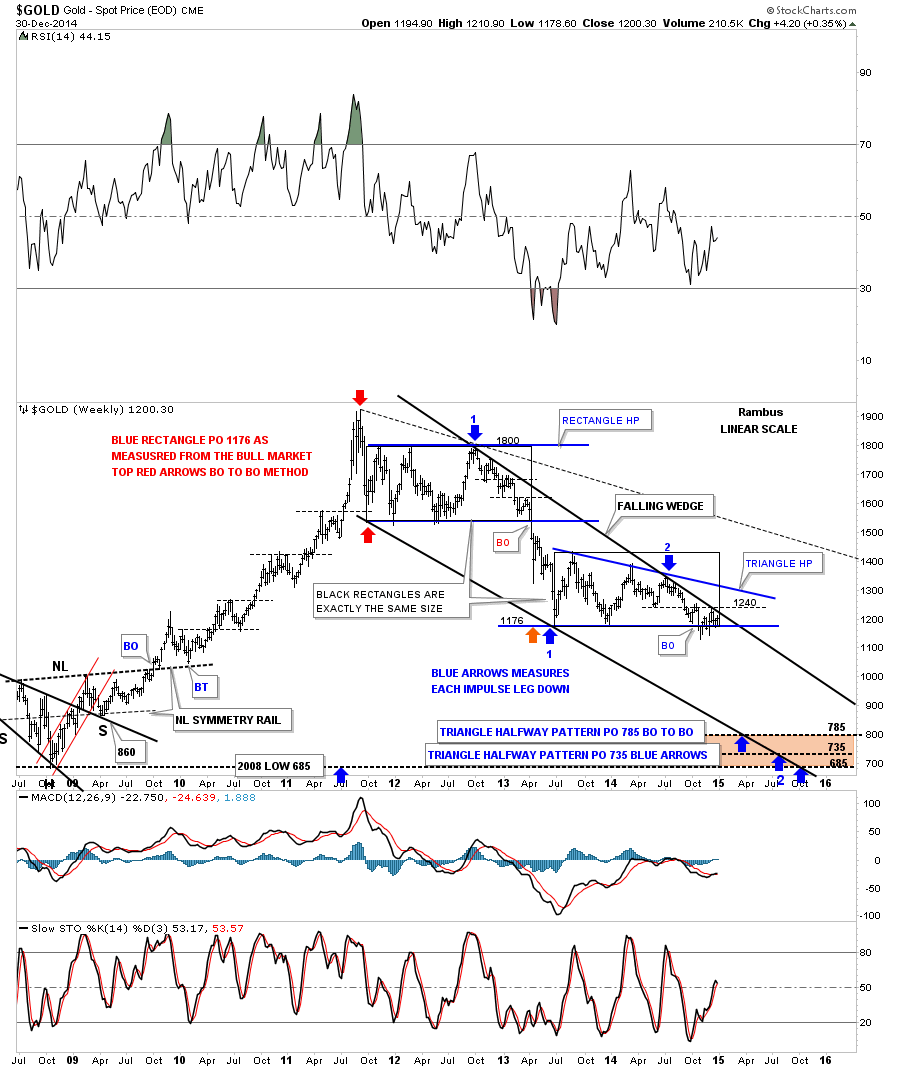
Below is a gold chart I worked on this weekend. It has a lot of information on it to digest. First thing to note is the top rail of the black falling wedge. As you can see the top rail comes in around the 1215 to 1220 area. Not that it means anything but the two black rectangles are exactly the same size that measures time and price for the rectangle on top and our current triangle below. If our current triangle plays out as a halfway pattern, I have it measured using the BO to BO and the impulse method with the price objectives at the bottom of the chart. I think we could see a small halfway pattern form during the second impulse move down before the actual price targets are hit. The very bottom price objective is the 2008 crash low at 685 which looks like it would hit the bottom rail in October. Something to watch when the bottom rail gives way.
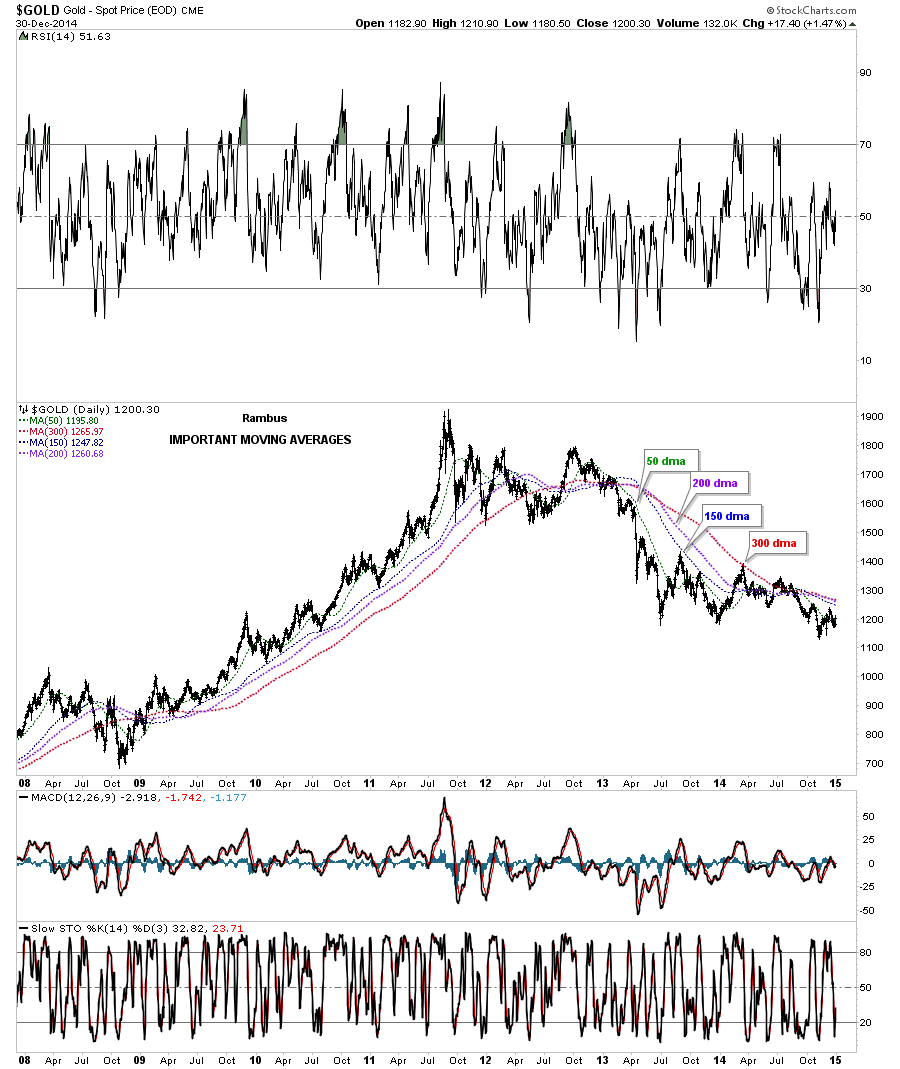
I have followed these moving averages on gold for many years and consider these to be the most important ones.
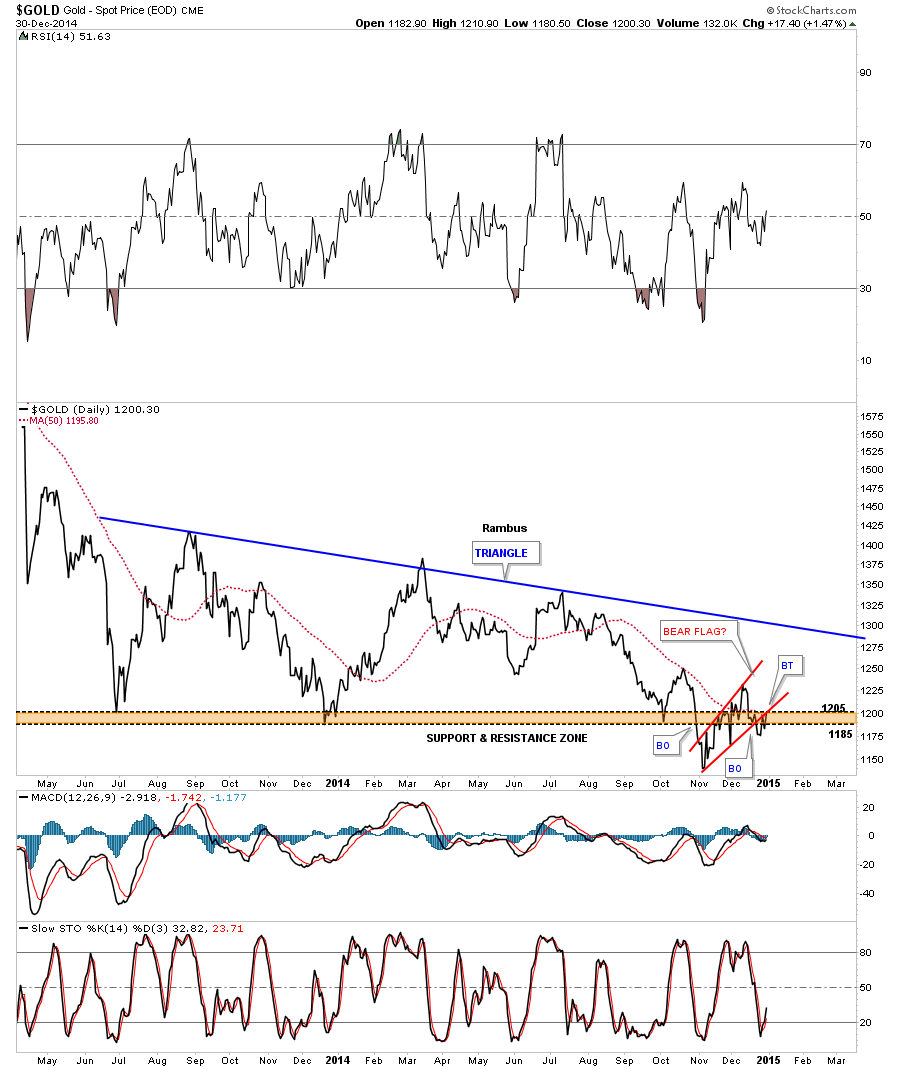
Gold’s 18 month daily line chart showing the triangle consolidation pattern.
All the best in 2015
Rambus