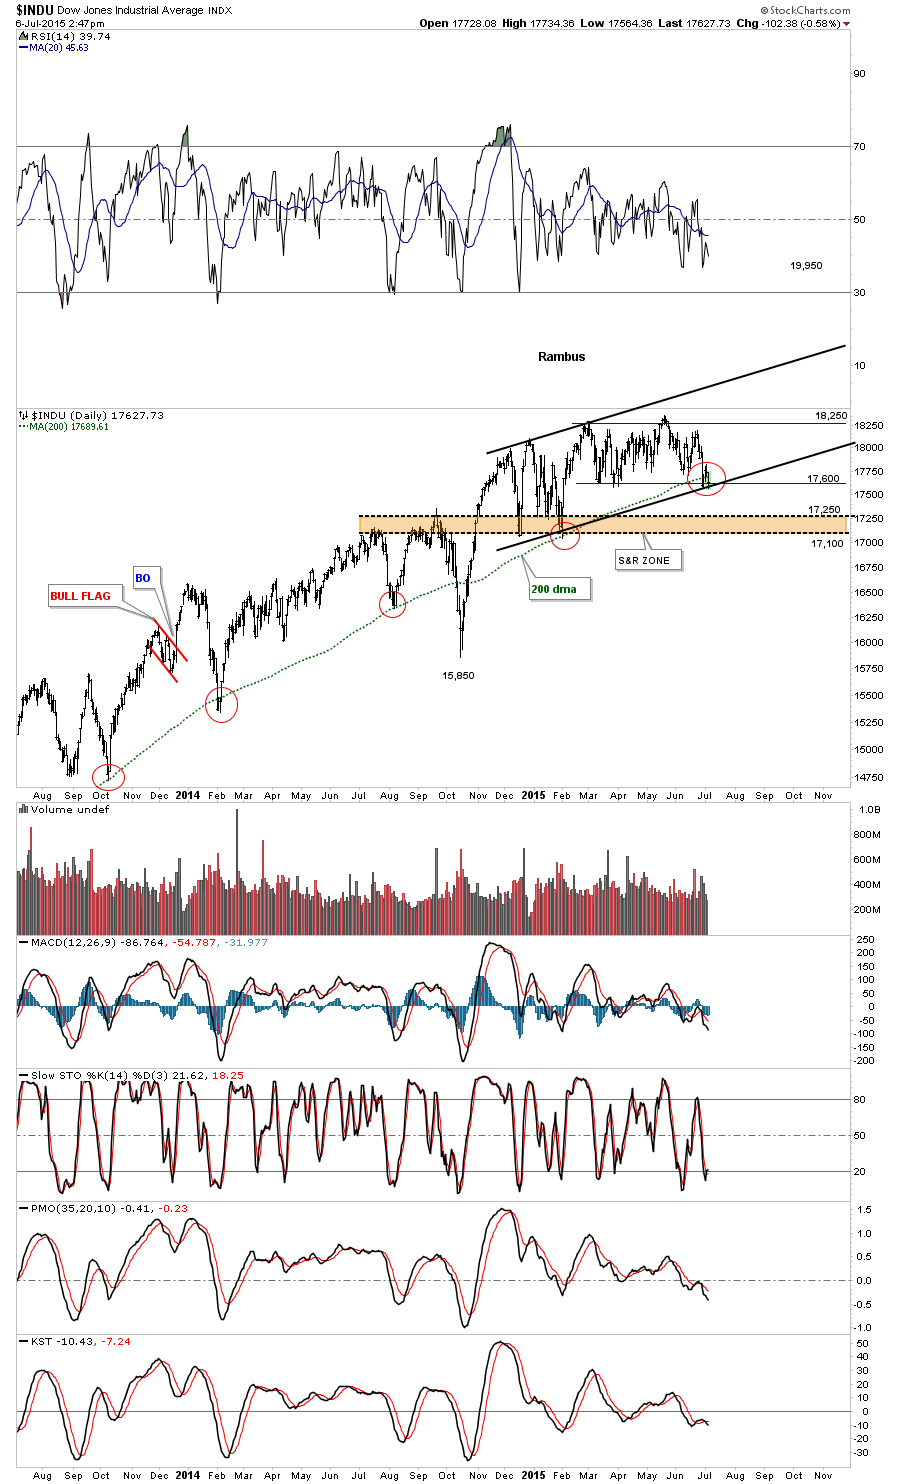
We are getting a test of the low from the big decline last Monday which is to be expected as many times it takes multiple tests before support really sticks. This is now the moment of truth as this low needs to hold support or a bigger decline can be expected. There is the 200 dma, the time cycle low and the very high volume spike from last Monday, in the down to up volume chart, that are showing this could be an important low.
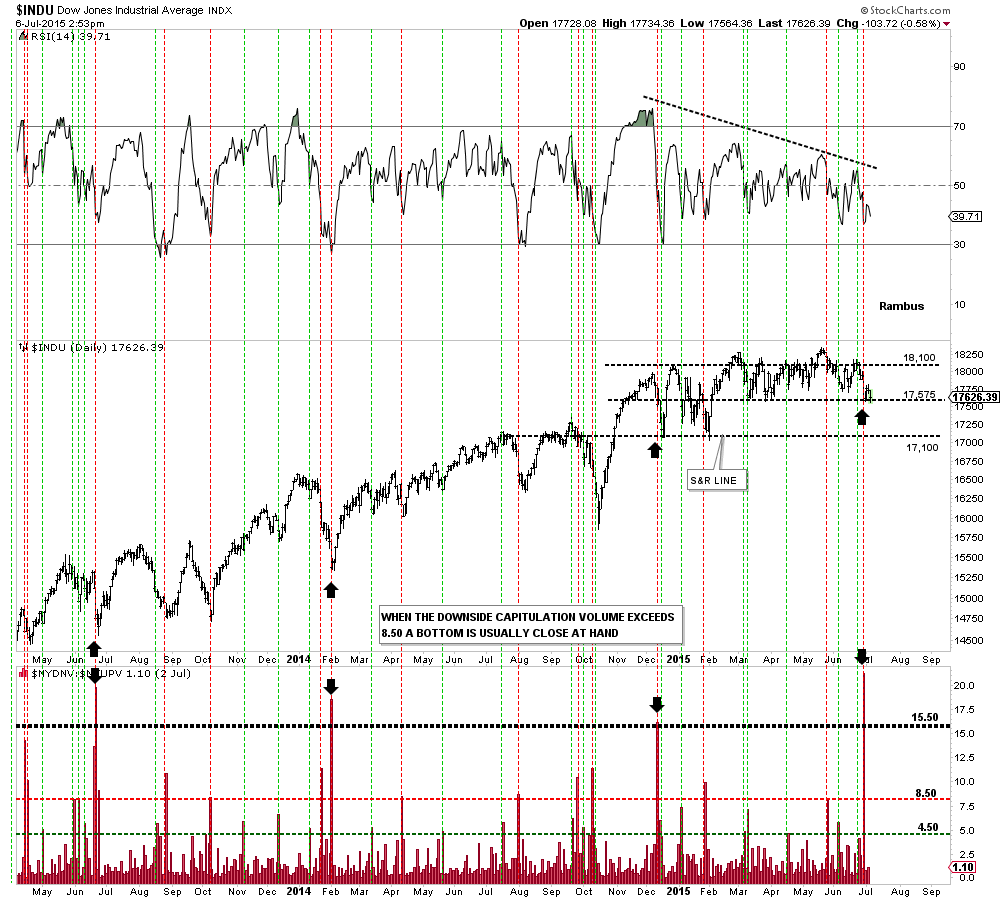
The down to up volume chart shows the low from last Monday had a very large capitulation spike that was the highest since 2012 or so.