A Lot of members ( and Outsiders) are expressing disbelief ,and of course, some goldbugs outright ridicule, for Rambus Weekend Report with very dire “potential” prices for Gold and the prediction that the Dow et al will Outperform Gold for a long time going forward.
GOLD INTERESTING POTENTIAL TARGETS https://rambus1.com/2017/07/09/weekend-report-135/
Personally I understand why these charts and what they are implying can be very disturbing to Gold Investors …BUT I have found by experience that dismissing Rambus Long term Charts and Analysis out of hand is usually a Big Mistake.
Here are some examples of other LONG TERM calls that were ridiculed and dismissed as coming from a lunatic.
Note the links to the complete posts are provided but for those too busy to read them all , the key chart from these posts is just below the link.
……………………………………
THE JAWS OF LIFE : October 2014
There seems to be a lot of confusion out there as to whether the stock markets are bullish or bearish. Is the Dow Jones in a topping pattern as so many analysis are suggesting? I’ve seen some charts that are calling the big trading range , on the Dow Jones going all the way back to the 2000 bull market top, THE JAWS OF DEATH. Man it doesn’t get anymore dire than that. As usual I have a different take on the JAWS OF DEATH, which I would like to share with you tonight .
Before we look at the first chart for the Dow Jones I need you to clear your mind of everything related to the stock markets in any shape or form. That means no Elliot Wave counts, Time Cycles, Gann Lines , volume studies, no indicators of any kind. Clear your mind of every article you’ve ever read on the stock markets, bullish or bearish. And last of all, NO CHARTOLOGY. I want you to look at just the pure price action without any bias whatsoever. From that point we can then start to see what is really happening to the Dow Jones and related markets .
https://rambus1.com/2014/11/19/wednesday-report-49/
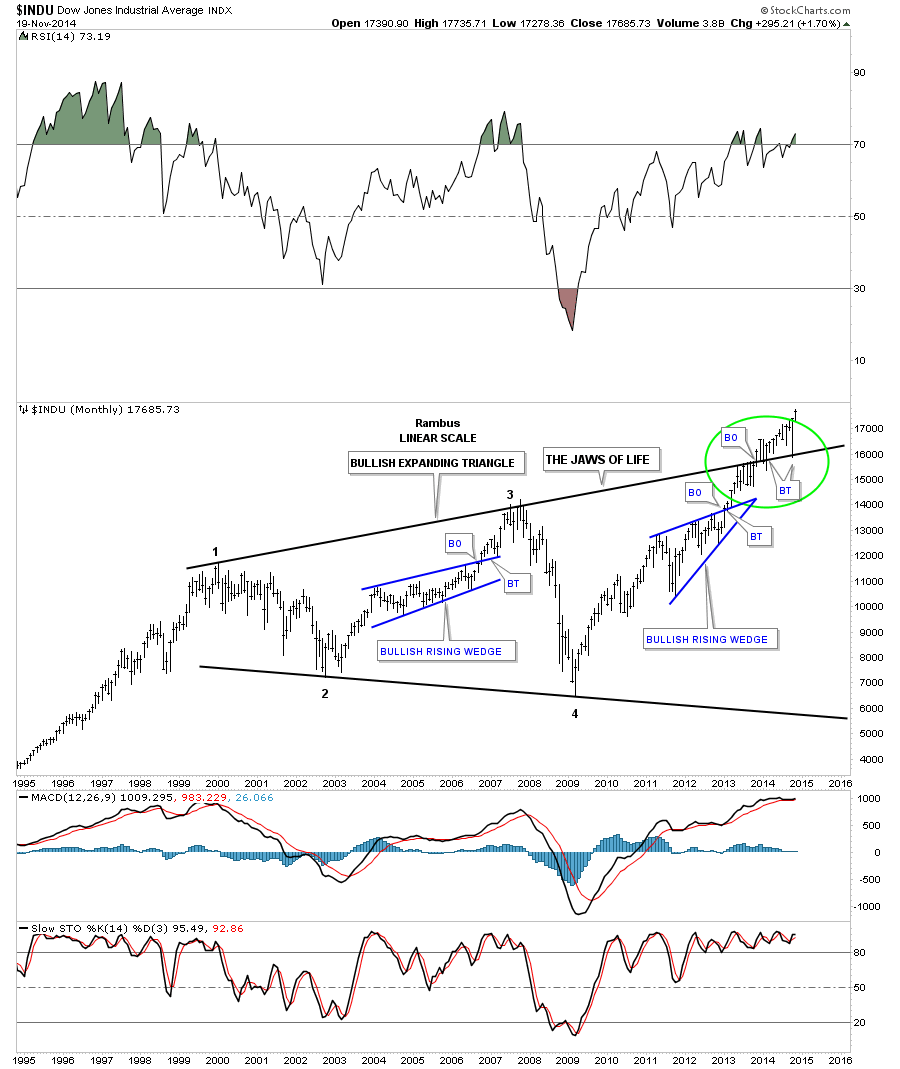
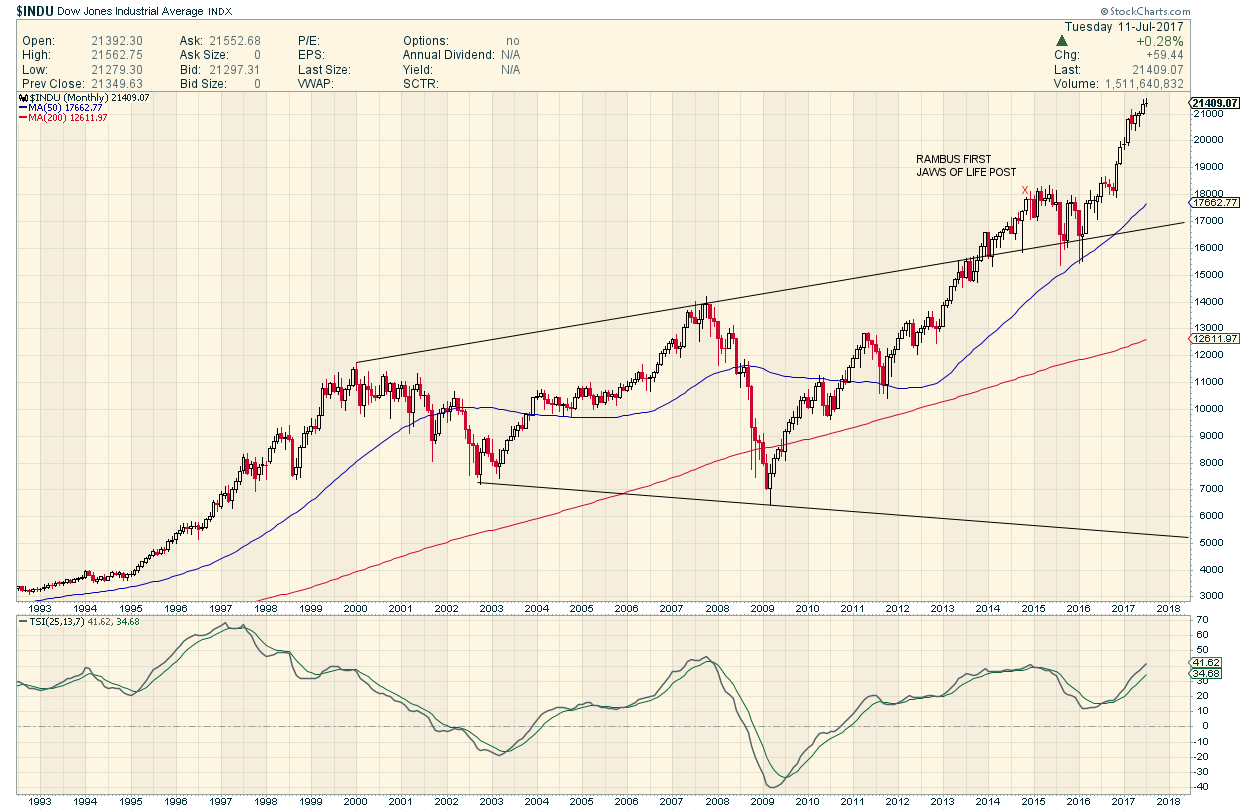
So…here is what happened…The call was made at the end of 2014…after that 2015 saw 2 hard back tests to the top jaw and then since 2016 a big rally has ensued. it would be easy to have given up on this call but that top line ultimately held.
…………………………………………………………………………
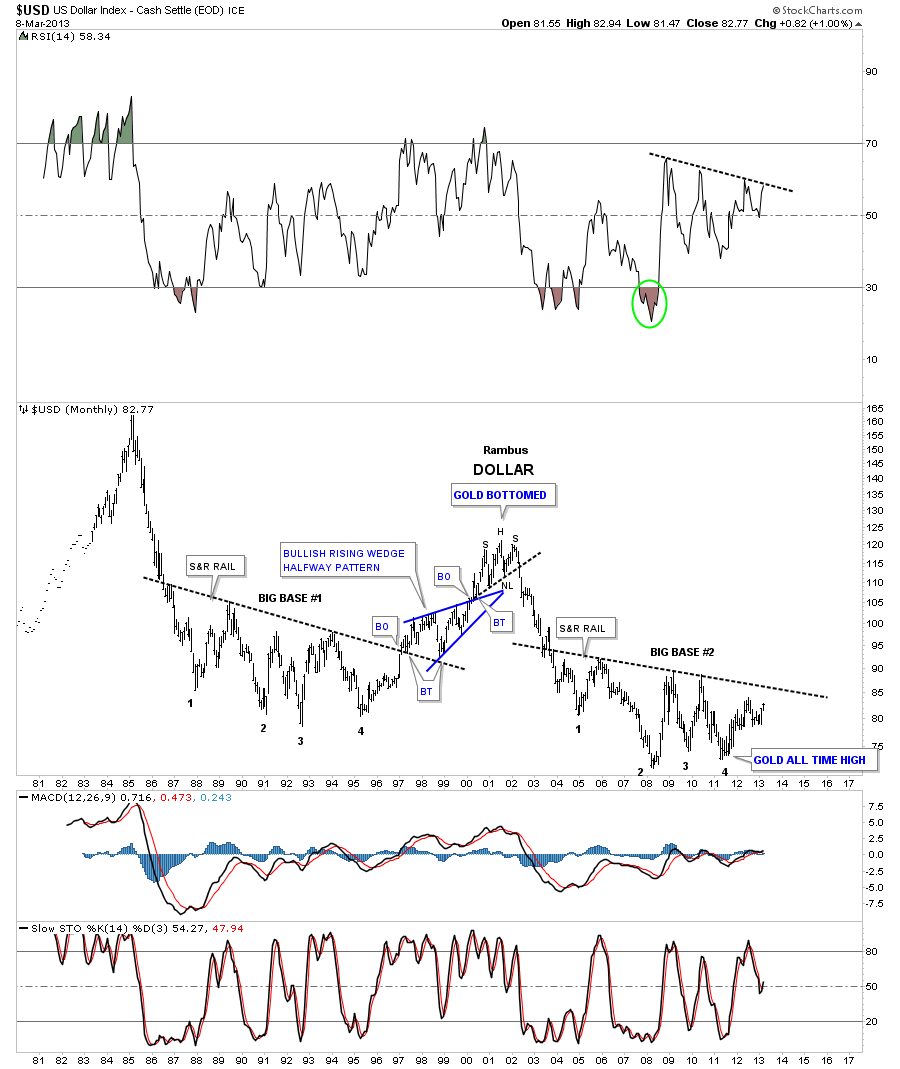
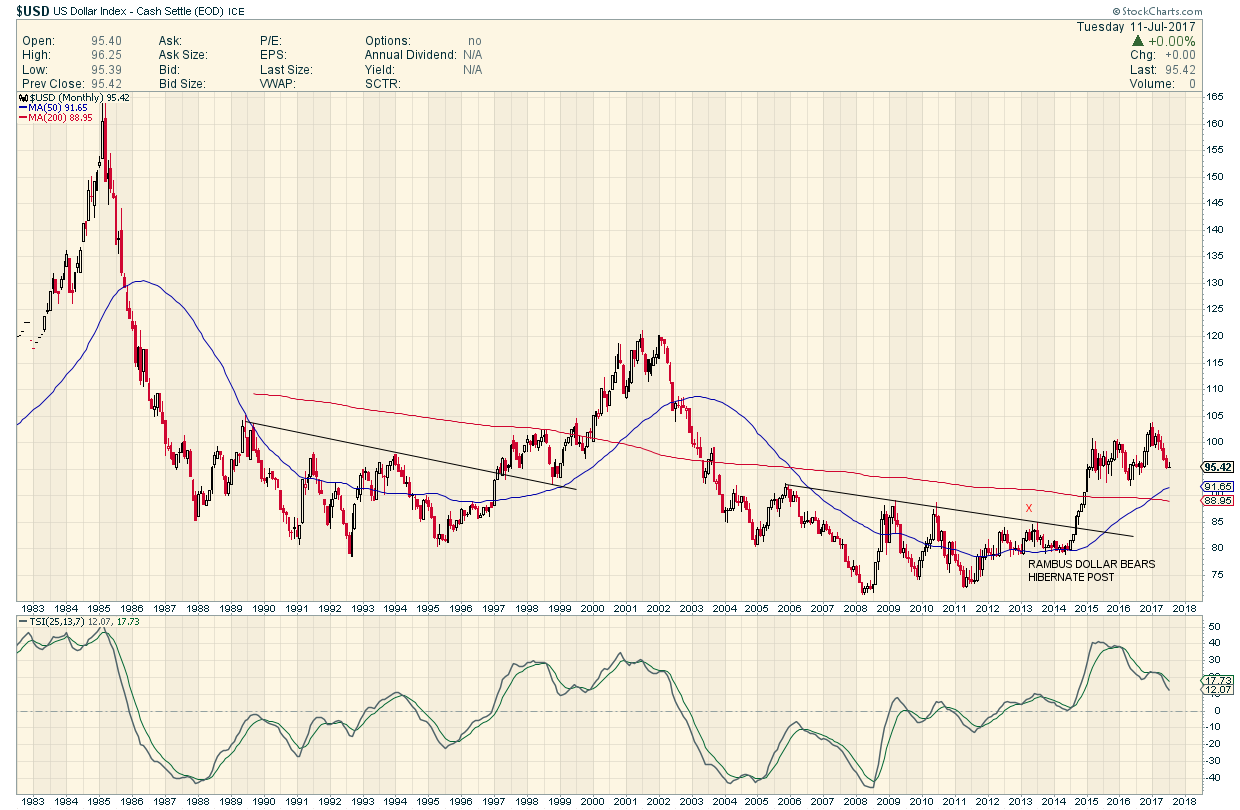
US DOLLAR BEARS PREPARE TO HIBERNATE MARCH 2013
https://rambus1.com/2013/03/10/dollar-bears-about-to-go-into-hibernation/
Here is what happened next :
After 15 more months of going sideways to down , The dollar suddenly took of in a strong impulse move. from 80 to 100. (Rambus still hasn’t given up on the idea this consolidation is a halfway pattern ) TBD.
………………………………………………………………….
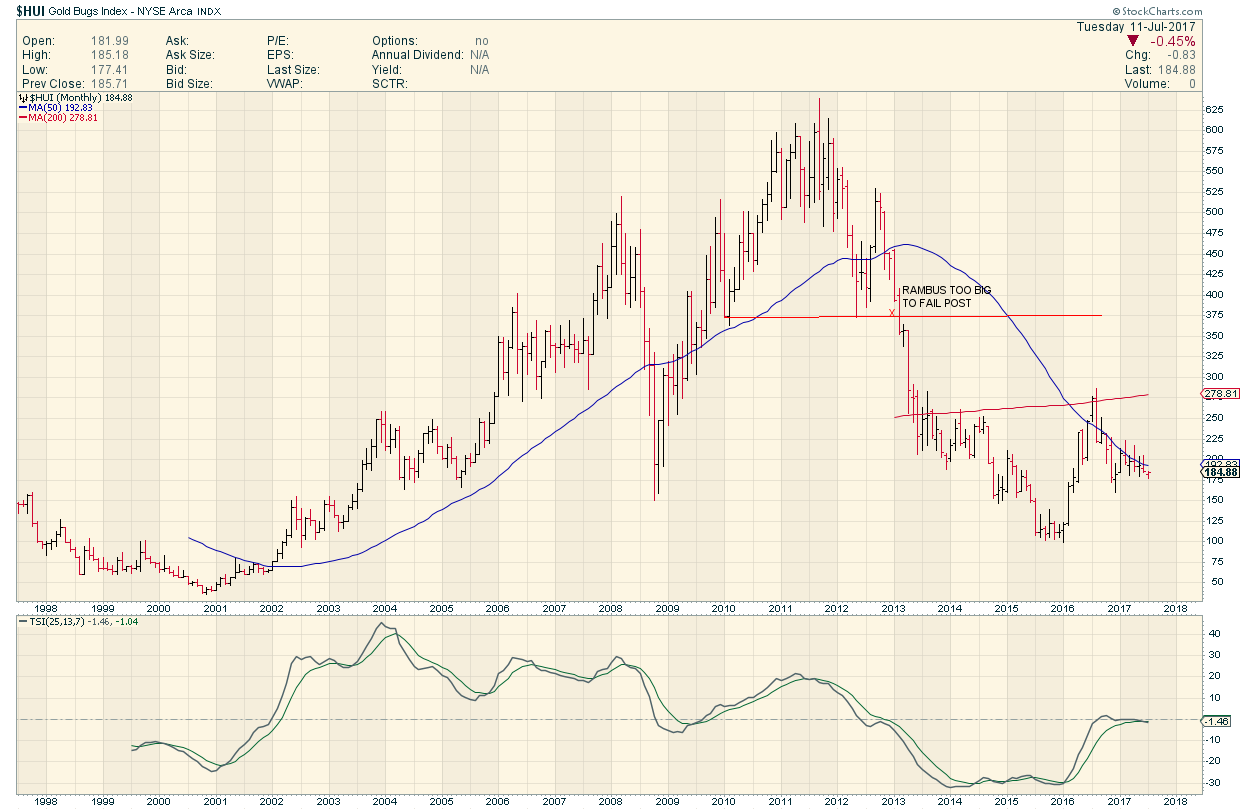
PRECIOUS METALS STOCKS TOO BIG TO FAIL : FEBRUARY 2013
https://rambus1.com/2013/02/22/precious-metals-stocks-too-big-to-fail/
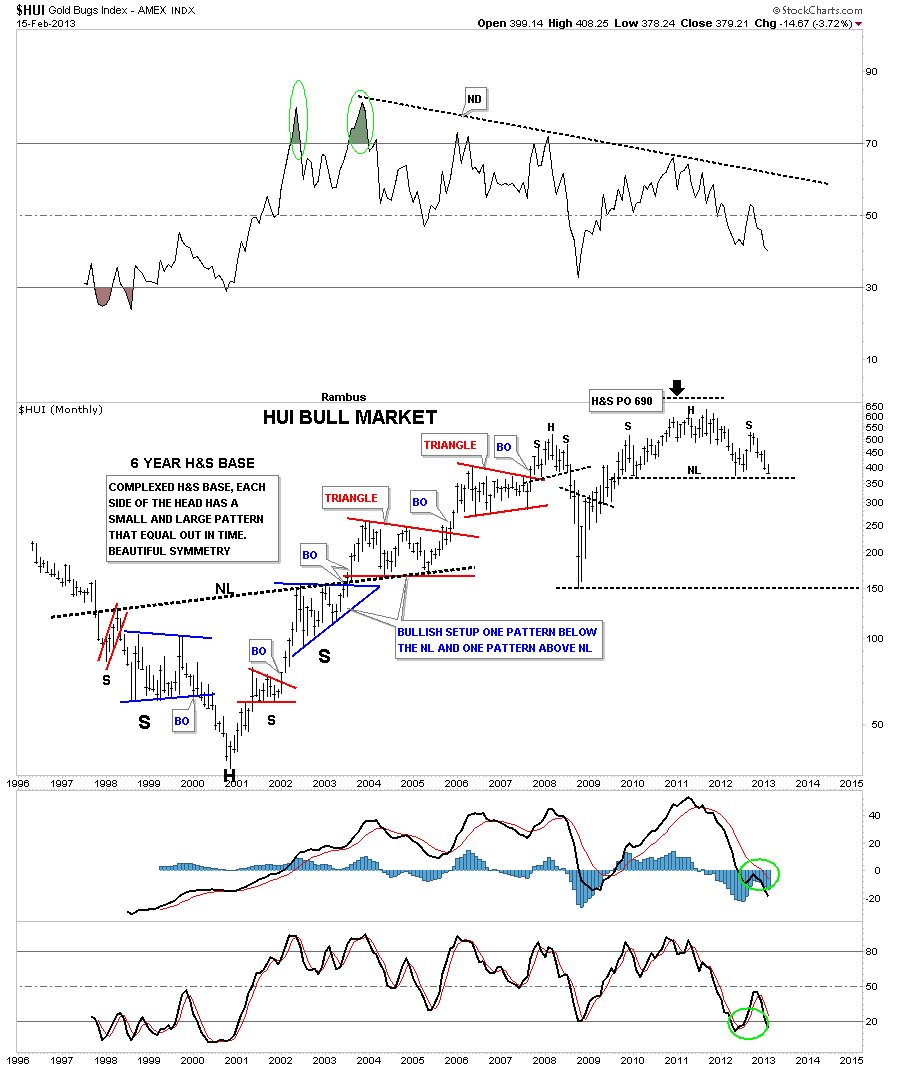
What happened next ?
HUI failed and fell to 100 before recovering
……………………………………………
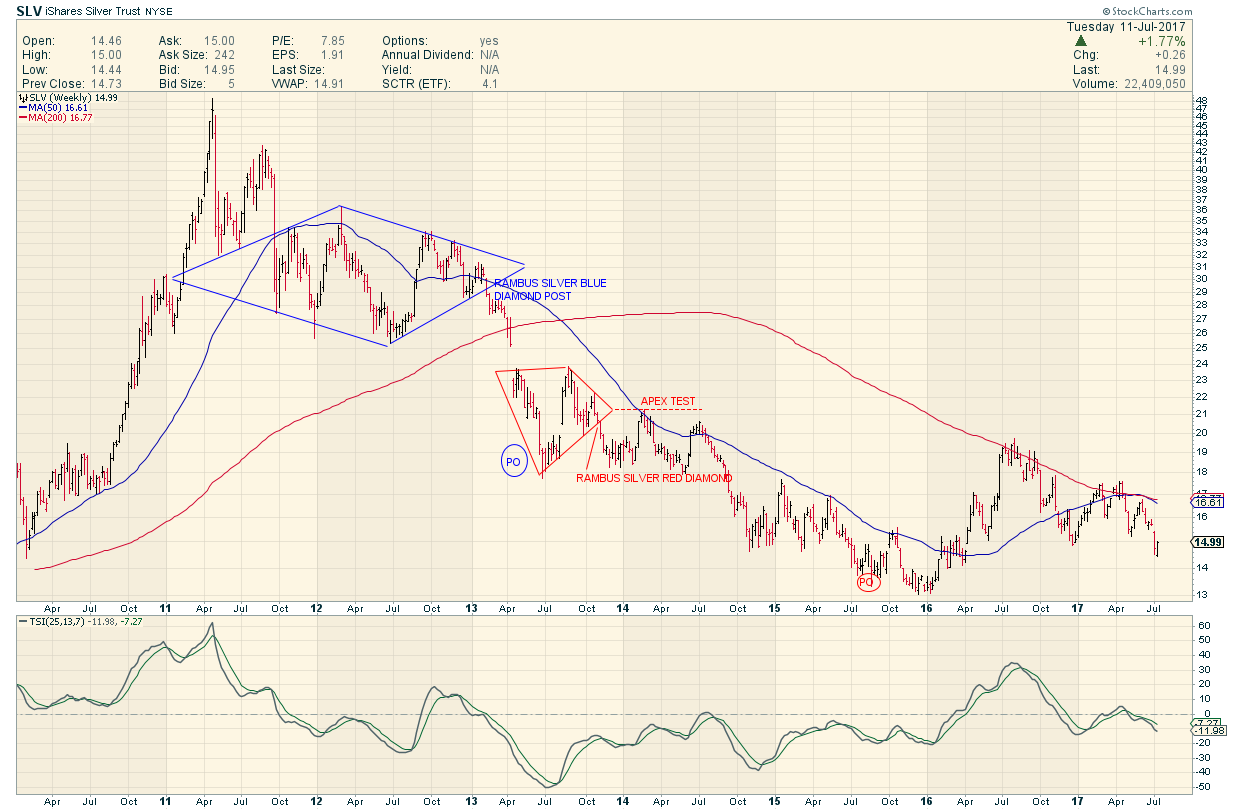
Here is a Call on Silver (via SLV) that I couldn’t believe at the time .”SLV BLUE DIAMOND” January 2013

Followed soon after by “SLV RED DIAMOND” November 2013
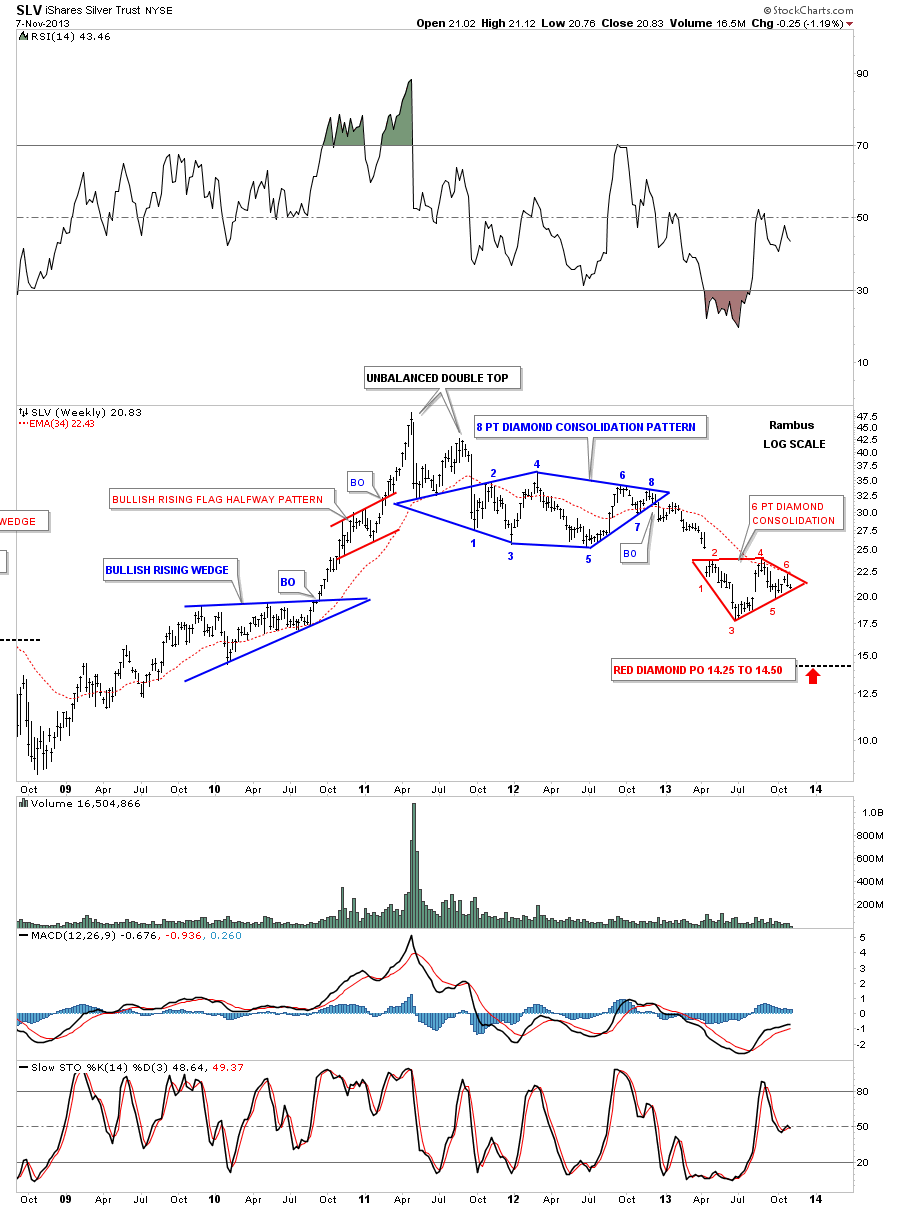
And then: Look at those POs
………………………………………………………….
One More :
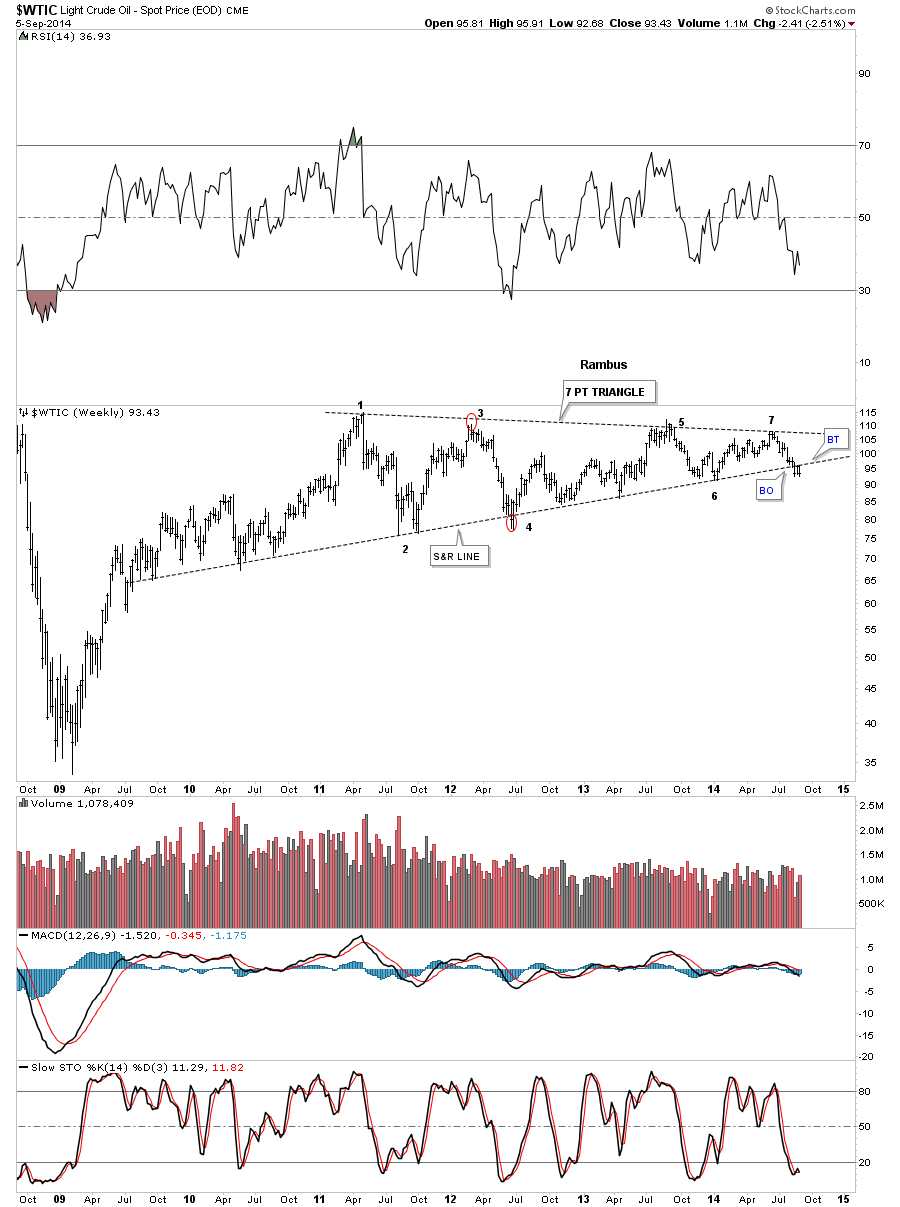
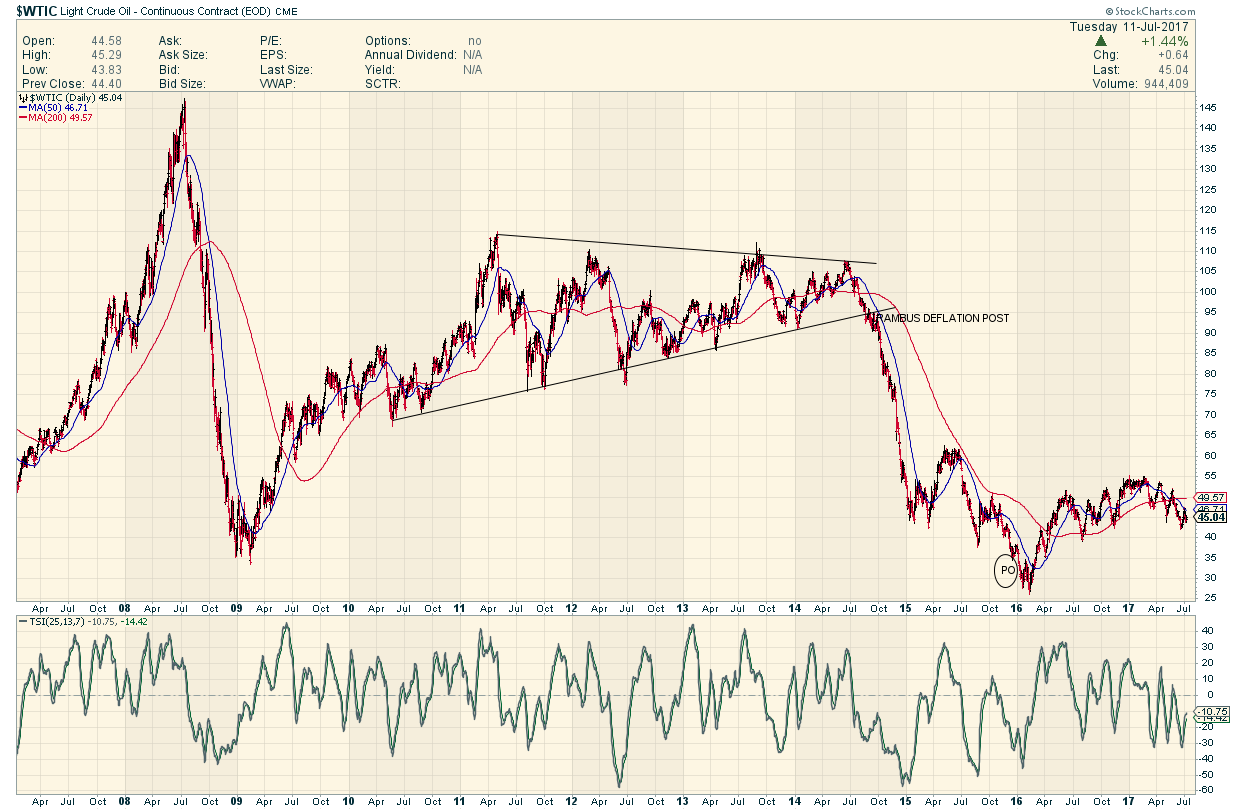
BLACK FRIDAY IN THE ENERGY MARKETS is a compilation of a long term call made initially September 2014..The Compilation follows the evolution of this thread which was posted as Friday Nite Late Charts…
https://rambus1.com/2014/11/29/friday-night-charts-21/
And then
………………………………………
So: as I started to say. After seeing all these Long term calls. You would agree that discounting Rambus long term work can be hazardous to your financial health.Since these are long term , as you have seen , they do take time and twists and tradable turns to fulfill however.
No guarantees of course but the track record for long term is pretty good eh ?
Fullgoldcrown
……………………………………………………
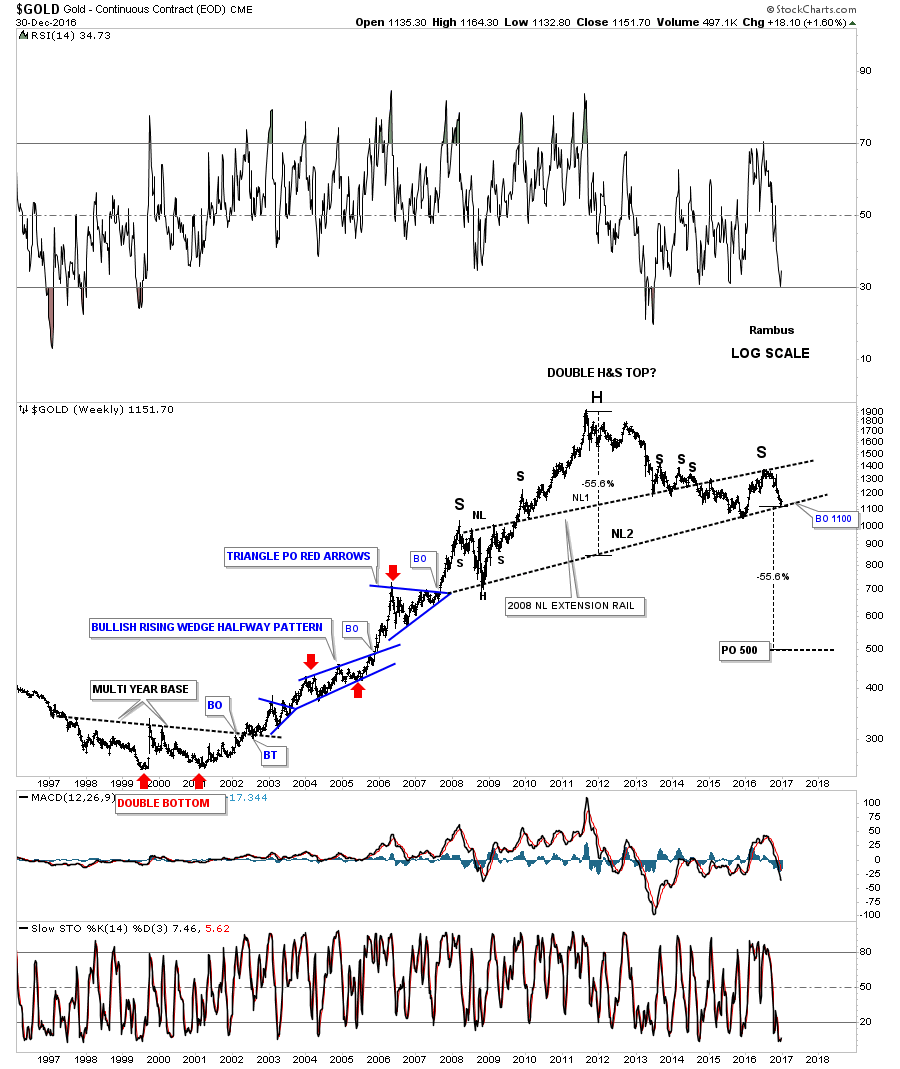
WHAT IF GOLD HAS A DROP DEAD LINE ? January 2 2017
Now I would like to start showing you the very big picture which begins to bring all the pieces of the puzzle together. This first weekly bar chart for gold shows the potential massive double H&S top with the 1100 area being the most important price point for gold at neckline #2. If neckline #2 gives way the price objective will be down to the 500 area, which seems impossible at this time, but big patterns create big moves. Note the multi year base made back in the late 1990’s which launched gold’s bull market that took over five years to build out.