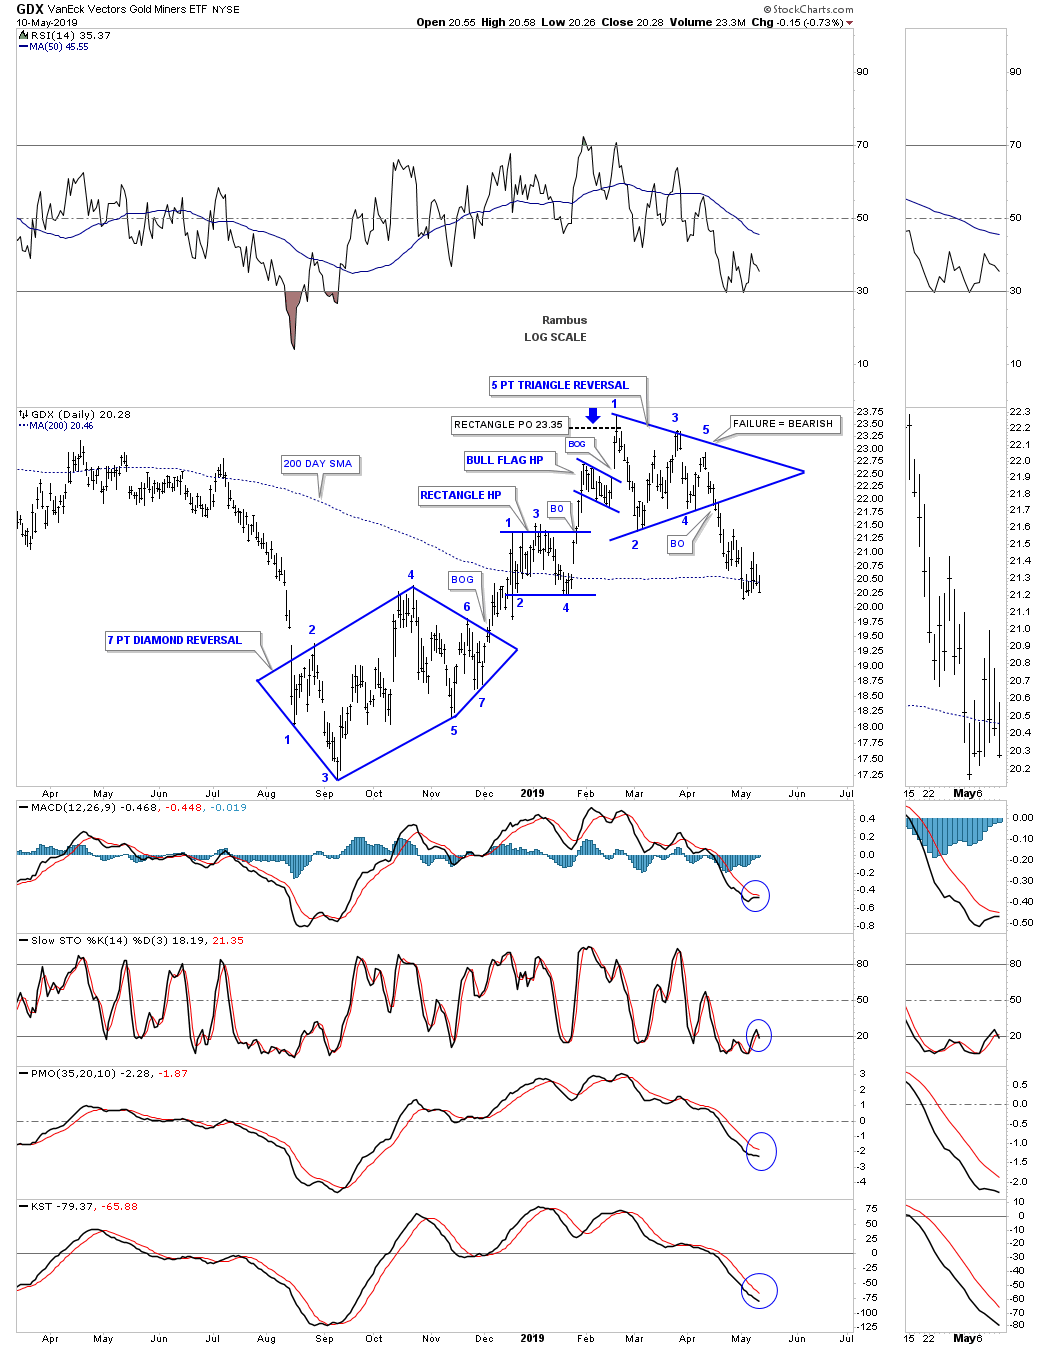
Before we look at the longer term weekly and monthly charts lets review the daily chart for the GDX we’ve been following which shows the rally from the September 2018 low to the February 2019 high. That five month rally looked promising but it failed to deliver a new impulse move higher to break the back of the bear market that has been in place since the 2011 high.
Below is the daily chart for the GDX that showed the potential to change the character of the bear market and set the tone for a new and strong impulse move out of the 2018 low. If you recall there was a lot of chopping action at the 2018 low which didn’t make a whole lot of sense in the beginning but as time passed by a reversal pattern began to show its self which turned out to be that seven point diamond reversal pattern. Since the price action had been declining into the 2018 low we need to see some type of an odd number of reversal points pattern buildout to reverse the downtrend. The reversal pattern we got was the seven point diamond.
After the breakout above the top rail of the seven point diamond the price action had a mediocre rally which topped out at the first reversal point in the blue rectangle, which turned out to be a halfway pattern to the upside. After chopping around for about three weeks the GDX broke out above the top rail of the blue rectangle halfway pattern which ended at the first reversal point in the blue five point triangle reversal pattern top. On the way to the February top the price action formed a small blue flag halfway pattern which measured almost exactly to the February high.
The Chartology still looked pretty good when the 5 point triangle began to buildout. This was a critical area to watch because if the new bull market was really going to take off we should see some type of consolidation pattern buildout and carry prices to a new rally high. The sideways chopping action began on February 20th at reversal point #1. All looked good until April 10th when the GDX failed to make it all the way up to the top rail at reversal point #5. It still was’t the end of the world but a warning flag went up. Many times the last rally during a 5 point reversal pattern will fail to reach the top rail which strongly suggests weakness and in this case it meant the bulls were running out of gas.
Once the price action broke below the bottom rail of the blue 5 point triangle reversal pattern the uptrend off the September 2018 low was officially over. What we ended up with out of the September 2018 low were two reversal patterns with two small considation patterns in between. A true impulse move failed to take hold which was another red flag that the new bull market for the GDX wasn’t ready yet for prime time.
Now we’ll look the exact same chart in which I will put a top and bottom trend line to define the September to February rally phase. What the price action now shows is the black expanding rising wedge which was most likely confirmed at the breakout and backtest point on the bottom rail. What we have is nothing more than a bear market rally in the secular bear market. For some folks it may be a hard pill to swallow but for others it can be an opportunity to play the downside. For those that maybe long the PM stocks they could put on a hedge to protect their losses. There is always a positive element if you know where to look.
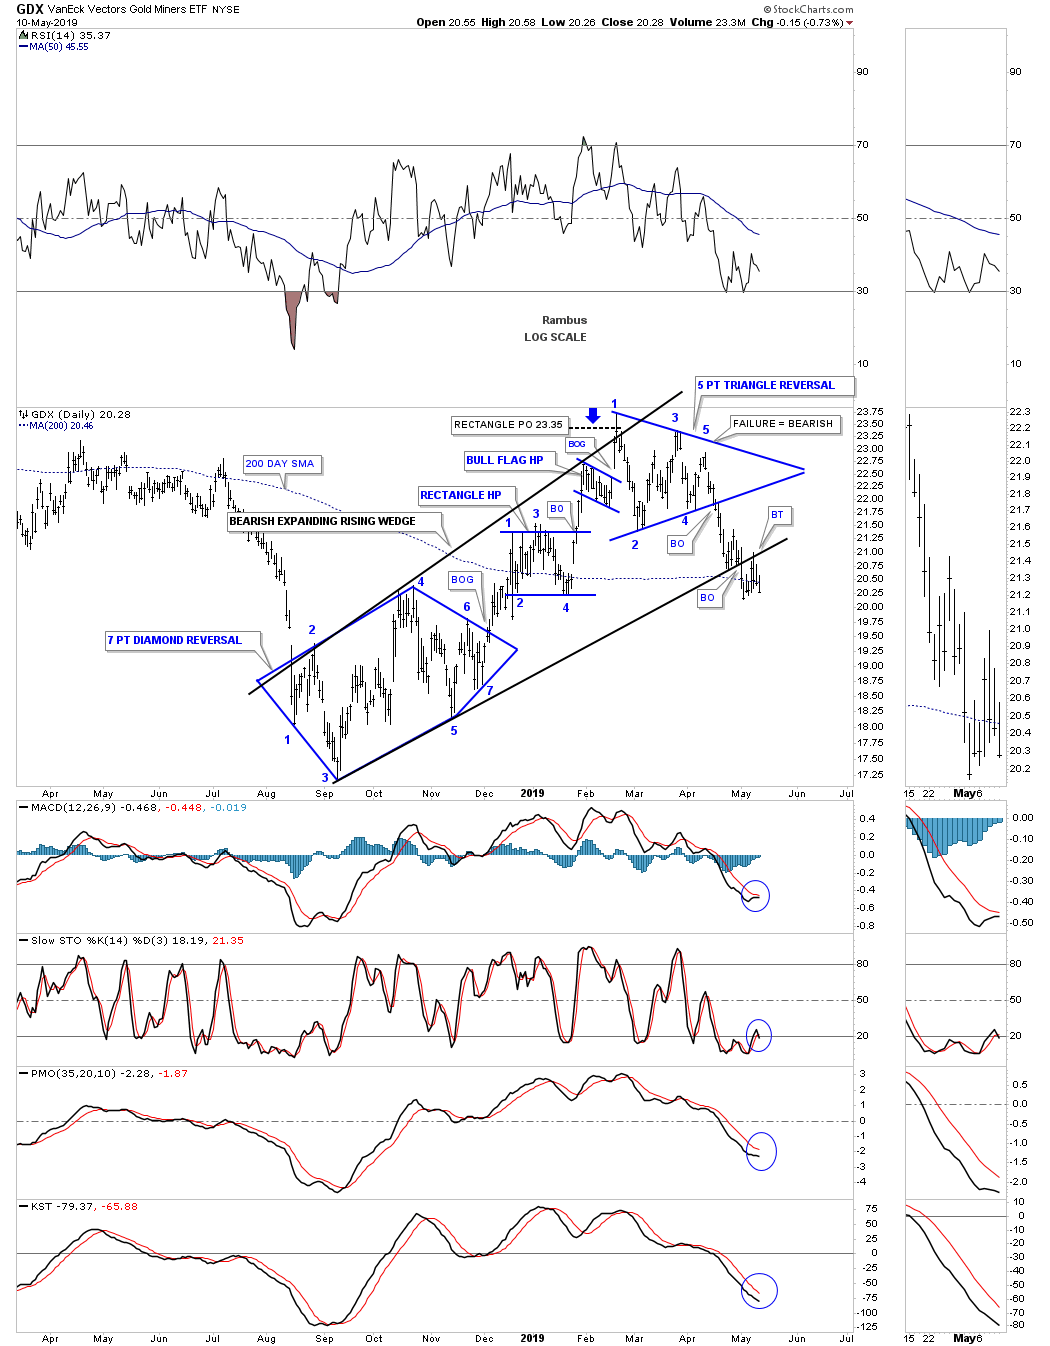
Now that we are armed with new information about the September to February bear market rally, how does that fit into the bigger picture? As you know I’ve been looking at the 2016 trading range as a falling wedge formation for quite sometime. I’ve shown you recently how the top rail on the 2016 falling wedge for the HUI is failing to hold support which is not what you want to see if the pattern is valid. When you see a failure like that it means you have to go back to the drawing board to find out why the pattern is failing. The bearish expanding rising wedge on the daily chart above gives us some very important information we can put on the longer term weekly chart.
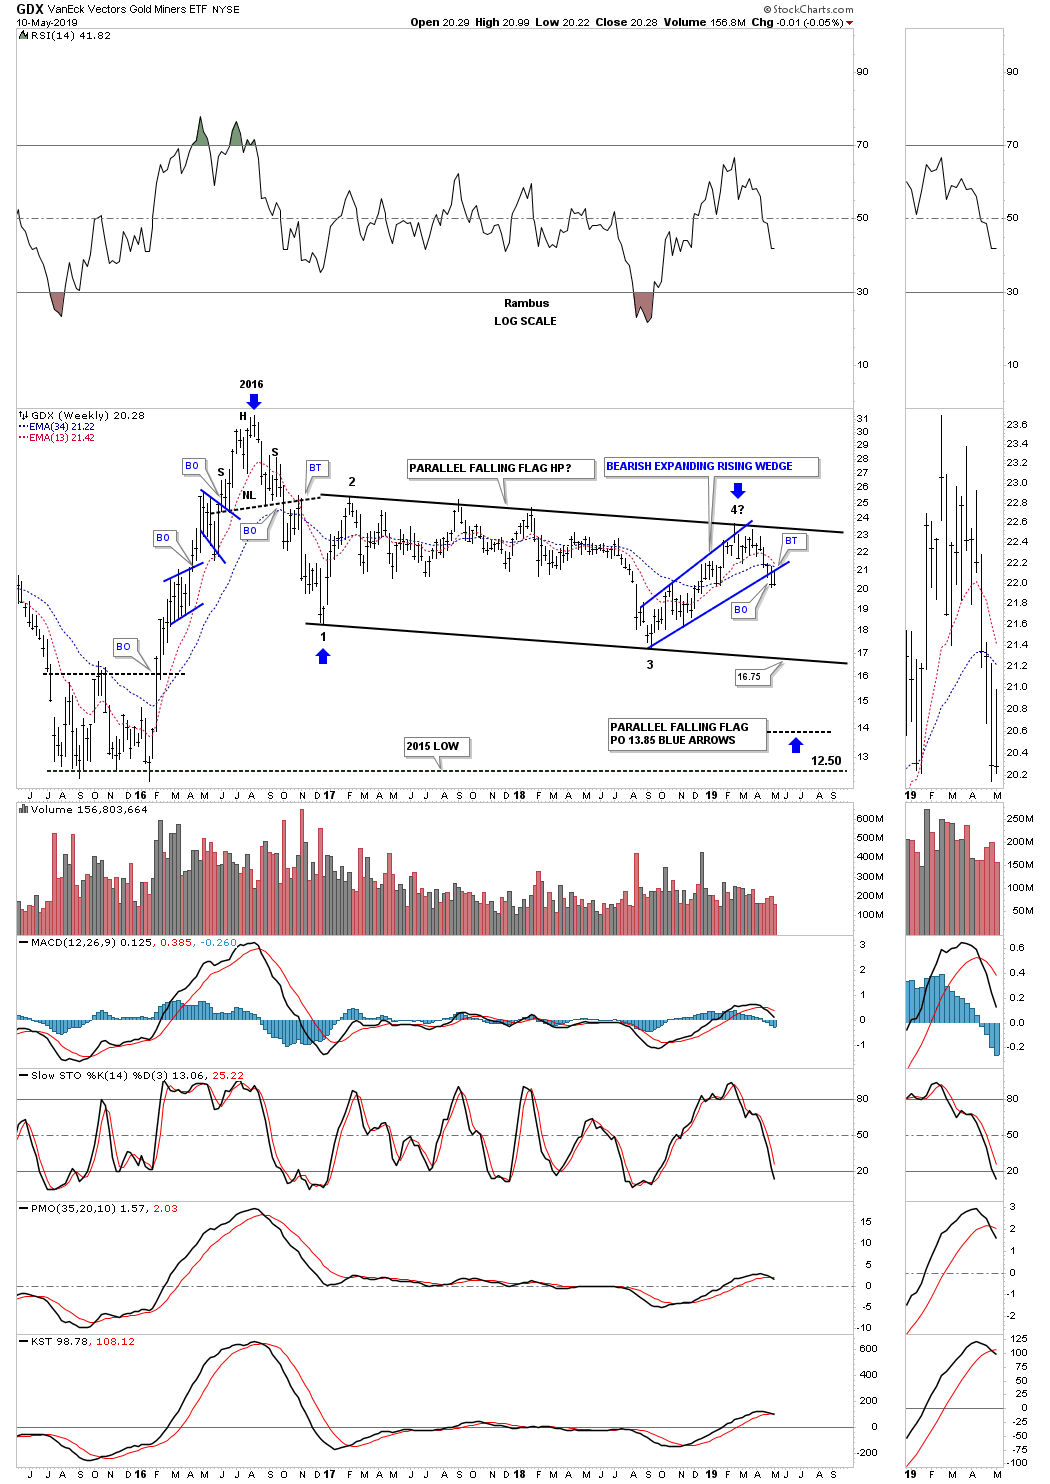
Instead of starting my top trendline from the 2016 high I started it from the first reaction high at reversal point #2. From reversal point #2 you can still see that slow and painful chopping action to the downside ending at reversal point #3. The rally that began at the September 2018 low to the February high now gives us a very symmetrical parallel falling flag formation with the blue bearish expanding rising wedge being the 3rd and 4th reversal points. A touch of the bottom rail of the 2016 parallel falling flag at 16.75 will complete the fourth reversal point in what I think could be a halfway pattern to the downside. If that is the case the two plus year parallel falling flag halfway pattern will have a price objective down to the 13.85 area as shown by the blue arrows which shows the impulse measuring technique.
Note the difference between the 2016 impulse move up and our September to February rally phase. That strong impulse move in 2016 shows two small consolidation pattens which is common is strong impulse moves. The September to February rally looks nothing like the 2016 rally but more like a bear market rally inside of a trading range.
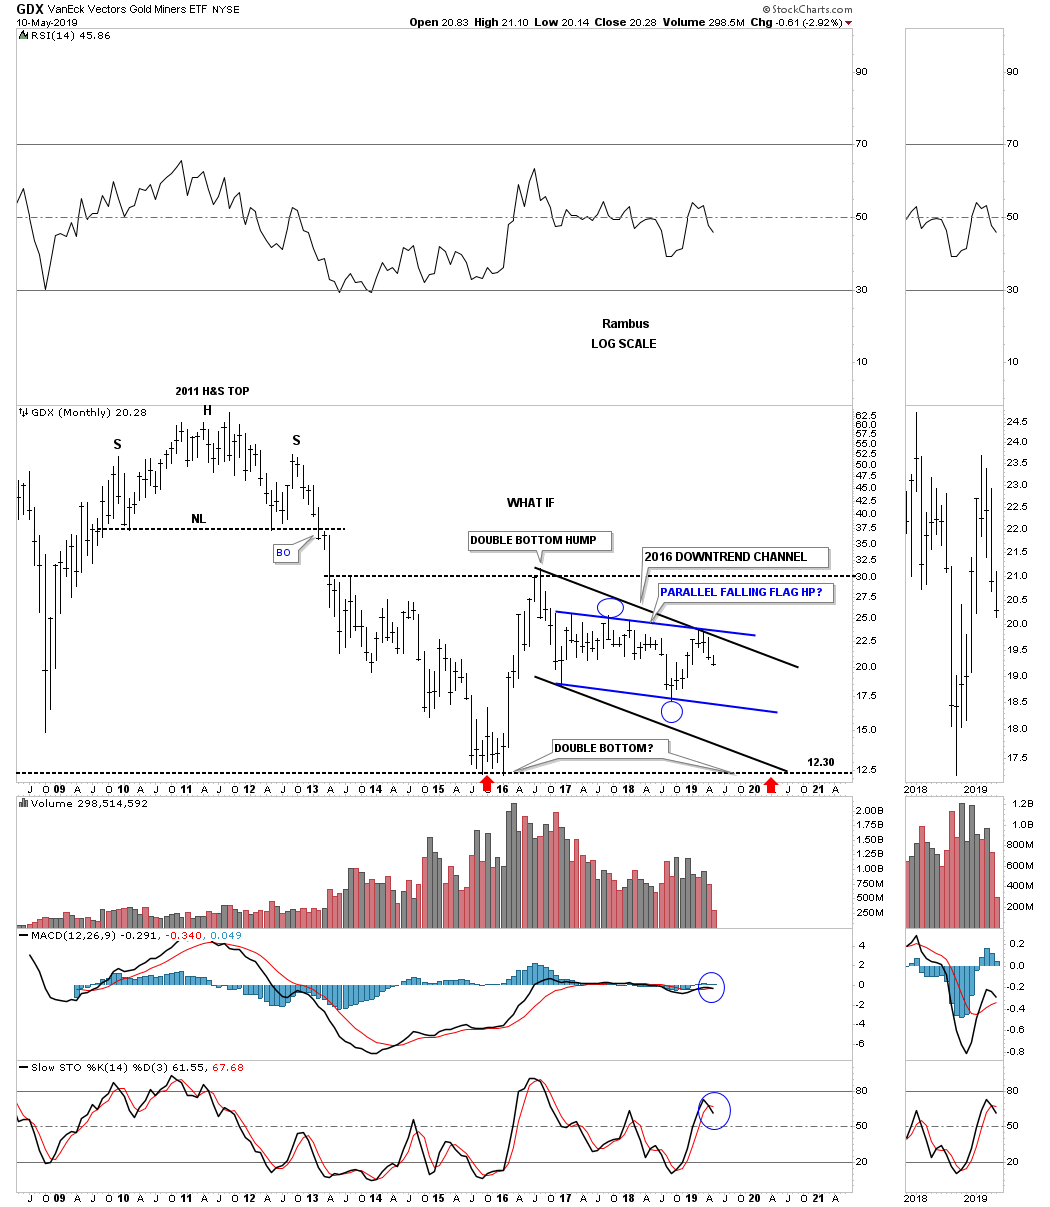
Now we need to put the daily and weekly patterns on the charts above on a long term monthly chart to see how they fit into the very big picture. Since the parallel falling flag is forming below the 2016 high it needs just four reversal points to be a consolidation pattern to the downside. As you can see the price objective for the falling flag is down to the 13.85 area which is just a point or so above the 2015 double bottom low.

This last chart is a, What If Chart, that is only speculation right now. I’ve added the two black trednlines which are parallel that could show the 2016 downtrend channel with the blue falling flag being the halfway pattern. We know that big patterns lead to big moves. What if the price action is going to build out a massive double bottom as shown by the red arrows? The Chartology is there for that to happen. It would be a fitting end to the 2011 bear market if we do get a massive double bottom to launch the next secular bull market. We now have the big picture to watch and as long as the price action keeps confirming the big picture it is what it is. Happy Mother’s Day tomorrow and all the best…Rambus