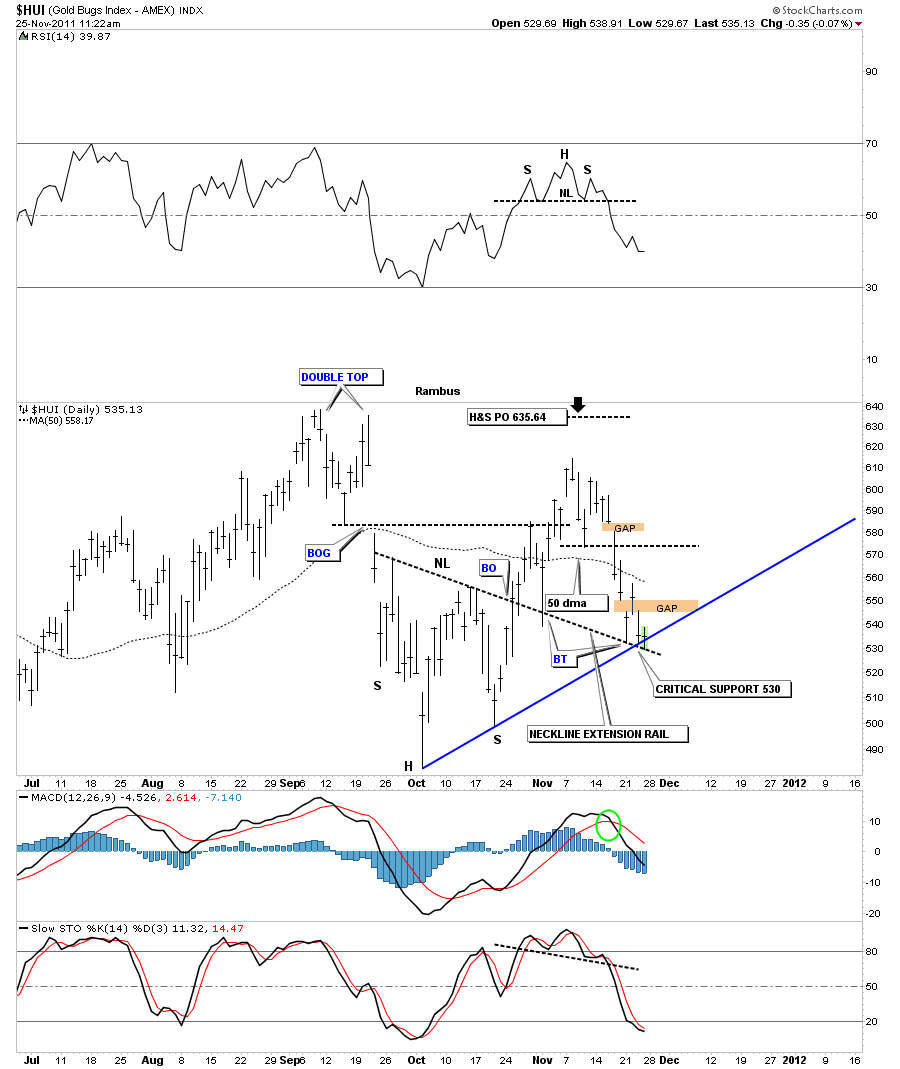
Below is our 6 month daily chart showing the inverse H&S bottom and the rally that ensued. After the first backtest to the neckline the HUI made a bee line straight to 615 that fell short of it’s price objective at 635. Now that we can look back at that failed price objective, at 635, I think it was a warning sign of weakness. Now on to our current area of support at the 530 area. We had another test of that low this morning. By looking at many other individual precious metals stocks and the bear flags that I’m seeing I think the 530 area in going to fail. But if your a hardcore gold bug and just have to buy you have a good low risk entry point right here with a sell/stop place below the neckline extension rail.
HUI 6 month daily 530 support zone.

