Wednesday Report…US Dollar Ratio Charts Are Telling a Very Important Story

Before we look at tonights charts I would like to take a minute and explain to our new members how we manage the different portfolios. We have 3 different portfolios, the Kamikaze, Leveraged and the PM Stocks Trade portfolios with each having $100,000. That $100,000 in each portfolio is then broken down into $5000 increments for each trade giving us a total of 20 trades for each portfolio. Currently we have just 4 trades in the Kamikaze Portfolio, 5 in the Leveraged Portfolio and 0 in the PM Stocks Trade portfolio. What that means right now is that we have a very high level of cash. It is completely up to you on how you want to manage your own portfolios. I just wanted to put this out there because sometimes we may have up to 20 trades in the Leveraged Portfolio, 20 trades in the PM Stock Portfolio and 8 to10 in the Kamikaze Portfolio, all at one time. It boils down to what the markets are giving us which sometimes is a lot and other times not much.

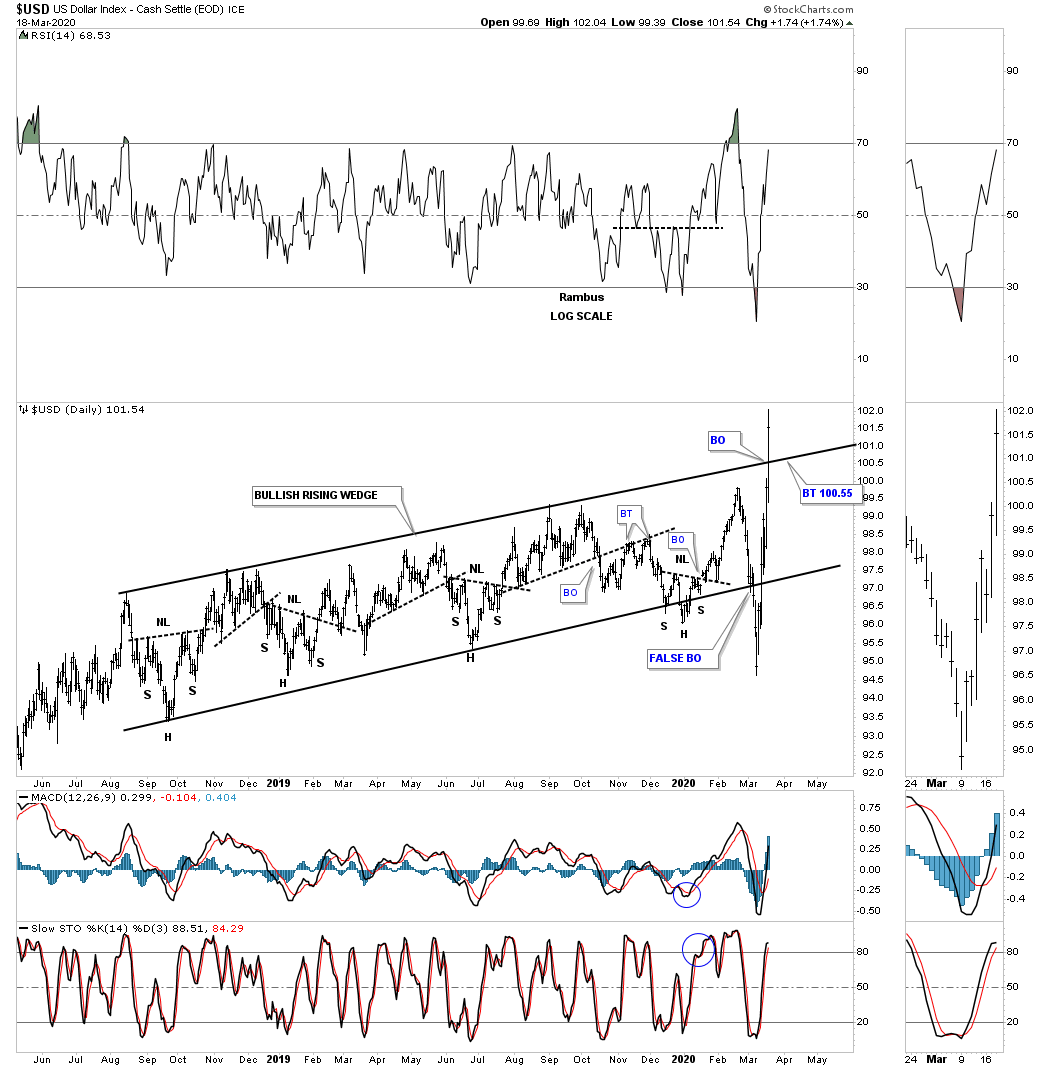
I would like to start by looking at some US dollar charts we’ve been following as its beginning to show some serious strength lately. This nearly 2 year daily chart shows the rising wedge we’ve been following for close to a year that has been trapped between the top and bottom trendlines. Recently there was a false breakout below the bottom rail which caused a whipsaw. Once the price action traded back inside of the rising wedge the false breakout was negated. Today the price action broke out above the top rail. What we need to see now is for the backtest to hold support to complete the breaking out and backtesting process.
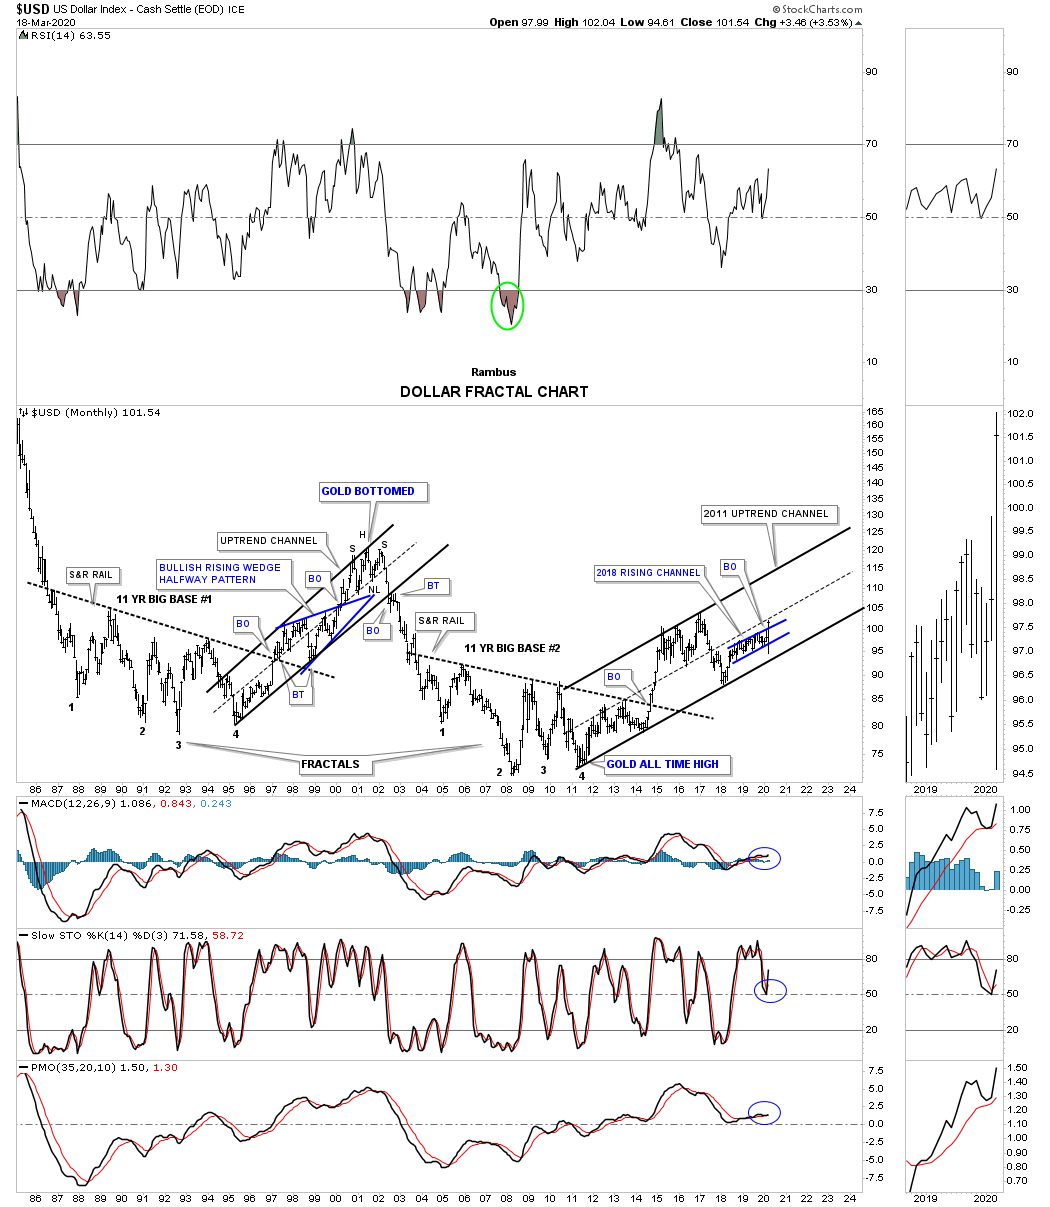
This next chart for the US dollar is a 35 year monthly look which shows how the bullish rising wedge on the daily chart above fits into the 2011 uptrend channel.
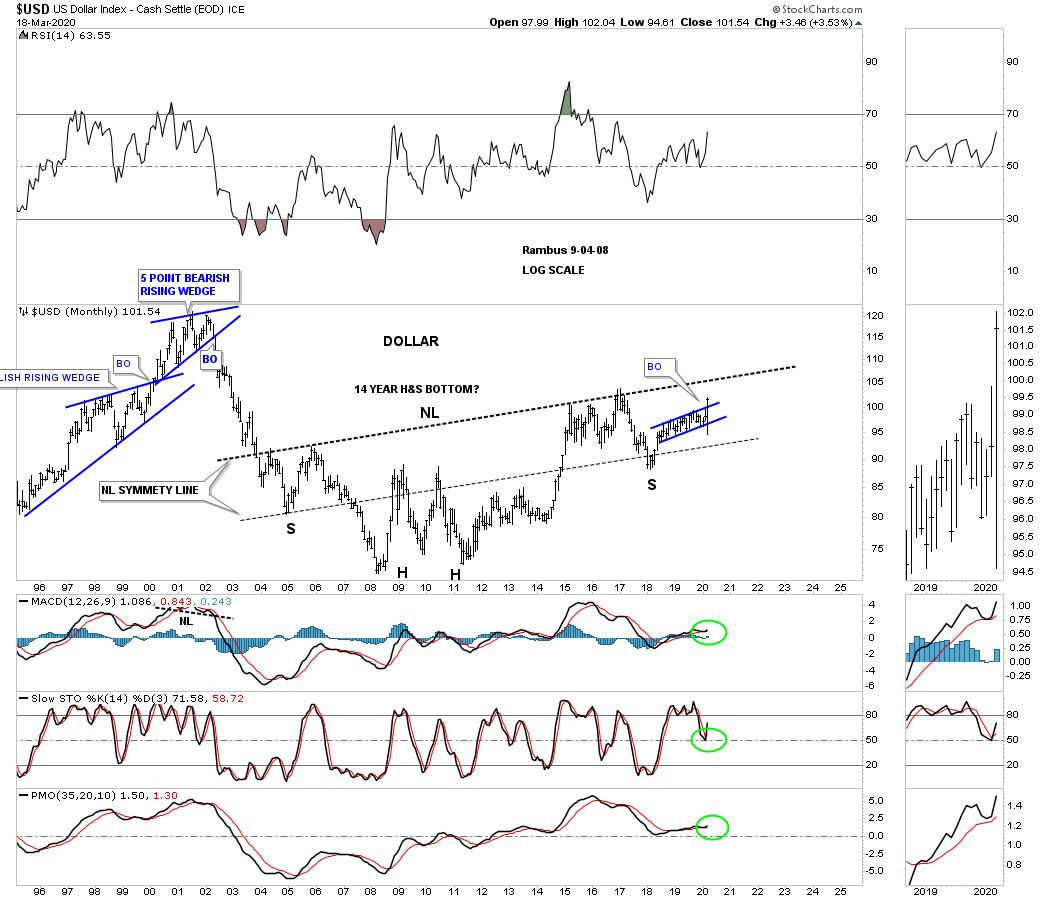
This last chart is a 25 year monthly bar chart for the US dollar I built several years ago which at the time I had no idea if it would play out. Big chart patterns like this can take a long time to come to fruition, but it does give you something to follow until something breaks down. Until something breaks down you just go with it. Note the blue rising wedge that we just looked at on the charts above that is forming as part of the right shoulder of a possible massive 14 year H&S bottom. All in all the symmetry has been pretty good as shown by the neckline symmetry line which shows the bottom for the left and right shoulders. Keep in mind the H&S bottom won’t be complete until the neckline is broken to the upside.
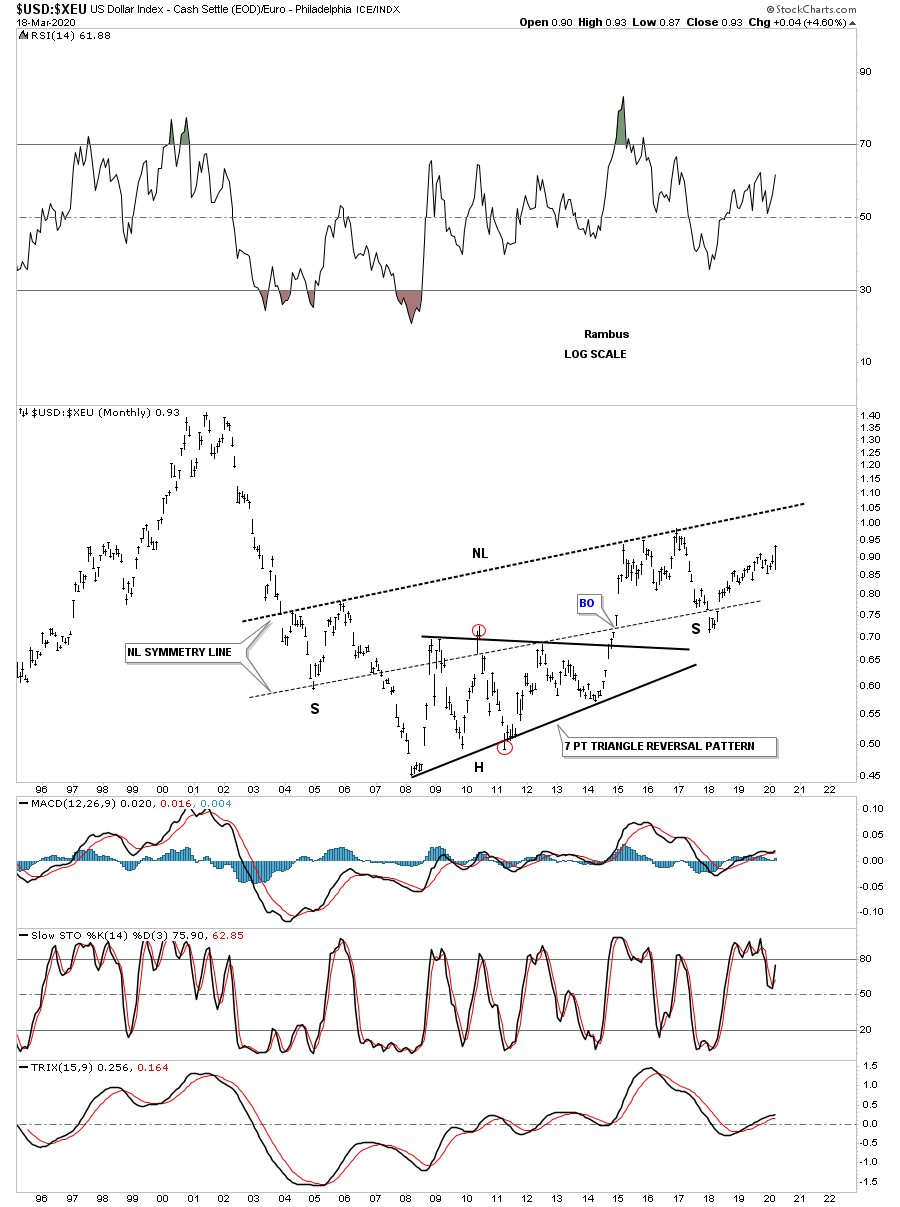
We know that there is a pretty close correlation for the most part between the US dollar and the Euro. If the US dollar is forming a 14 year H&S bottom then the odds are pretty high that the ratio chart, US dollar : XEU, should also be forming a massive H&s bottom which it is.
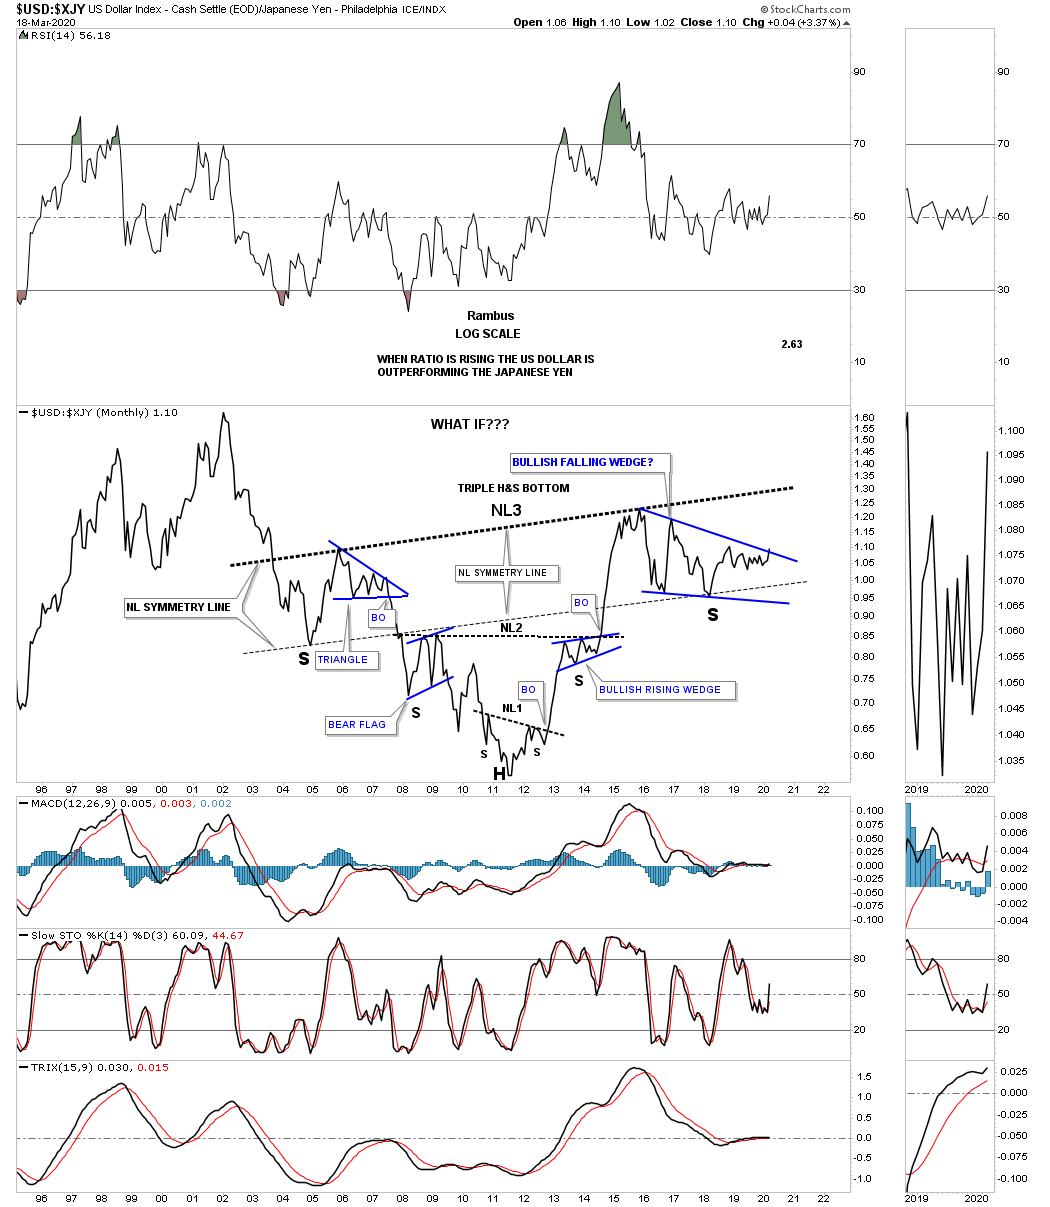
The same can be said for the USD:XJY ratio which is getting close to breaking out from the blue bullish falling wedge right shoulder. Again the neckline symmetry line is showing us the low for the left and right shoulder for neckline #3.
The US dollar to the Swiss Franc is also showing a massive H&S bottom.

I realize these massive H&S bottoms seem impossible for the average investor to believe. How can something 14 years in the making have any relevance to this time period?

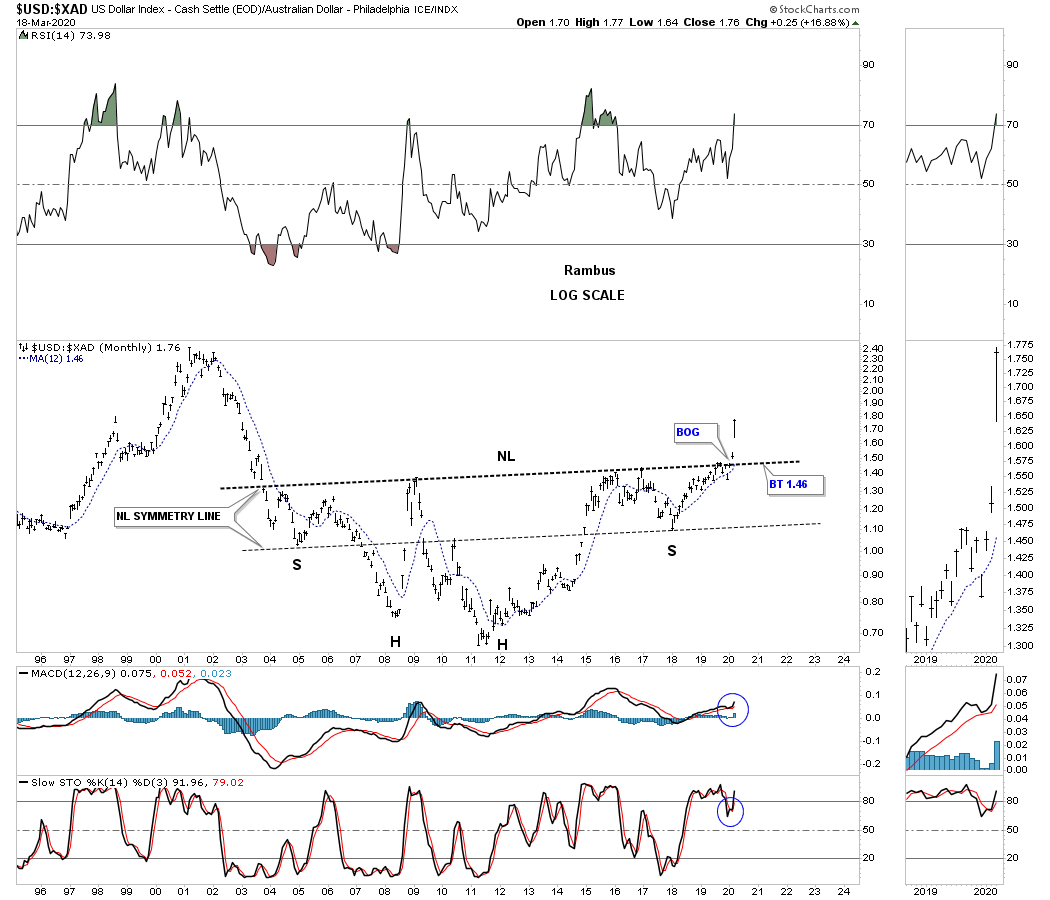
Below is the ratio chart which compares the US dollar to the Australian dollar.  While the ratio charts above still show the right shoulder under construction this ratio is breaking out from its massive H&S bottom complete with a breakout gap and neckline symmetry line.
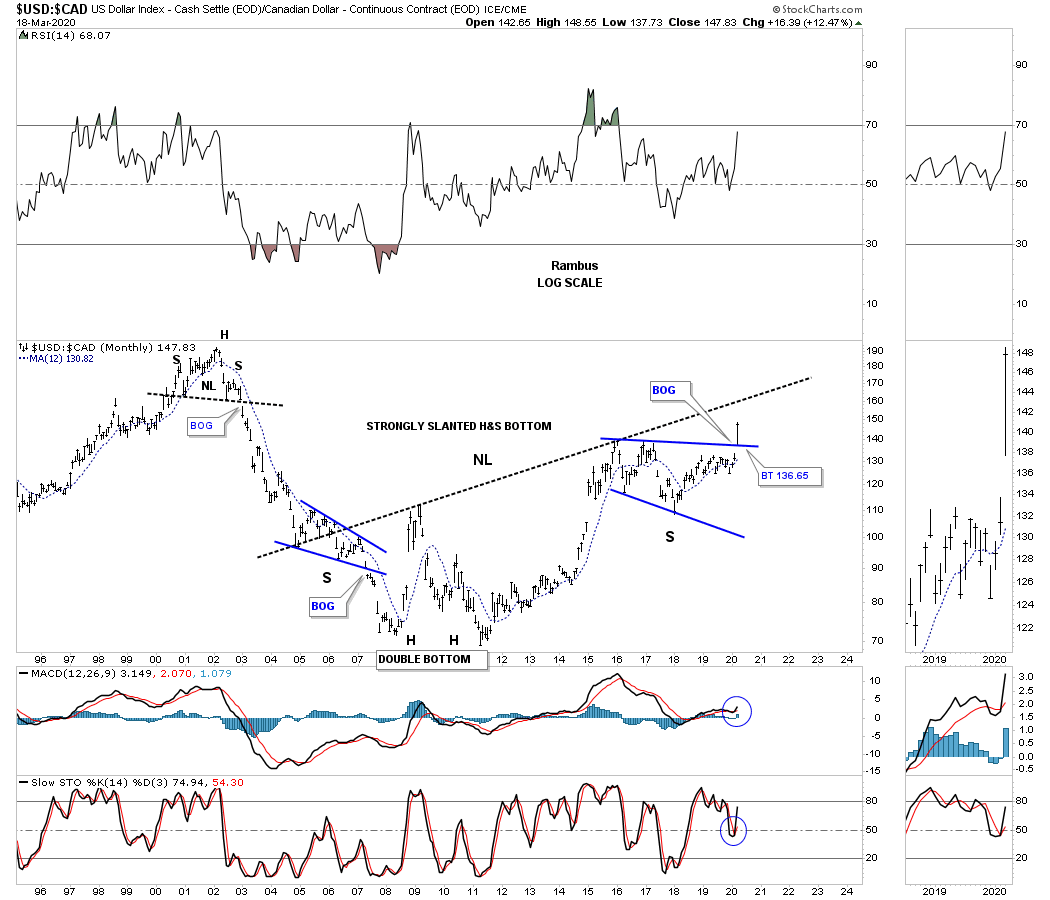
This last currency ratio chart compares the US dollar to the $CAD, Canadian dollar. This ratio is showing a strongly slanted H&S bottom with a breakout above the top rail of the blue bullish expanding falling wedge right shoulder. The breakout this week of the blue expanding falling wedge strongly suggests that the slanted H&S neckline is going to give way to the upside.
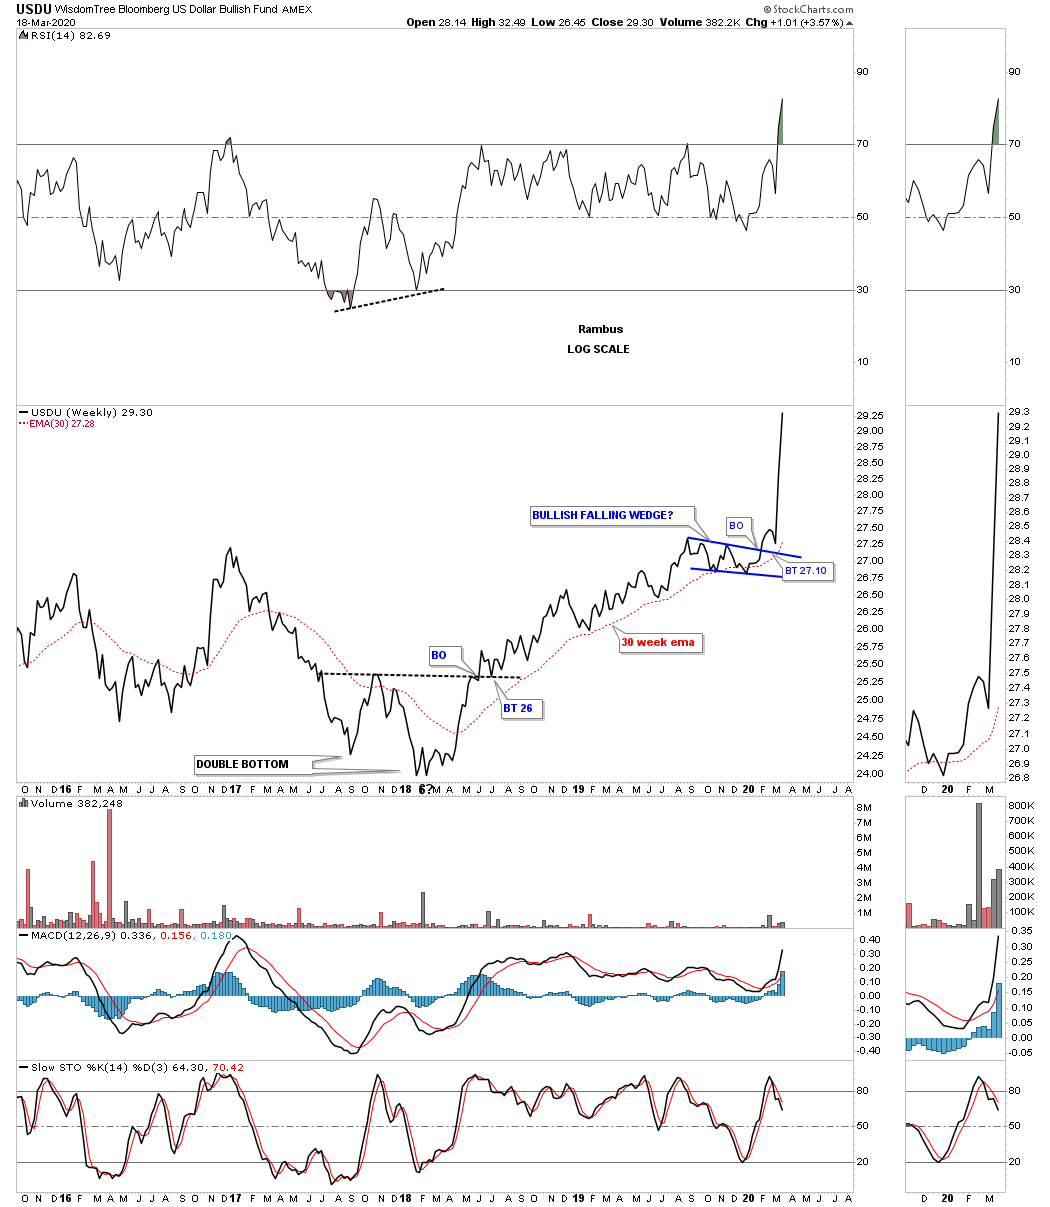
This next chart is a weekly look at the USDU which is a more equally weighted index for the US dollar. After the backtest the impulse move is well underway.
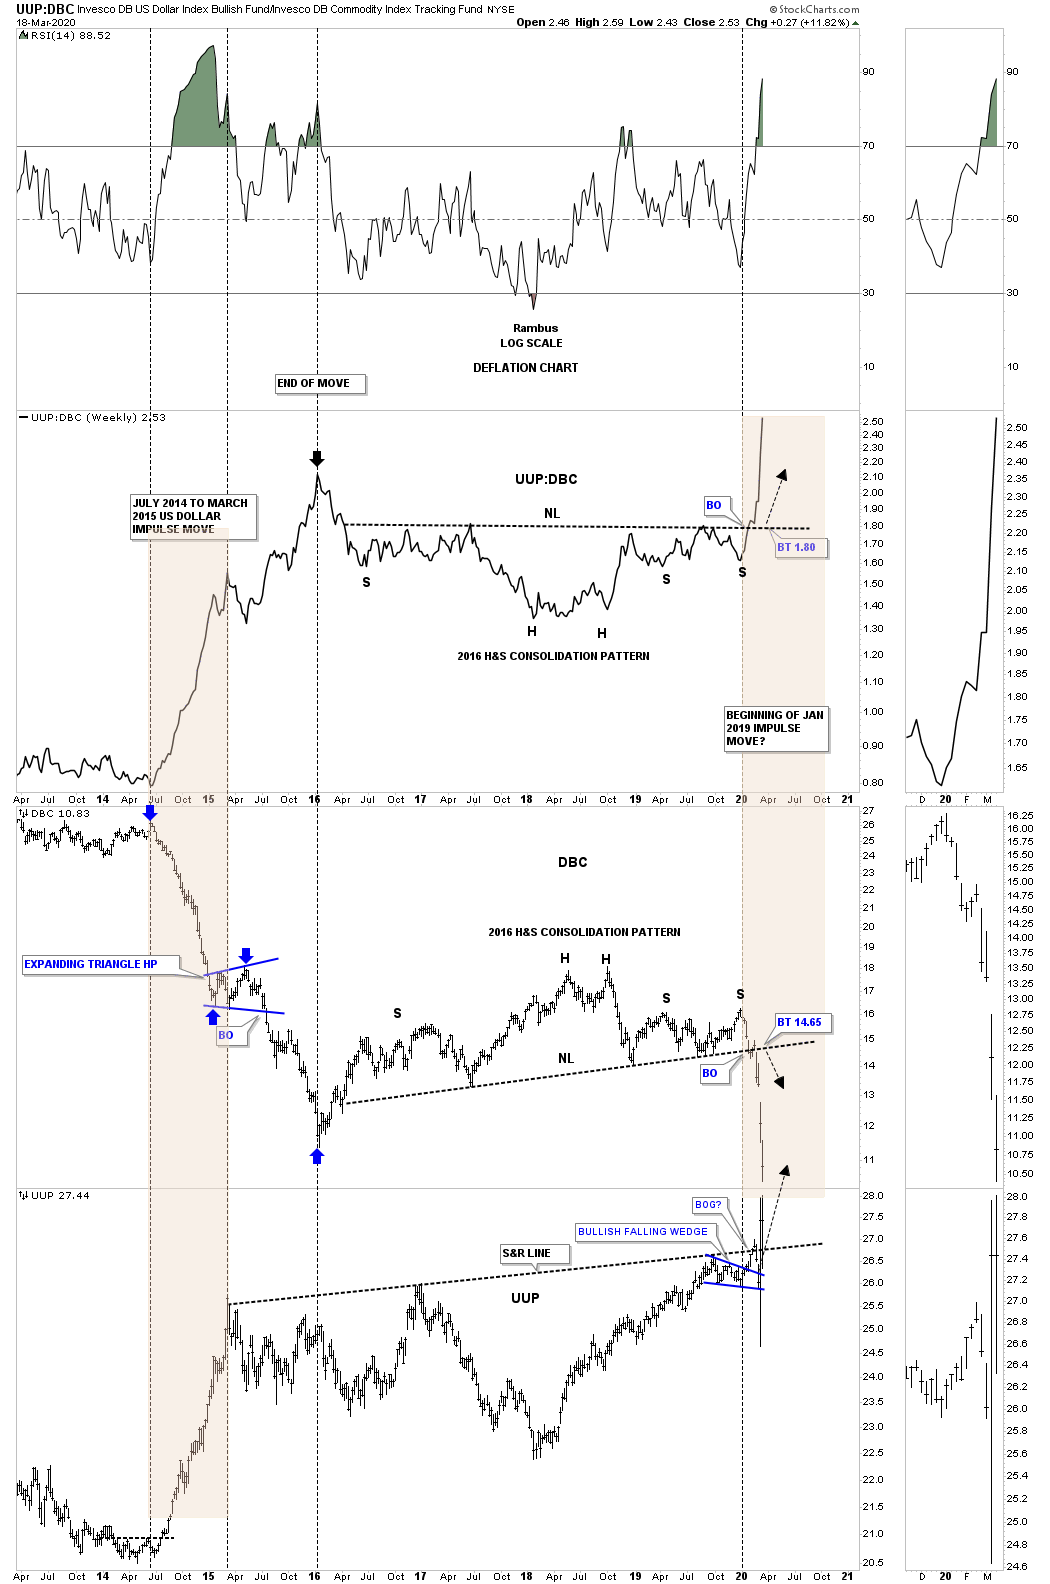
Below is a combo chart which has the ratio UUP:DBC on top with the DBC in the middle and the UUP on the bottom. The last time we looked at this chart the ratio chart on top still hadn’t broken out above the neckline. What this chart shows us is how our current setup, brown shaded area on the right side of the chart, compares to the setup on the left side of the chart which shows the last deflationary event. This ratio combo chart suggest there is still a lot of time left  before this these charts run their course.
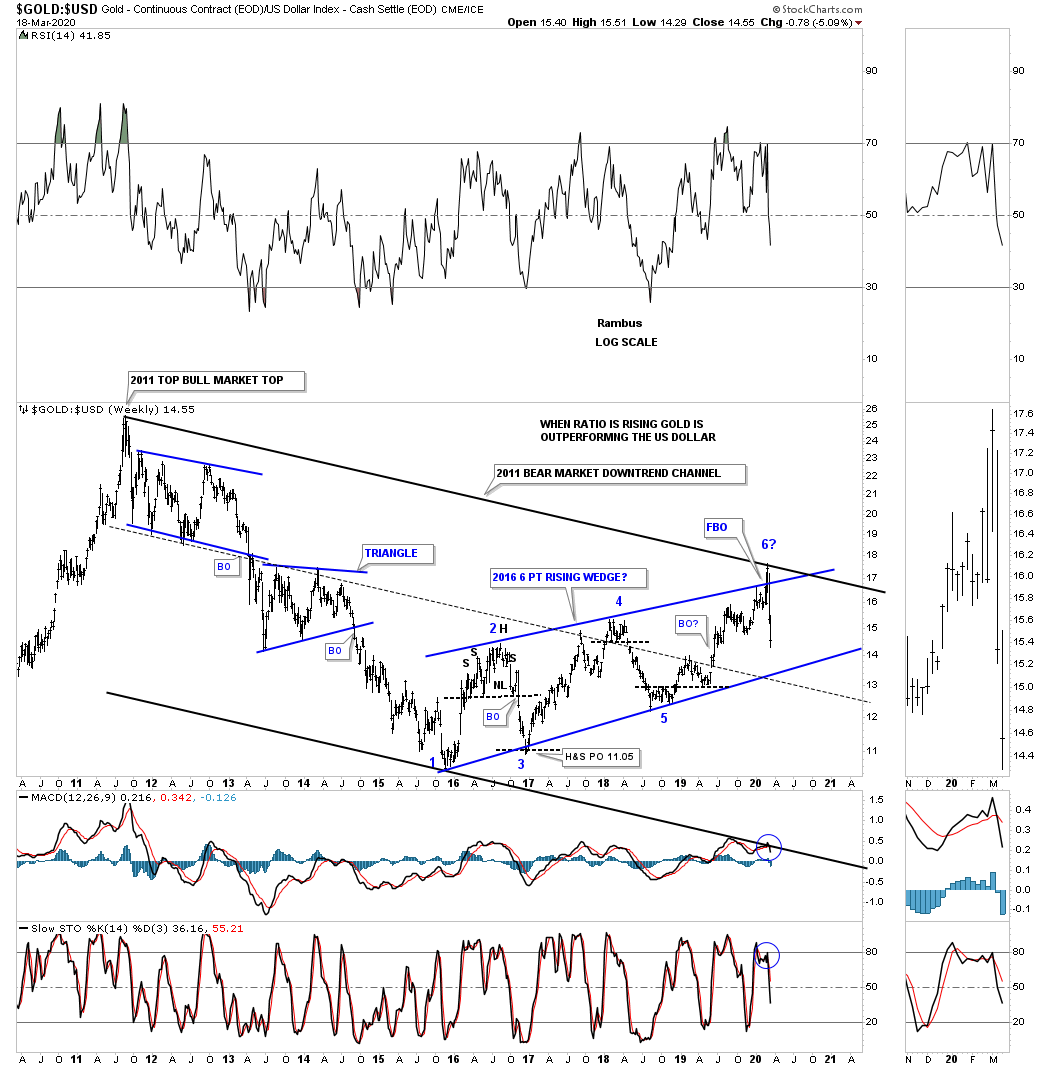
This next chart shows how gold to the US dollar did during the 2000 bull market in the precious metals complex. Just like gold itself this ratio produced some of the best chart patterns of any sector I’ve ever charted. Believe it or not this bear market has been in play for close to 9 years now with no signs of letting up just yet, especially if the 2016 rising wedge ends up being a halfway pattern to the downside.
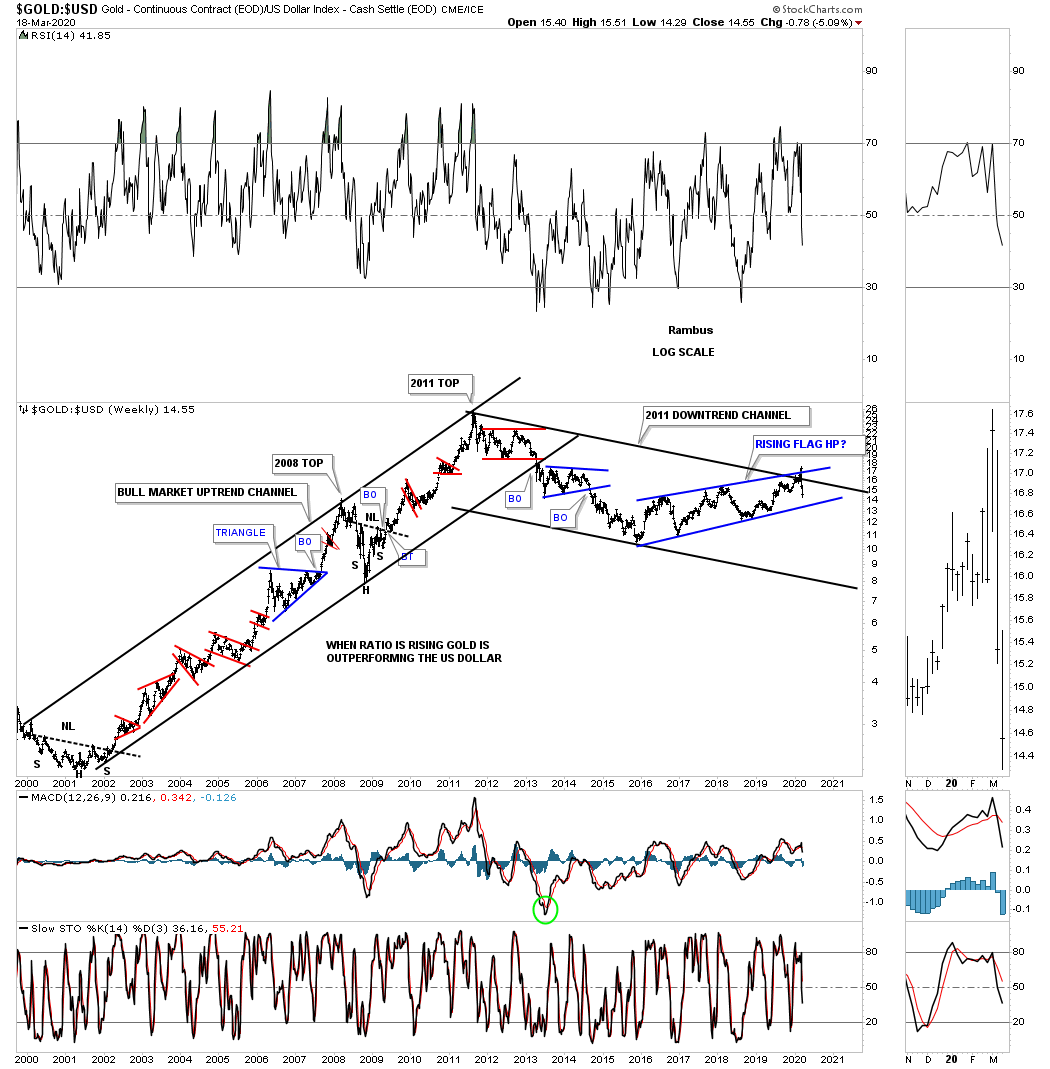
This last chart for tonight compares gold to the US dollar. When the ratio is rising gold is outperforming the US dollar. Since the bottom in 2016 gold has been outperforming the US dollar up until 3 weeks ago. There was a false breakout above the blue trendline that was negated when the ratio traded back inside of the 2016 rising wedge.

For those that like fundamentals to study maybe you can put your skills to the test and figure out why the US dollar has formed a massive 14 year H&S base compared to most of the important currencies of the world. This massive base is going to be in play for years to come. All the best…Rambus
 

Weekend Report…The Chartology of a Deflationary Event

The great debate on whether we’re going to see inflation or deflation has been answered in spades. For years some of the greatest minds of our time have discussed this issue in great detail with each side giving probable reasons as to why we’ll see either inflation or deflation. Both sides can make great points to their arguments but in the end only one side will win the battle that has been raging on for years. While the fundamentalist argue their points I’m going to show you from a Chartology perspective the true story of what is taking place in this great debate.

In this Weekend Report we’ll look at some short, intermediate and long term charts for the US dollar and some commodities indexes to paint a picture of what millions of investors, from around the world are actually doing with their money. These investors leave their mark on a chart that show up as short term battles to longer term wars that can last for years. These battles and wars create chart patterns that define the winner and looser of each encounter.

To understand the deflation scenario we are in lets start with a few charts for the US dollar. This first chart is the 25 year monthly fractal chart we’ve been following since 2014 which shows the 2 fractals, big base #1 and big base #2. Our last deflationary event took place when the US dollar broke out from big base #2 in September of 2014. That impulse move began the 2011 uptrend channel that has been in place ever since. The blue rising channel is the same rising channel we were following on the daily combo chart that had the UUP on top with the HUI on the bottom. As you can see there was a small false breakout below the bottom rail of the blue rising channel that was negated when the US dollar traded back inside of the rising channel. Note where the US dollar was when gold bottomed in 2000 then note where the US dollar was when gold topped out in 2011. This shows us that over short periods of time these two can run together but over the longer term there is a distinct inverse correlation. Until the US dollar breaks below the bottom rail of its 2011 uptrend channel we have to assume the US dollar’s bull market remains in tact.

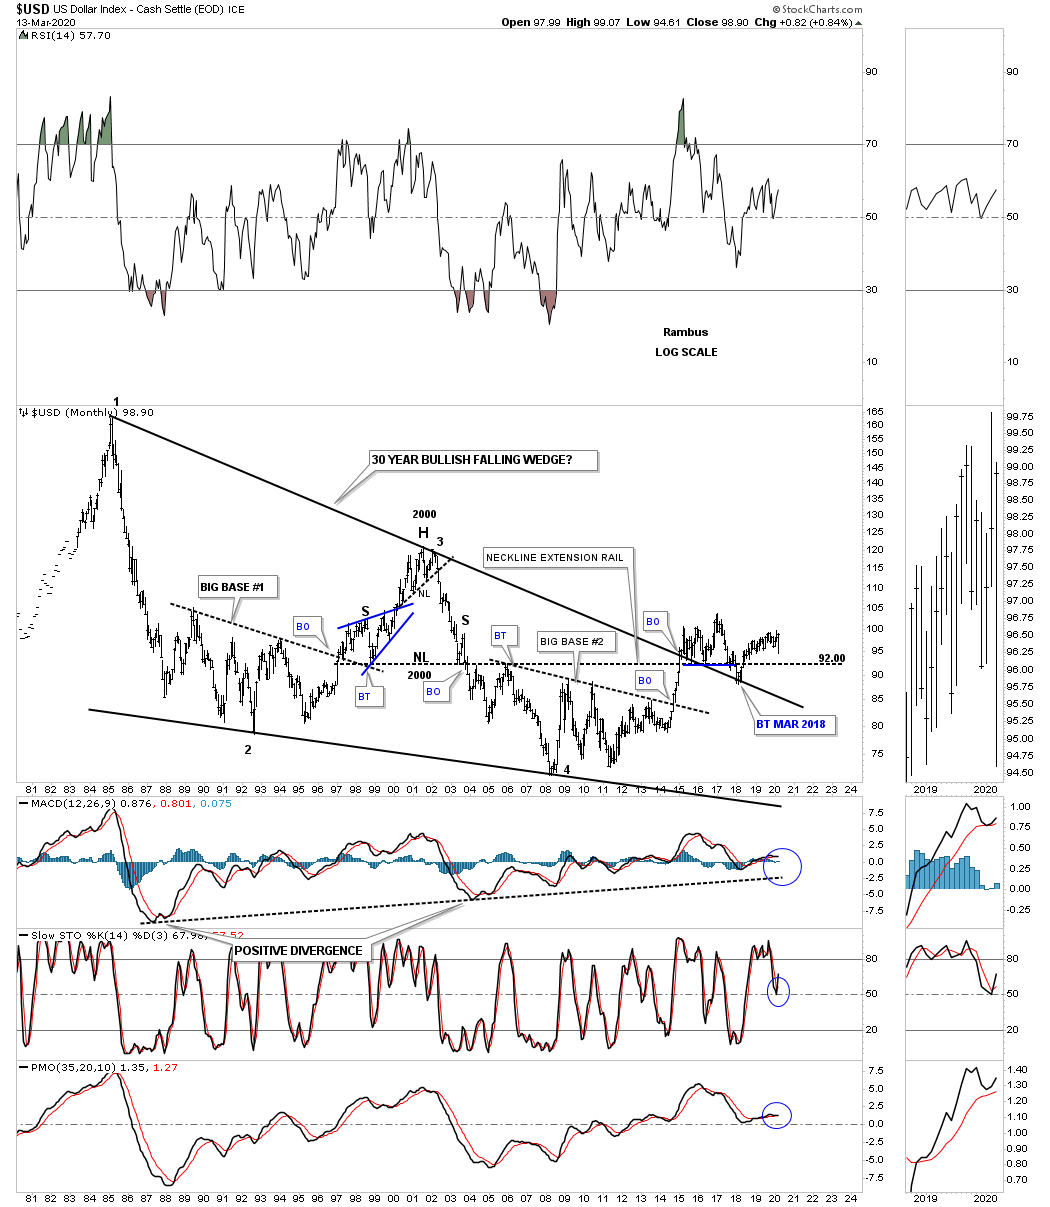
There was another long term chart I built for the US dollar back in 2014 which was the 30 year bullish falling wedge which got a lot of snickers when I first posted it. Keep in mind I posted this chart before the breakout of the top rail. After the breakout above the top rail the question then became will it hold support on a backtest from above? As you can see it has held on 3 separate occasions so far with the last backtest in February of 2018.There was another layer of support at the Mar 2018 backtest area which was the 2000 H&S top neckline as shown by the neckline extension line.

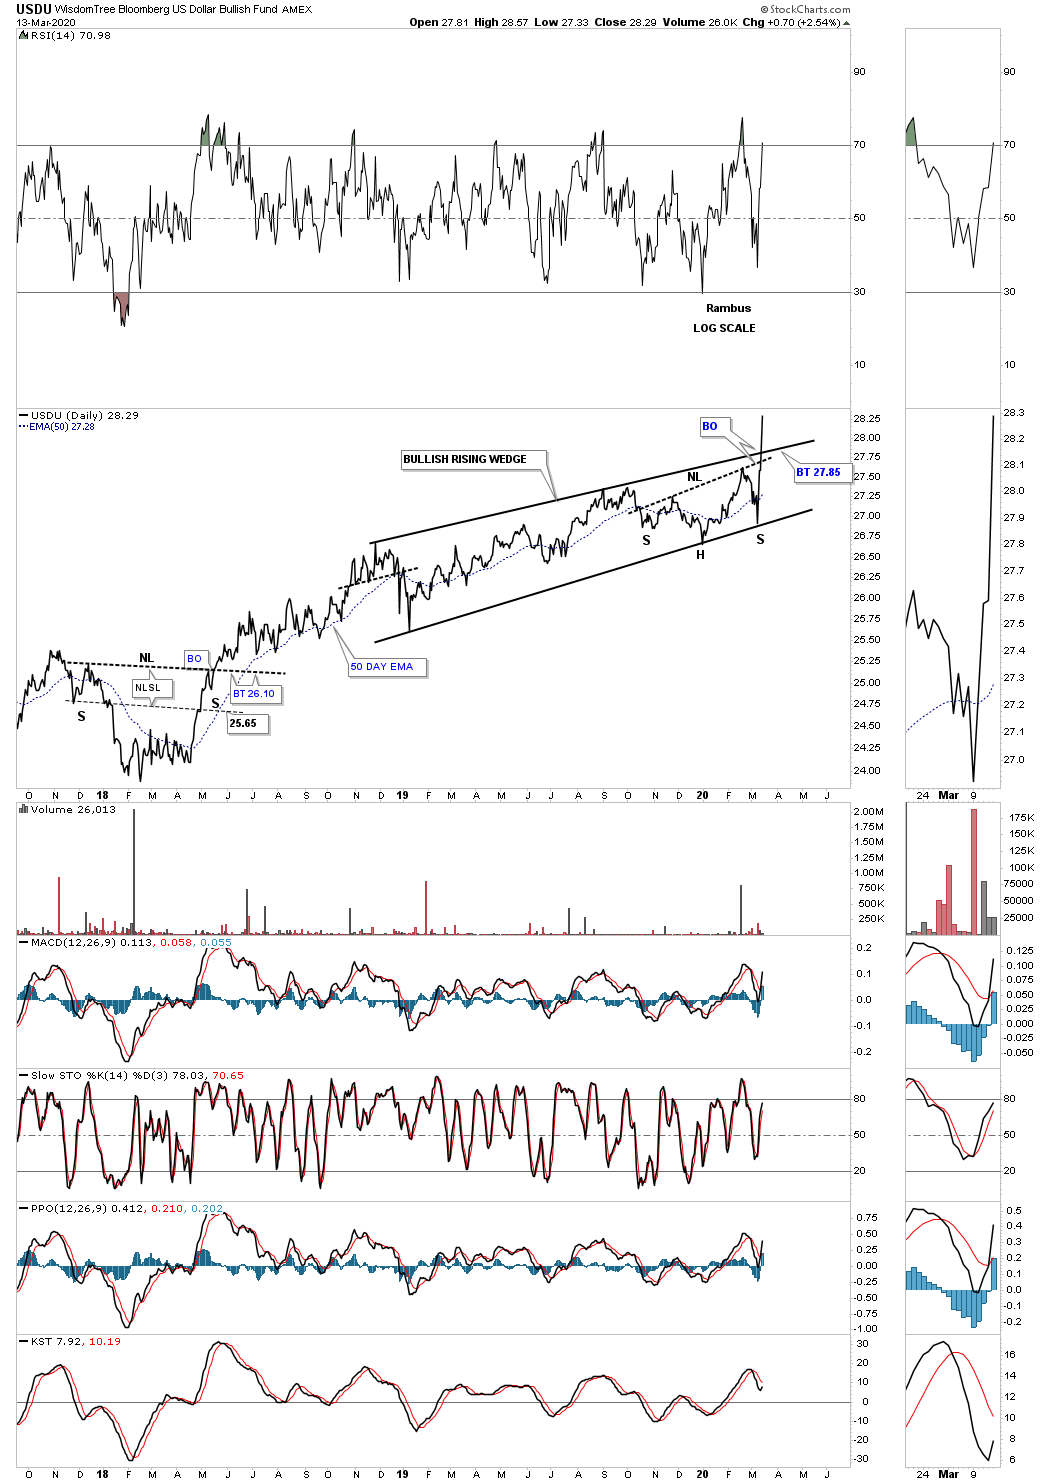
There is another US dollar index I follow which is a little more equally weighted that is the USDU. Last week it broke out from a bullish rising wedge that began to form in late 2018.

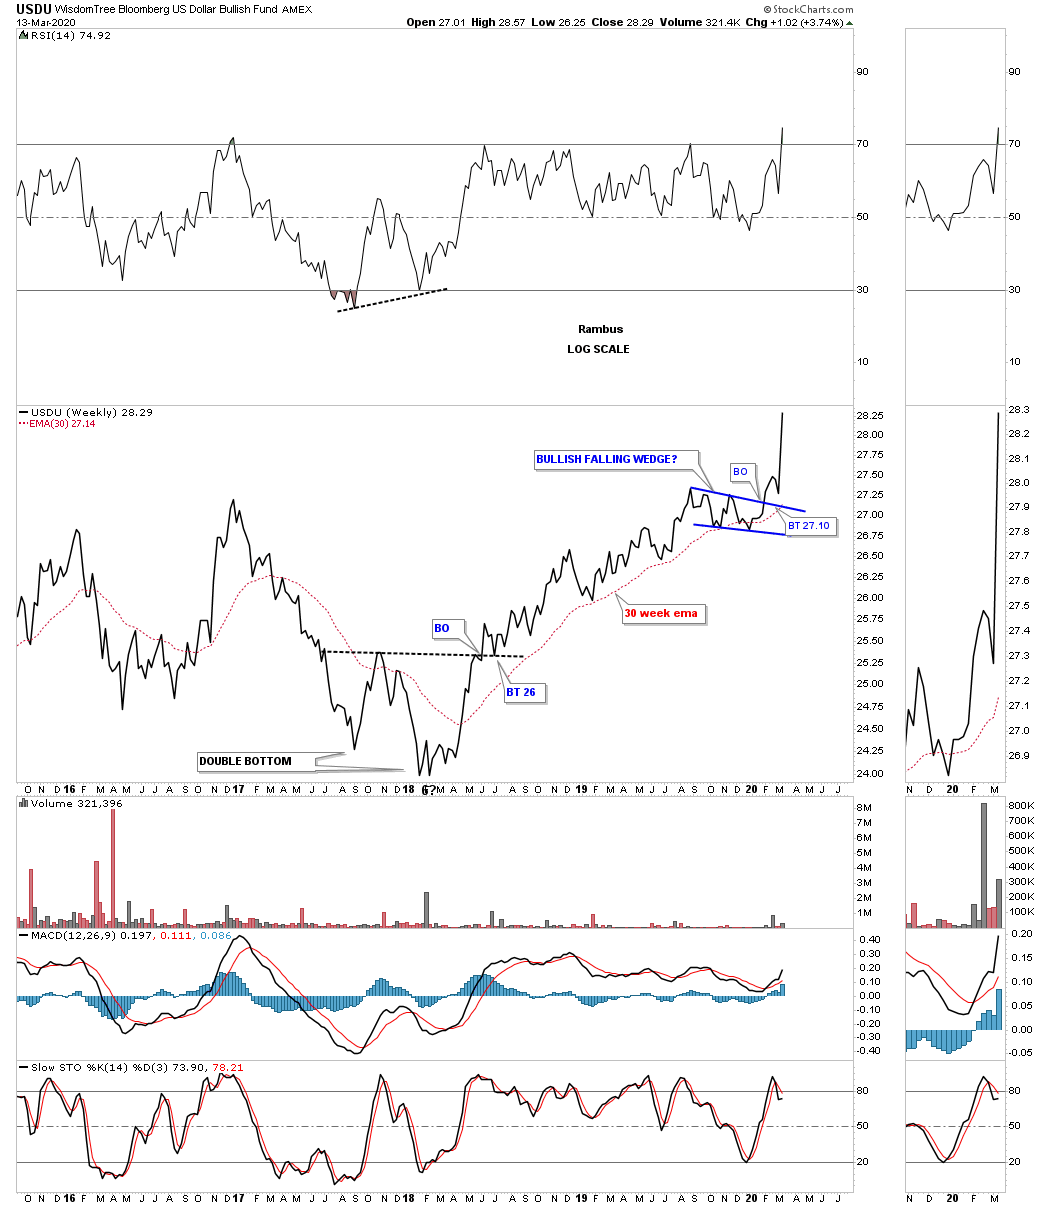
Below is a 4 1/2 year weekly chart for the USDU which shows a pretty strong uptrend since late 2018 after putting in a double bottom.

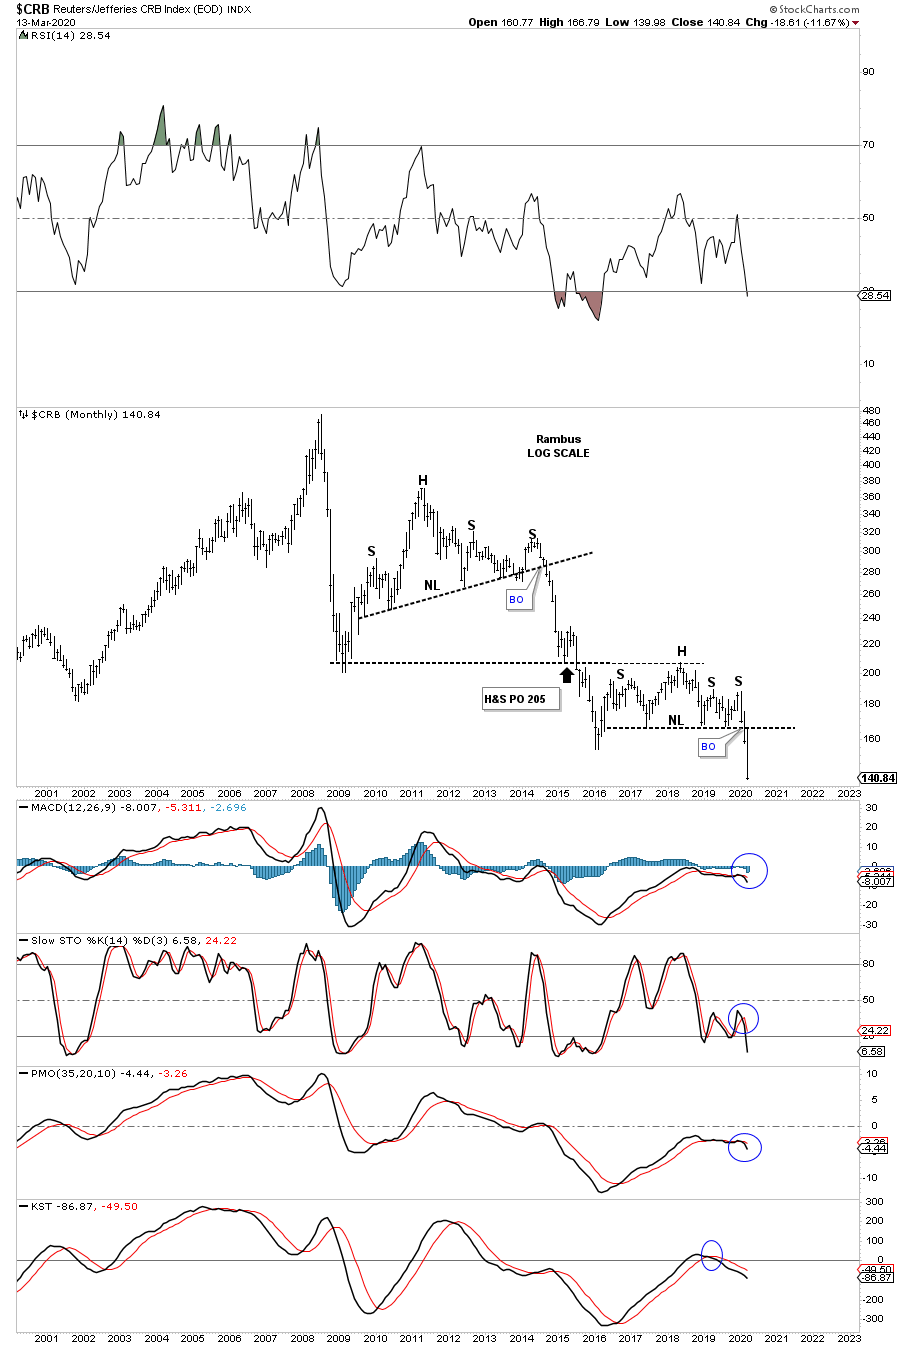
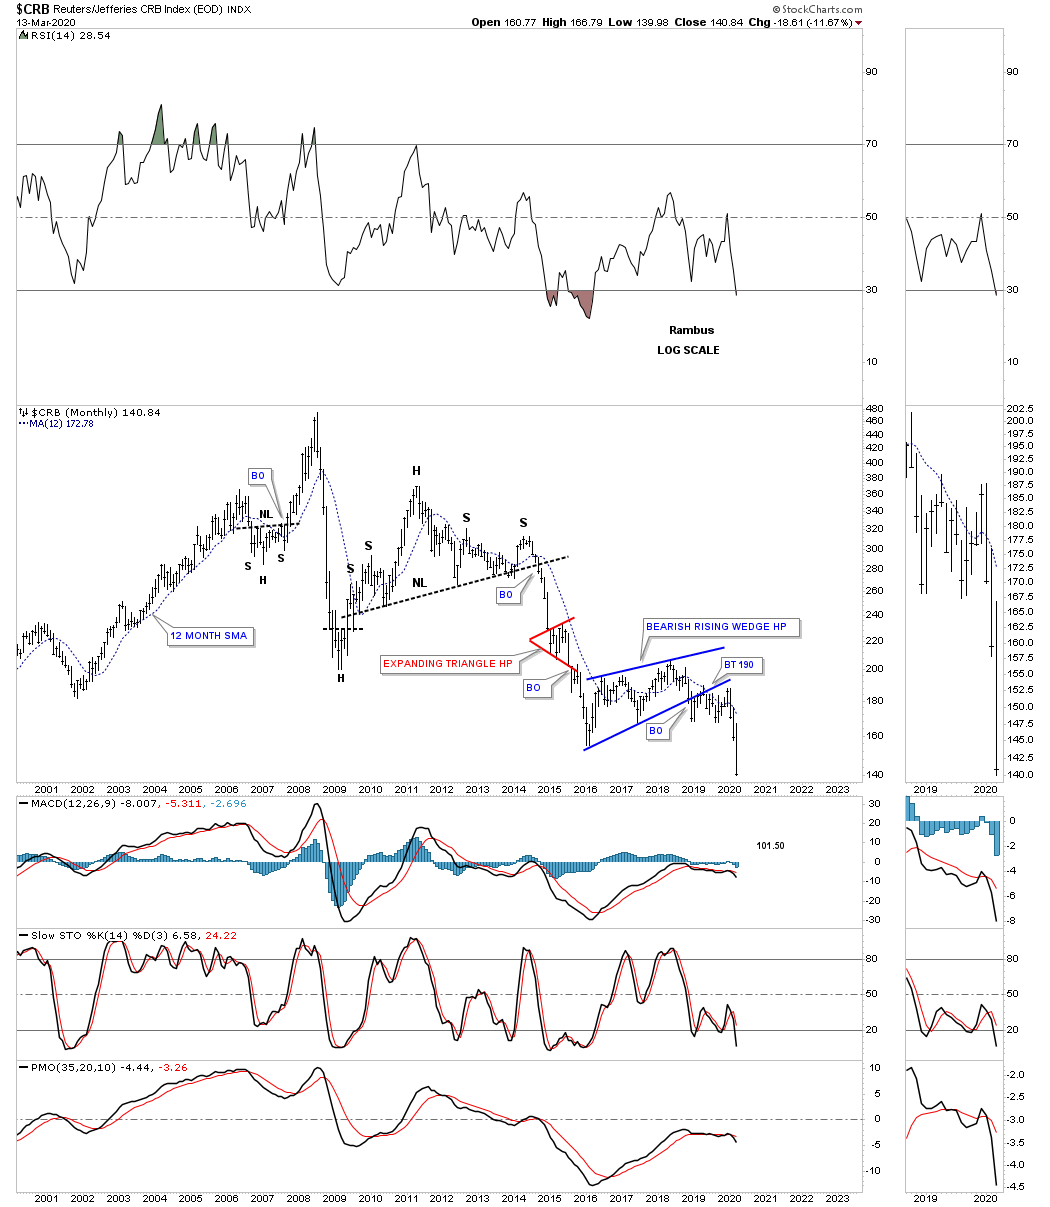
With the US dollar showing strength since 2011 lets look at some commodity indexes to see what shape they are in starting with this monthly chart for the CRB index. First note the right shoulder high in 2014. That is the point where the last deflationary event started which ended in early 2016. For the last 4 years the price action has chopped out a large H&S consolidation pattern with the breakout below the neckline last month.

There is also another important chart pattern that has formed since the 2016 low which is a bearish rising wedge.

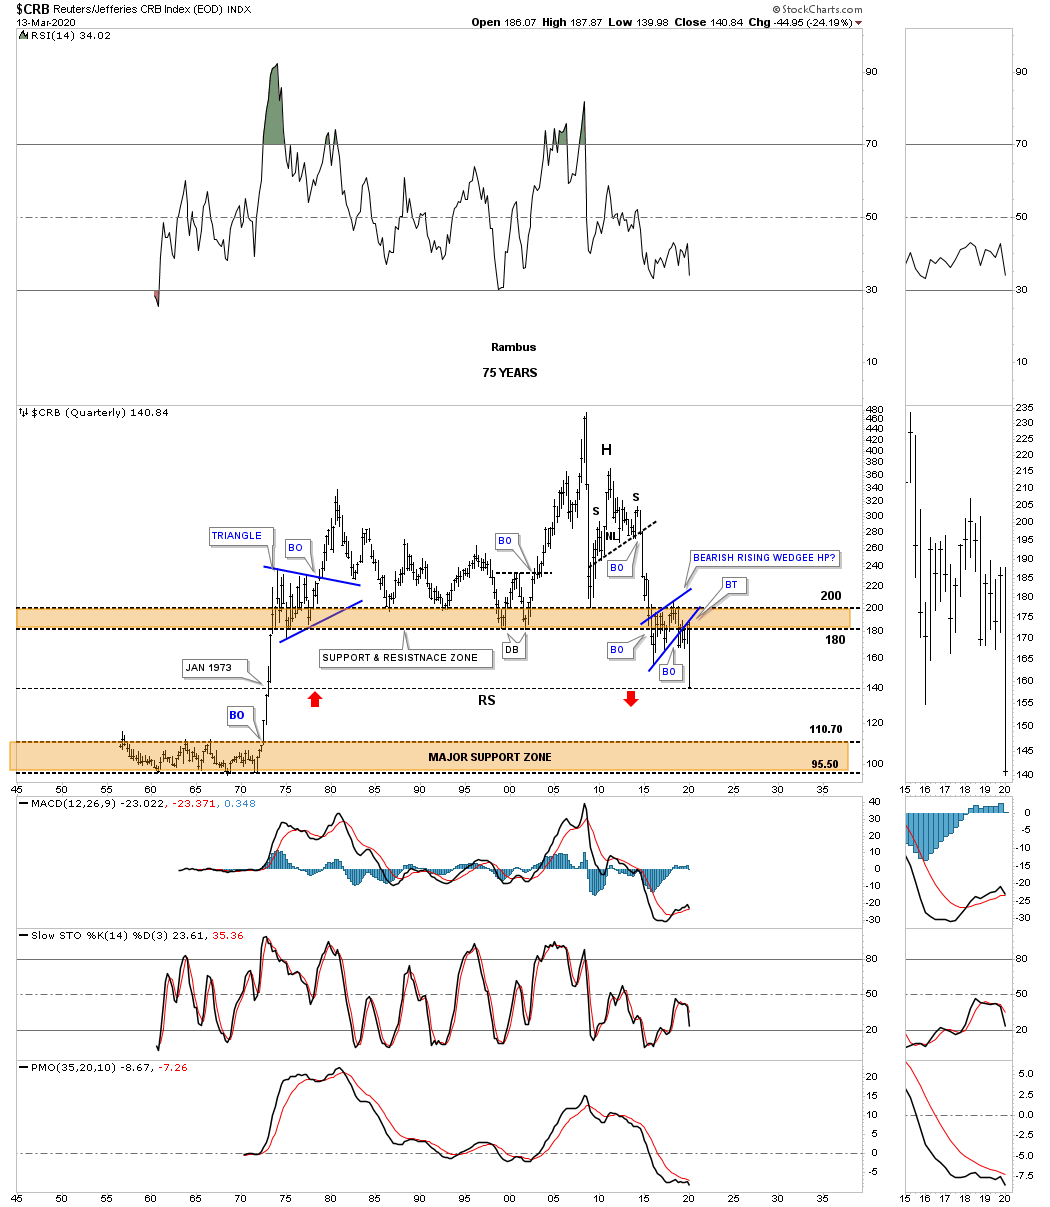
Below is another chart I built in 2014. When you put all the chart patterns together we come out with one ugly looking chart. Here again the right shoulder high in 2014 began the last deflationary phase. I was looking for the brown shaded S&R zone to hold support which it did after a strong overshoot. From that final low in mid 2015 came the backtesting process back up to the brown shaded S&R zone. It took nearly 3 years for the backtesting process to finish up and when it did we were left with the 2016 bearish rising wedge which I labeled as a halfway pattern to the downside. What I found very interesting when I first built this chart was the vertical price action that took place in the early 1970’s which is why I added the red arrows which shows how I was looking for reverse symmetry over that same area on the way down. The thin dashed back horizontal line shows the CRB index is now trading at a low not seen since January of 1973 which is pretty incredible when you think about it.

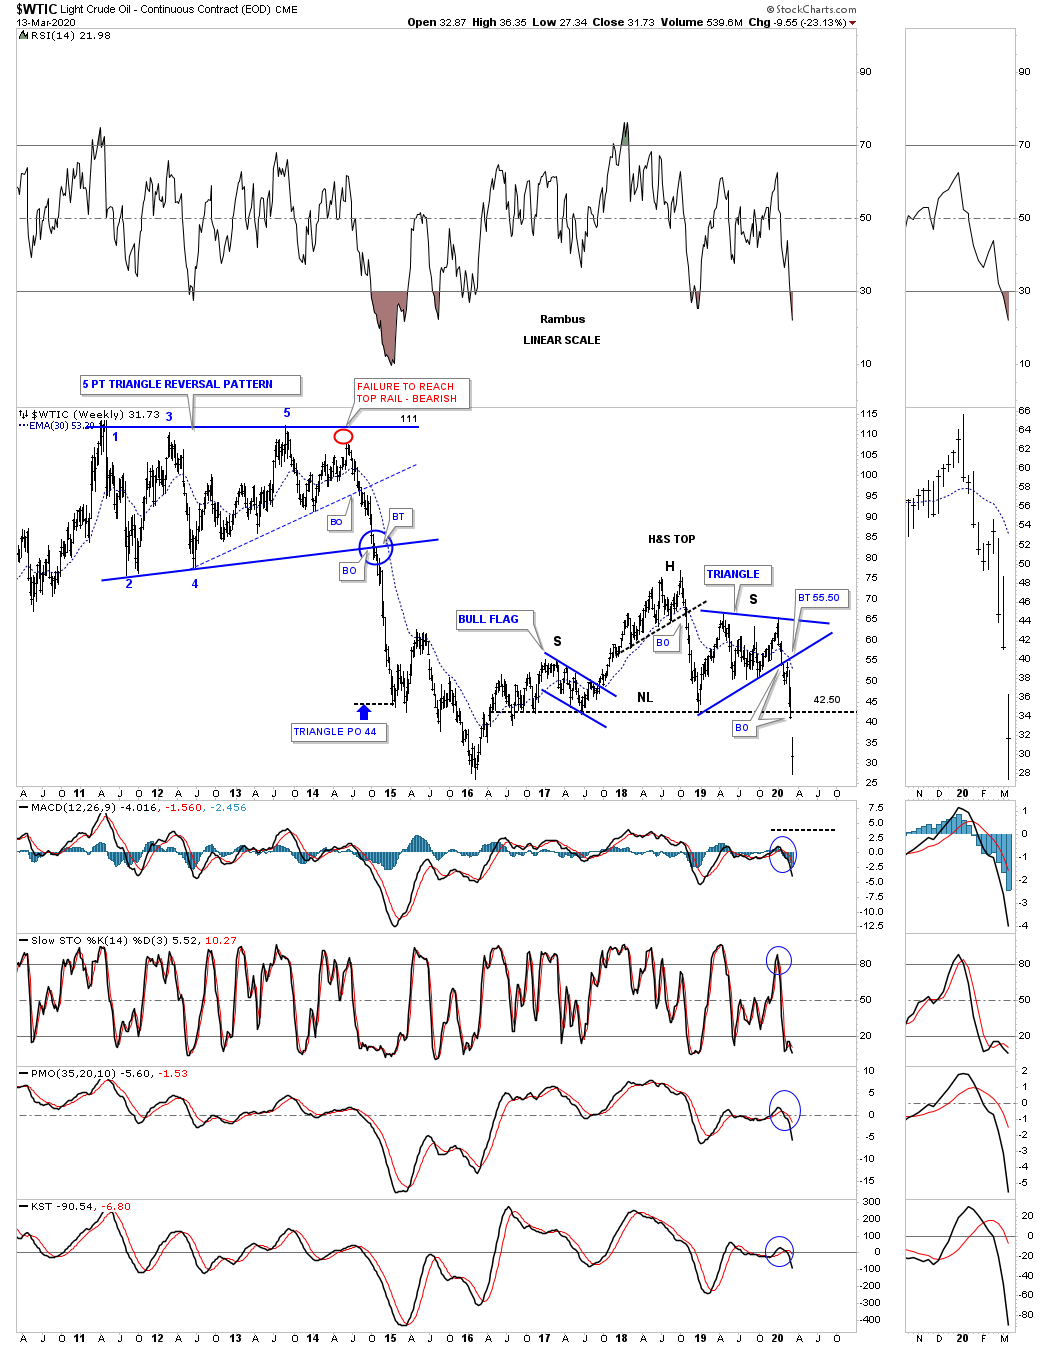
The most important commodity on the planet is oil which can tell us a lot about the economy. In a strong growing world economy there is a big demand for oil which causes the price to go up. On the other hand when the world economy is weak that strongly suggests a weak oil pice. Below is one of the charts for the WTIC we used back in the last deflationary event that began at the red circle at the top of the 5 point triangle reversal pattern. The red circle just shows weakness as the price action failed to reach the top rail which can be a precursor to the completion of a pattern. The thin blue dashed upslopping trendline was the first area we were waiting to give way. Then came the bottom rail of the 5 point triangle which had a perfect breakout and backtest as shown by the blue circle. The triangle price objective was achieved in January of 2015 at 44. It took almost another year before the final low was reached in February of 2016.

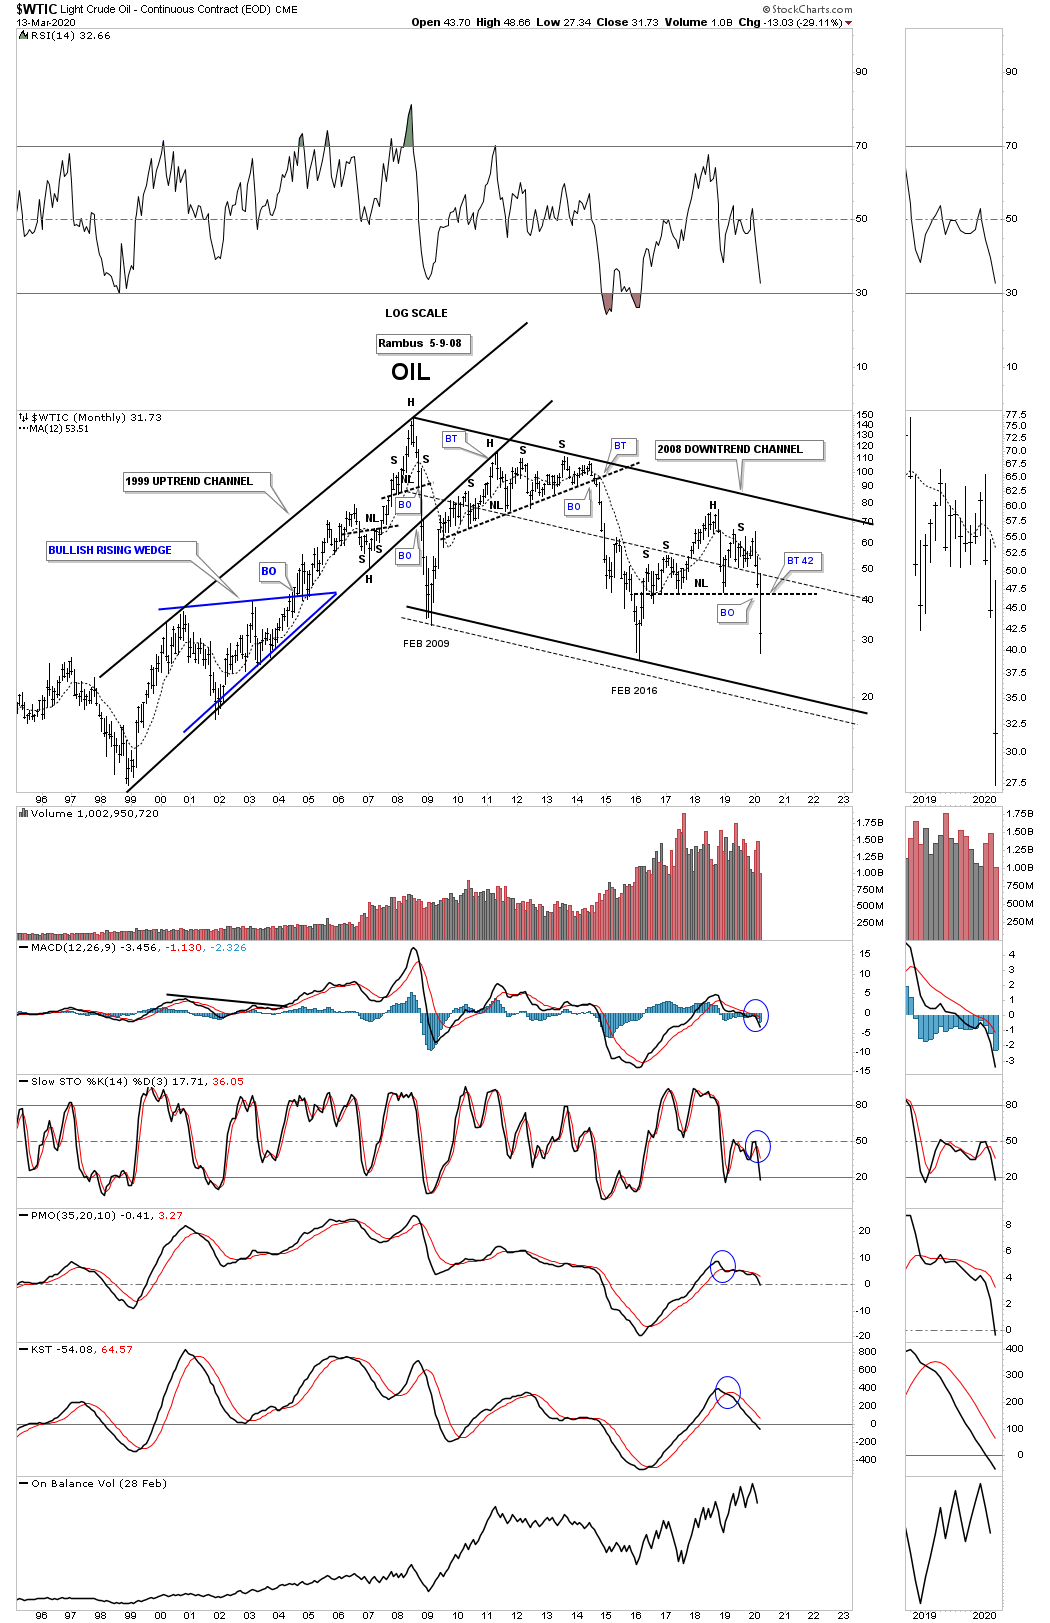
Many times when a stock is building out a multi year chart pattern it can be made up of several smaller individual patterns. You can see this on the H&S pattern on the weekly chart above which has a bull flag left shoulder and the blue triangle right shoulder. Below is a 25 year monthly chart for WTIC which shows the 1999 uptrend channel that ended with the small H&S top in 2008. That small H&S top in 2008 was made during the same time as the stock markets and PM stock indexes which led to the infamous 2008 crash which was, by looking at this chart, was the birth of the deflationary environment we currently find ourselves in.

After the 2008 crash ended in February of 2009 came the countertrend rally which ended up backtesting the bottom rail of the 1992 uptrend channel on multiple occasions, but could never break through above it. Then WiTC began to build out a very long drawn out trading range which eded up being a 5 year H&S top. That H&S top was one of those very large patterns that you spot early on and then have to wait for it to finally complete, testing your patience to the end, but the wait was finally worth it.

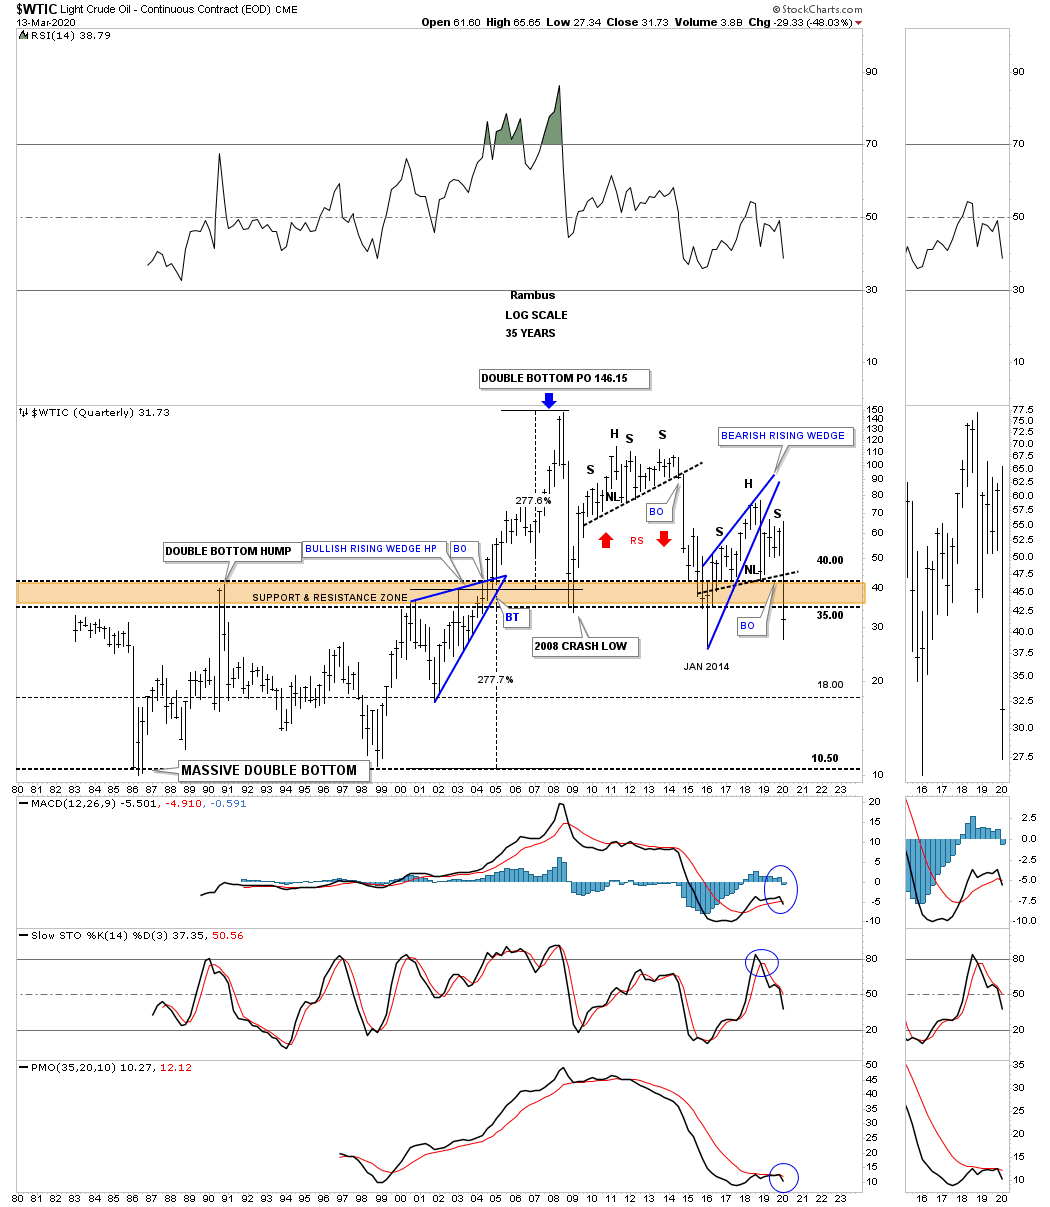
This last chart for WTIC is a 35 year quarterly chart which shows some classic Chartology. From the early 1980s WTIC formed a massive double bottom which finally completed in July of 2004 which launched oil on its parabolic run to its all time high at 147 in July of 2008. Note the width of that massive double bottom which was 277%. When you add 277% to the double bottom breakout point above the double bottom hump trendline you get a price objective up to 246. As you can see the 2008 high came just in time for the 2008 crash during that deflationary decline. You can see how the 5 year H&S top we just looked at on the chart above fits into the big picture. The red arrows show you a good example of reverse symmetry, how oil went up is how it came back down over the same area.

Just like the CRB index we looked at earlier I was looking for support to come into play at the brown shaded S&R zone and just like the CRB index the price action punched through a bit before reversing back up. Like most commodities at that time oil bottomed in January of 2014 and began to build the blue bearish rising wedge which ended up being part of the classic H&S top. During the formation of a classic H&S top the left shoulder and head form inside of the rising wedge with the right shoulder high forming around the bottom rail on the backtest. Is it possible that WTIC is going to reach its all time lows going all the way back to the 1986 low before this deflationary cycle is finished?

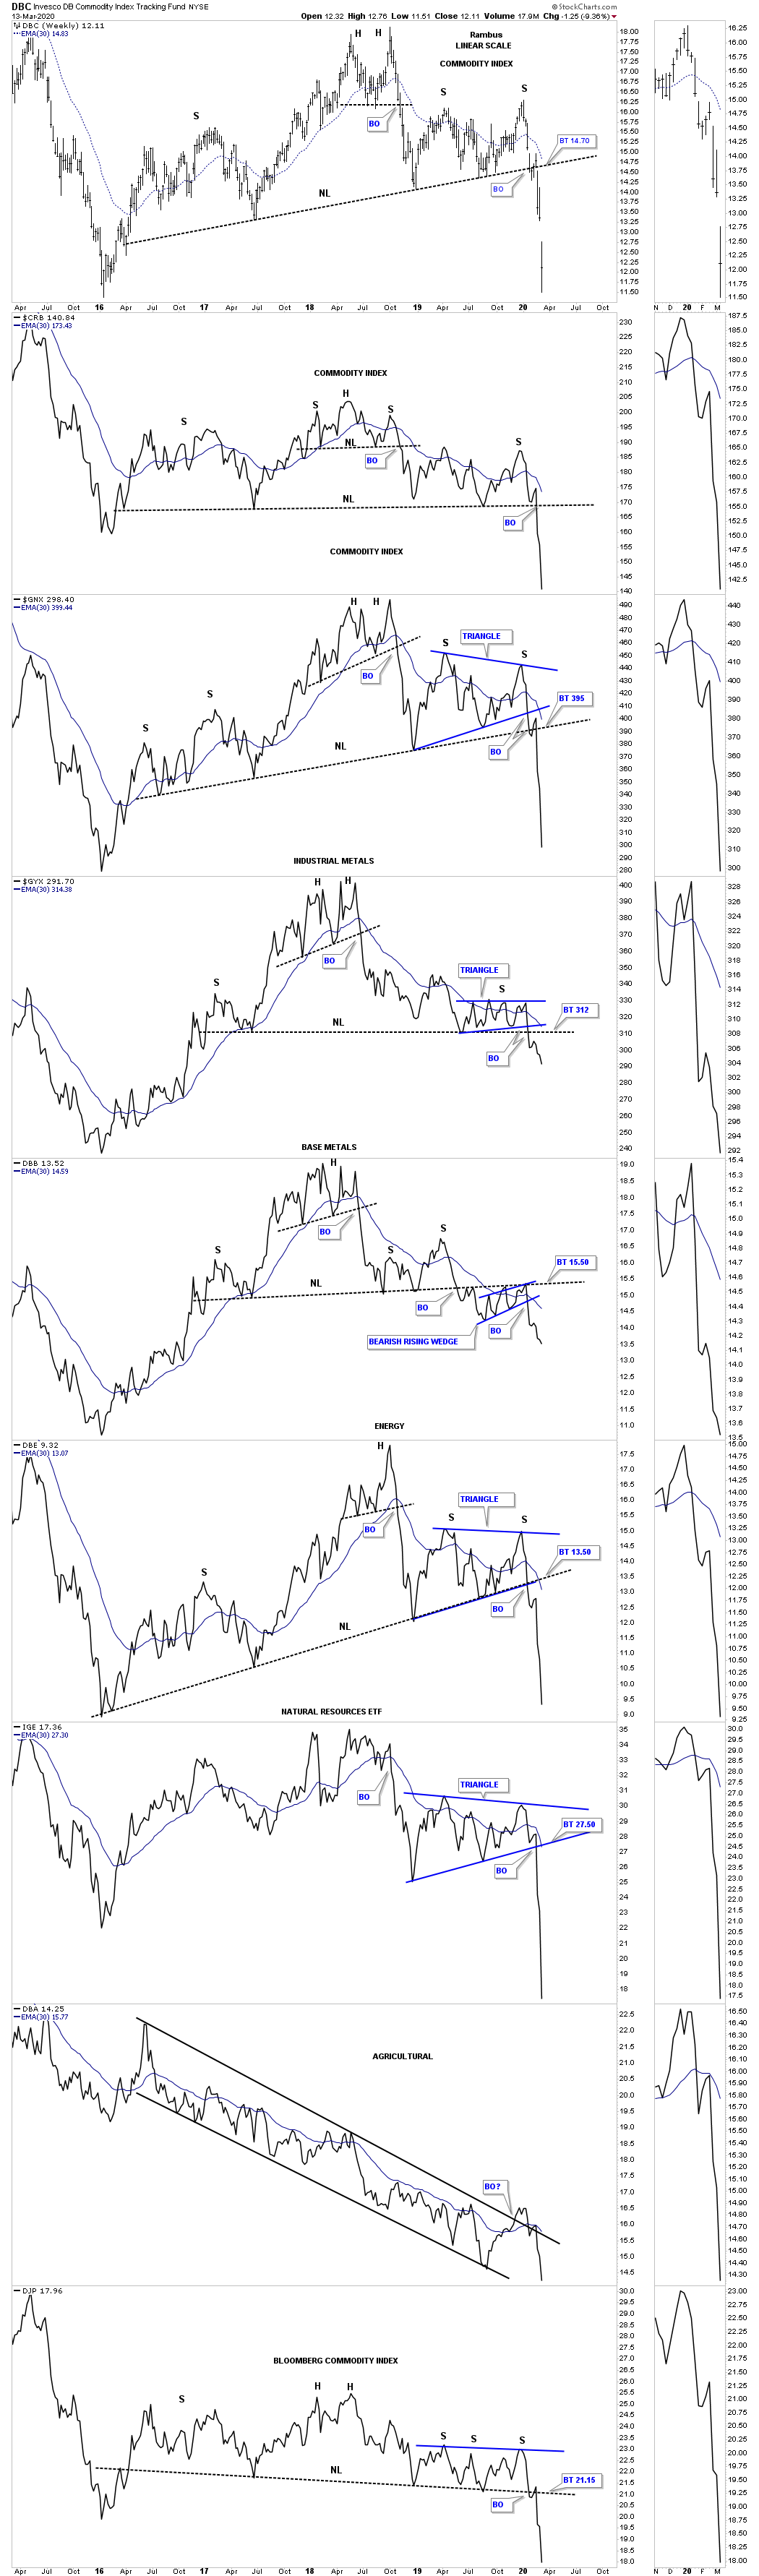
Below is the weekly combo chart for many different commodities indexes we’ve been following. I’ll let this chart speak for itself.

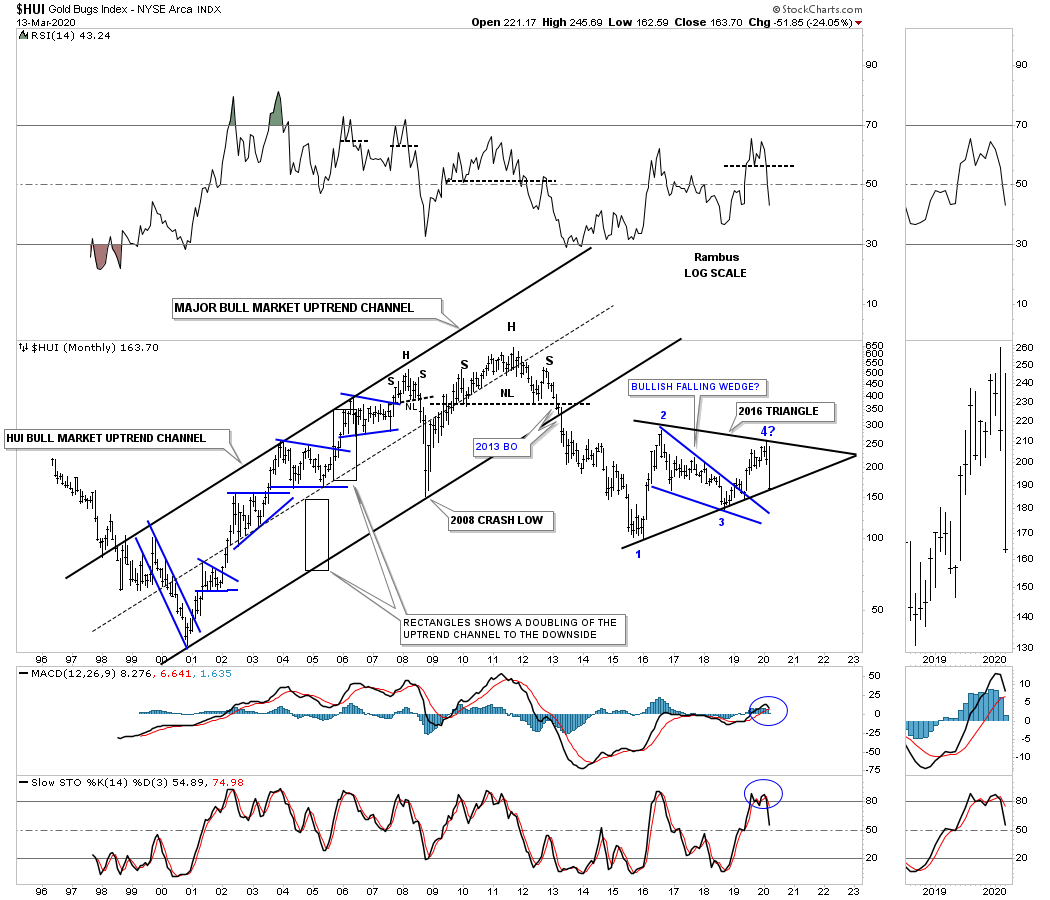
There is one last chart that I needed to get posted tonight which is a long term monthly chart for the HUI. All I can say is watch the bottom rail of the 2016 black triangle. Last week the HUI completed 4 reversal points which makes the black triangle a consolidation pattern to the downside. This is where the bulls have to step up to the plate in no uncertain terms and rally the HUI off that bottom rail to avoid a breakout. Please everyone stay safe and watch out for your family and friends. All the best…Rambus