This content is for Yearly and Monthly members only.
Subscribe
Subscribe
Already a member? Log in here

In part 2 of this Weekend Report we’ll take an indepth look at gold and especially the long term view. Again, this is just for entertainment purposes only until gold can close below a very important trendline. I’ve been following this potential scenario since shortly after the US elections. Up until the elections this pattern I’m about to show you didn’t show its self, but now it’s one of the most important chart patterns for gold that I’ve posted in several years. As we discussed in part 1 , please read forward with an open mind regardless of what other information you re processing and what your current expectations are. This is an exercise in my preferred method of Technical Analysis , Chartology.
Again, this is an exercise in a “Potential” big picture scenario which has a strong basis in Chartology . It is not a prognostication at this time , but is an important scenario to keep in mind. At the moment there is a rally in the Gold sector and we are short term bullish .
There are three daily charts we’ll look at first, which are reversal patterns that formed at a very critical spot on the long term charts.
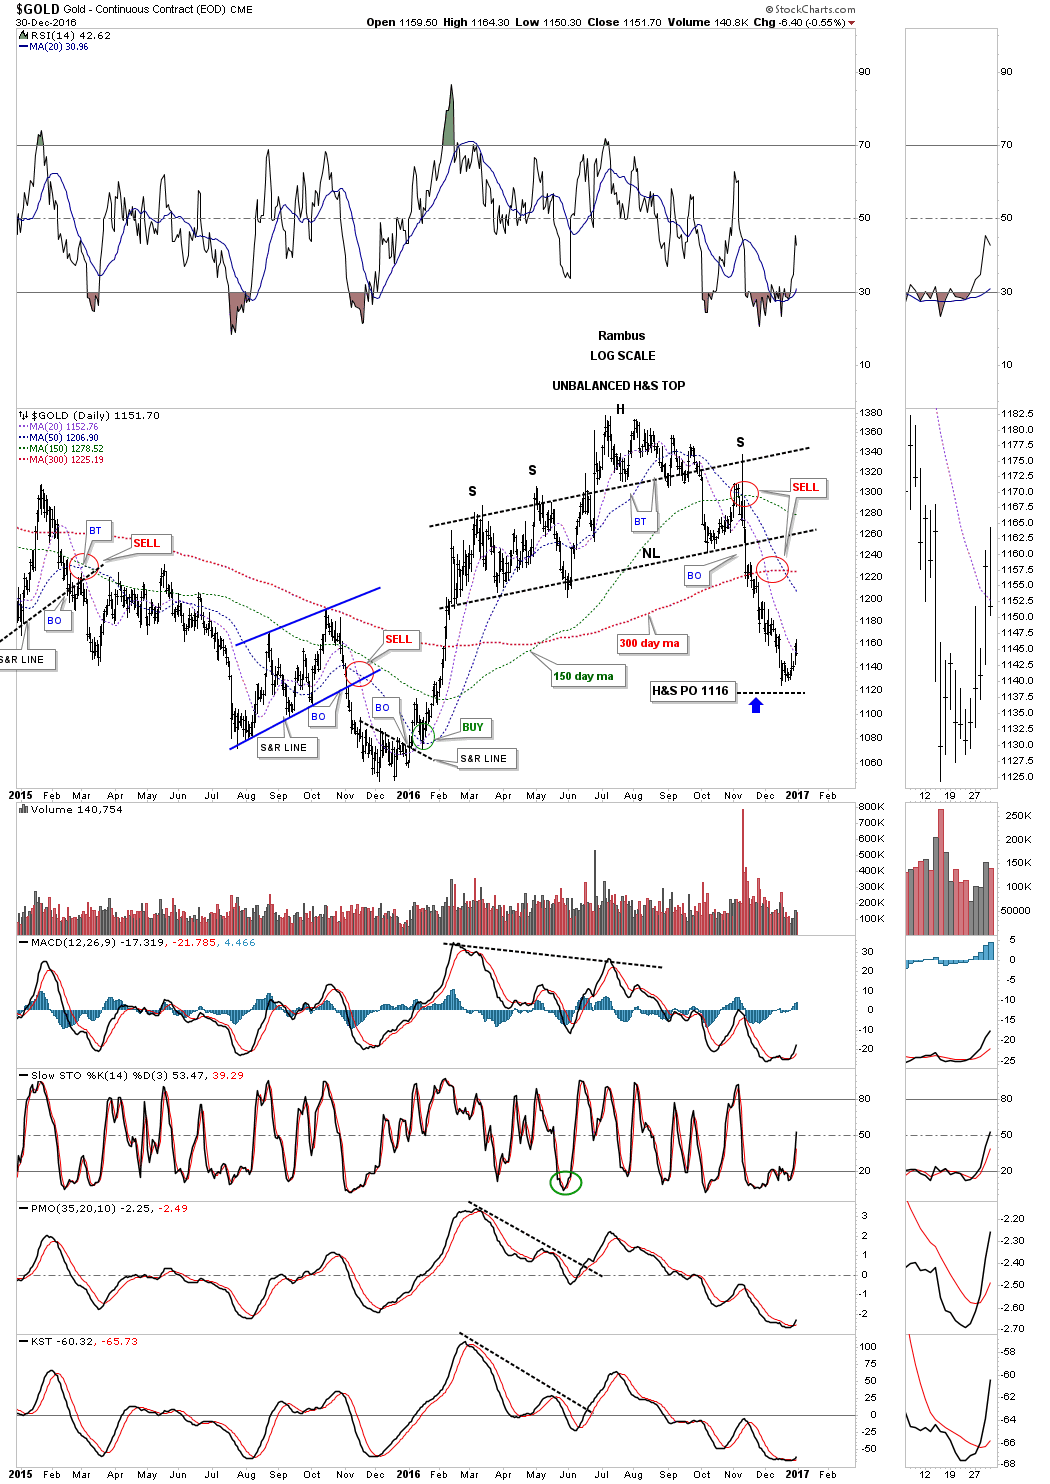
I’m going to start with a few daily charts and then work our way back in time to see the big picture. This first chart for gold shows the H&S top which we’ve been following on the PM combo chart that I post several times a week. This H&S top is an unbalanced H&S top with two left shoulders and one right shoulder. Note how the moving averages are crossing to the downside with the 20 and 50 day moving average now having crossed below the all important 300 day moving average. In the not so distance future, if gold keeps dropping, the 150 day will cross below the 300 day ma which will be a long term sell signal.
This second daily chart shows the seven point diamond reversal pattern we looked at shortly after the price action broke below the bottom rail. The seventh reversal point formed on the night of the US elections which put the diamond back into the reversal pattern category as it has an odd number of reversal points. It looks like gold is trying to rally as the decline out of the diamond reversal pattern has been pretty severe. It will be interesting to see how high a bounce may go and if gold starts building out some type of consolidation pattern.

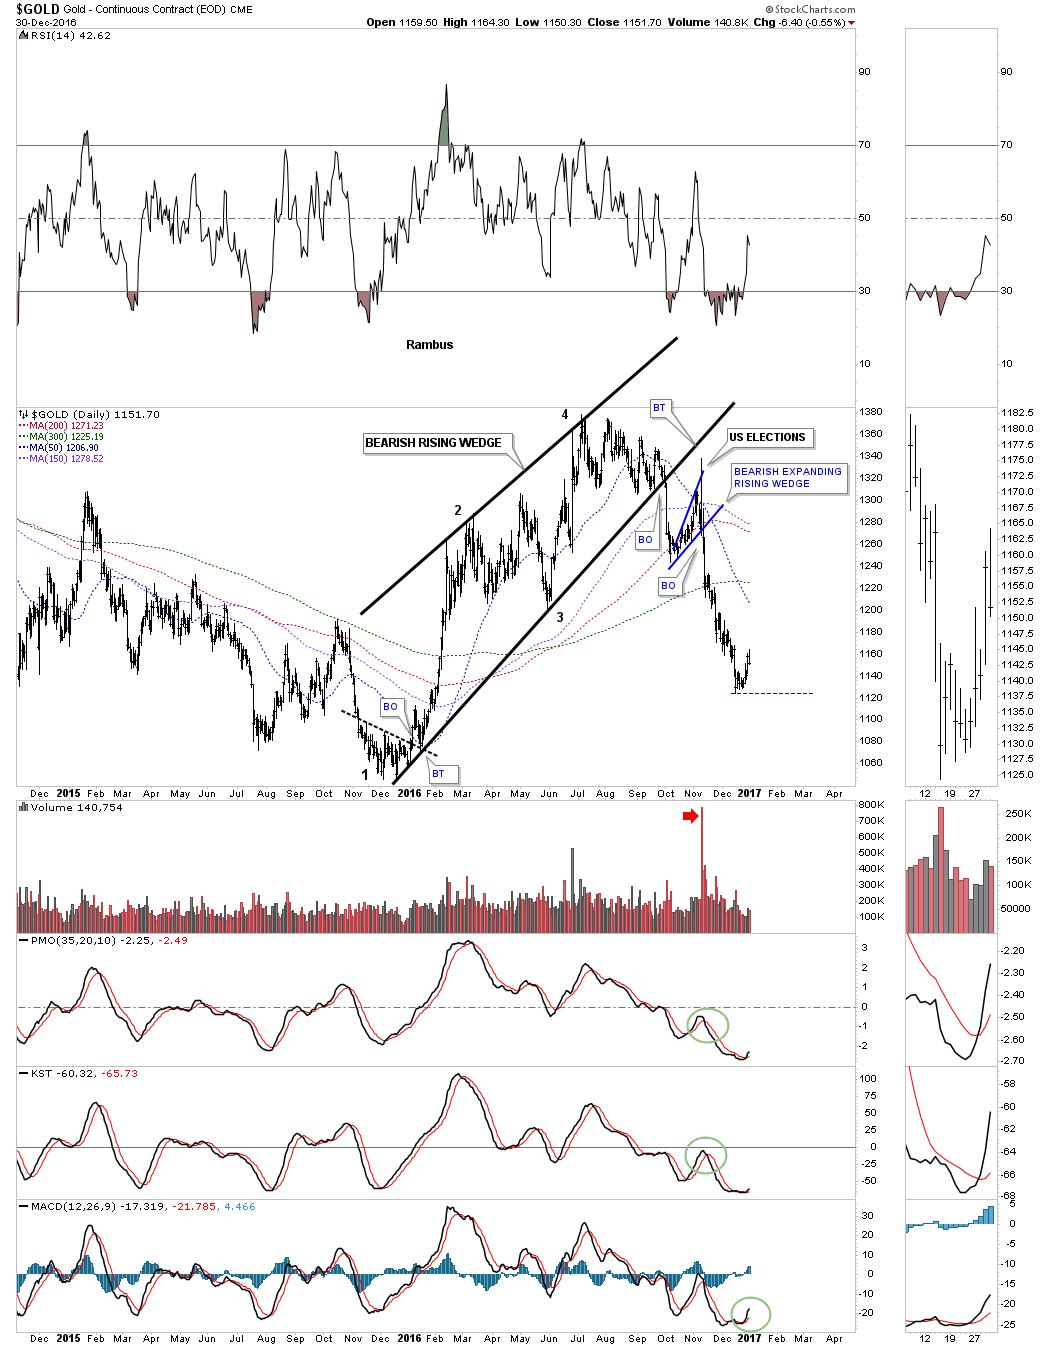
This next daily chart for gold is probably the most important chart for the big picture. This chart shows a bearish rising wedge which began to build out one year ago at the December low. Most folks think this was the beginning of a new bull market, but the bearish rising wedge has strong overtones of a bear market rally. The price objective of a rising or falling wedge is where the wedge begins to build out or the first reversal point. This would be a minimum price objective as prices can go much lower. The top half of the bearish rising wedge is the H&S and the diamond tops we looked at on the charts above. The important moving averages are looking very weak at this point in time.
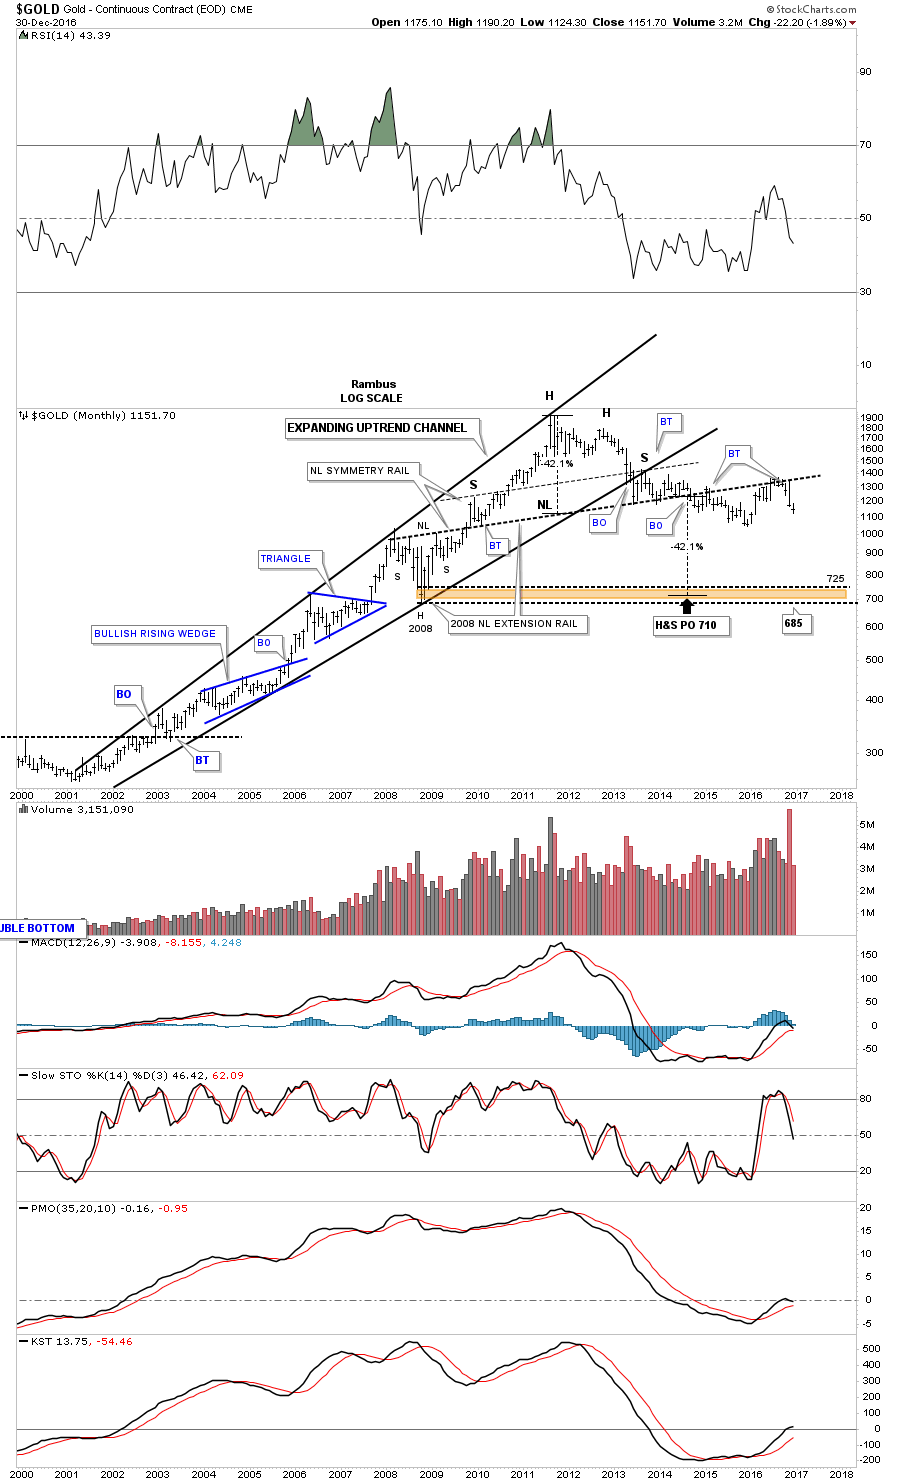
In part one of this Weekend Report we looked at the morphing process for two important H&S tops on the HUI. This next chart for gold is a long term monthly look which shows the original H&S top I showed you back in 2013 or so. The 2008 H&S consolidation pattern is what setup the neckline that stretches all the way to the left hand side of the chart, as shown by the neckline extension line.
Note the beautiful symmetry as shown by the neckline symmetry line which shows the high for the left and right shoulders. Back in 2014 the price action broke below the neckline and it looked like the H&S top was complete when the backtest took place. Gold dropped into last years December low and rallied backup to the neckline again in a second backtest which so far is holding resistance telling us the neckline is still hot.
As you can see the price objective for the H&S top is down to the 2008 crash low as shown by the brown shaded S&R zone. If gold takes out the December 2015 low it will be creating a lower low, which is not bull market action. So the 1040 area now becomes important support for the big picture.
This next weekly chart focuses in on the shorter term look which shows how gold may be morphing into its own double H&S top. Neckline #1 is shown by the weekly chart above. Neckline #2 is taken from the 2008 bullish expanding falling wedge bottom which is creating the left shoulder. The right shoulder is built from the bearish rising wedge we looked at on the daily chart earlier. Now you can see why the bearish rising wedge is playing such an important role in the big picture.
Note the beautiful symmetry just above neckline #1 which shows gold building out the bullish rising wedge on its way to the bull market high at 1920, and the blue six point triangle consolidation pattern that formed on top of neckline #2 just before gold broke down.
Since I became aware of the potential double H&S top, I always showed the bull market top as a small double top, with the six point rectangle formation building out just below the double top as a consolidation pattern. What I’ve been contemplating recently is how the 2011 top fits into the big picture as the head. A reversal pattern consists of an odd number of reversal points 3, 5, 7 or more. It’s apparent that the 2011 top is a reversal pattern. During gold’s last strong move up in its parabolic run to its all time high at 2011, the price action above the top rail of the six point rectangle consolidation pattern was most likely a throw over or a final capitulation move. We can label the bull market top as a seven point rectangle reversal pattern if we use the capitulation throw over as the seventh reversal point.
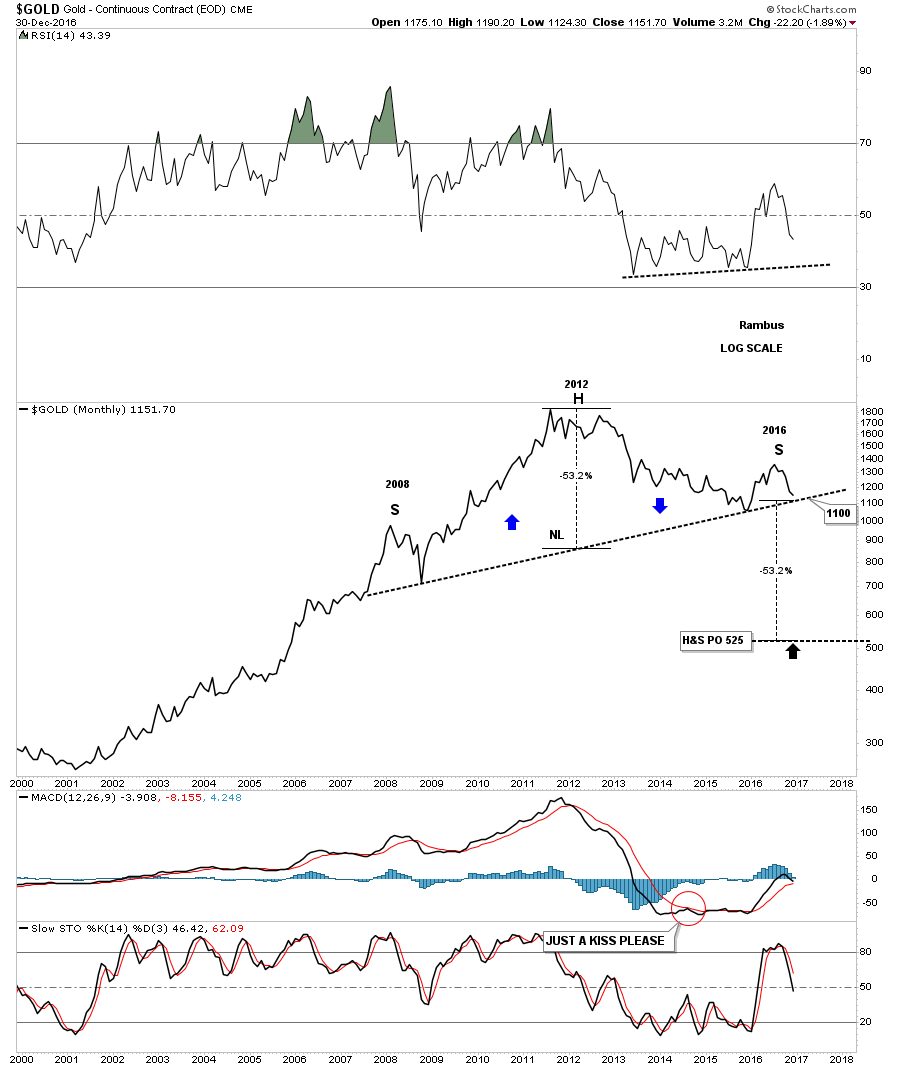
This chart also shows why neckline #2 is so critical to the very big picture. As you can see if big neckline #2 gives way, gold will have created a massive H&S top. It looks like 1100 is going to be the magic number that is going to tell us if gold is truly in a bear market that began at the 2011 high. As long as gold can trade above 1100 it will have a positive basis and the massive double H&S top will be negated. On the other hand if gold breaks below the 1100 area then the odds increase very dramatically that gold has been in a bear market since 2011 with a long way to go to the downside before the bear market exhausts itself.
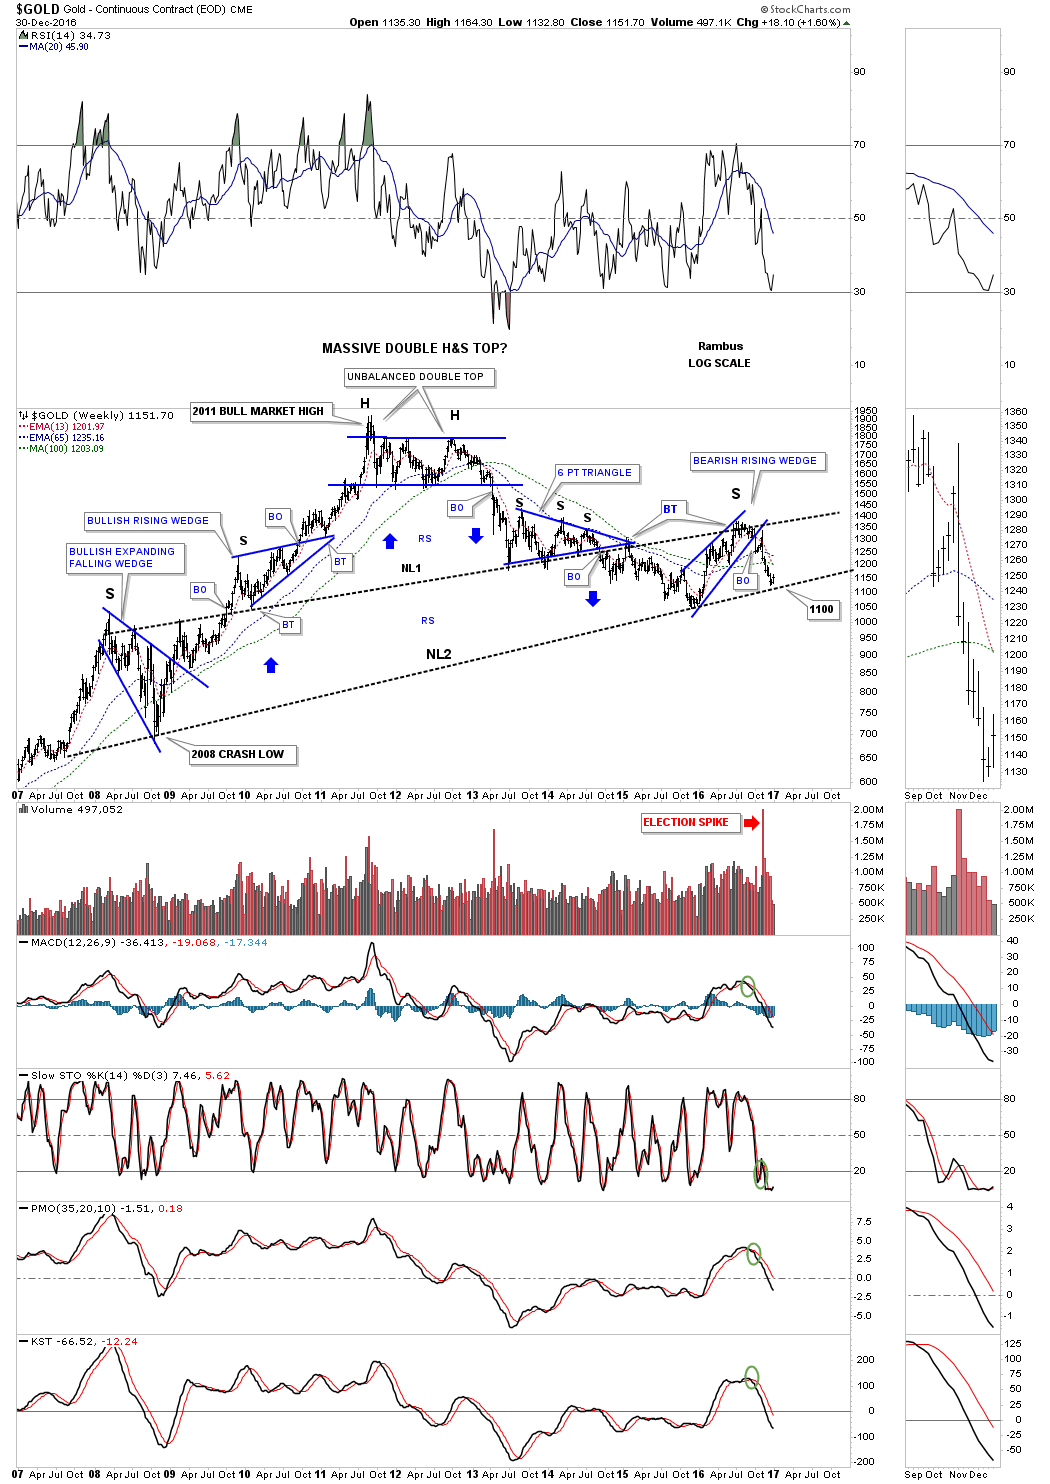
Now I would like to start showing you the very big picture which begins to bring all the pieces of the puzzle together. This first weekly bar chart for gold shows the potential massive double H&S top with the 1100 area being the most important price point for gold at neckline #2. If neckline #2 gives way the price objective will be down to the 500 area, which seems impossible at this time, but big patterns create big moves. Note the multi year base made back in the late 1990’s which launched gold’s bull market that took over five years to build out.
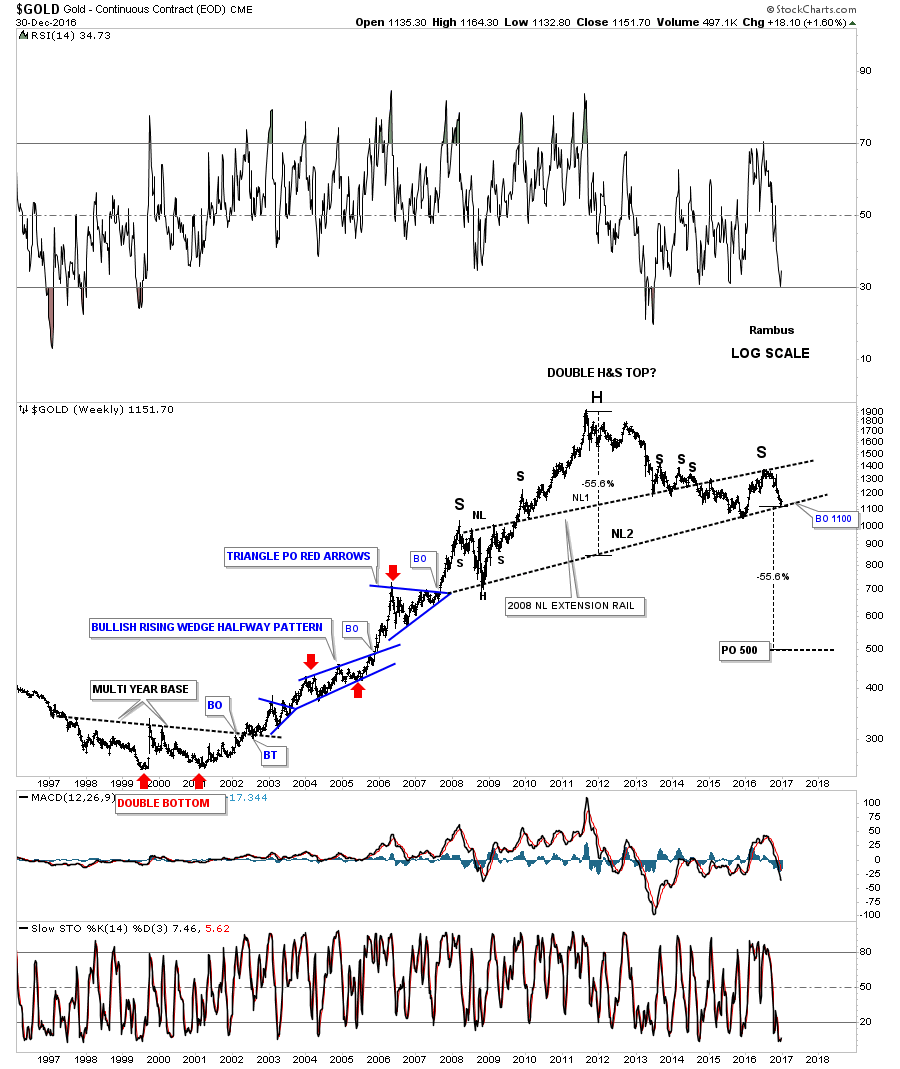
This next chart is a weekly line chart which shows the reverse symmetry patterns for the left and right shoulders. Note how the left shoulder formed a combo H&S consolidation pattern along with the bullish expanding falling wedge. Now look over to the right shoulder and you can see the H&S top with the blue bearish rising wedge. The blue arrows show how gold has been reversing symmetry back down vs how it went up. It’s not a perfect correlation but close enough.
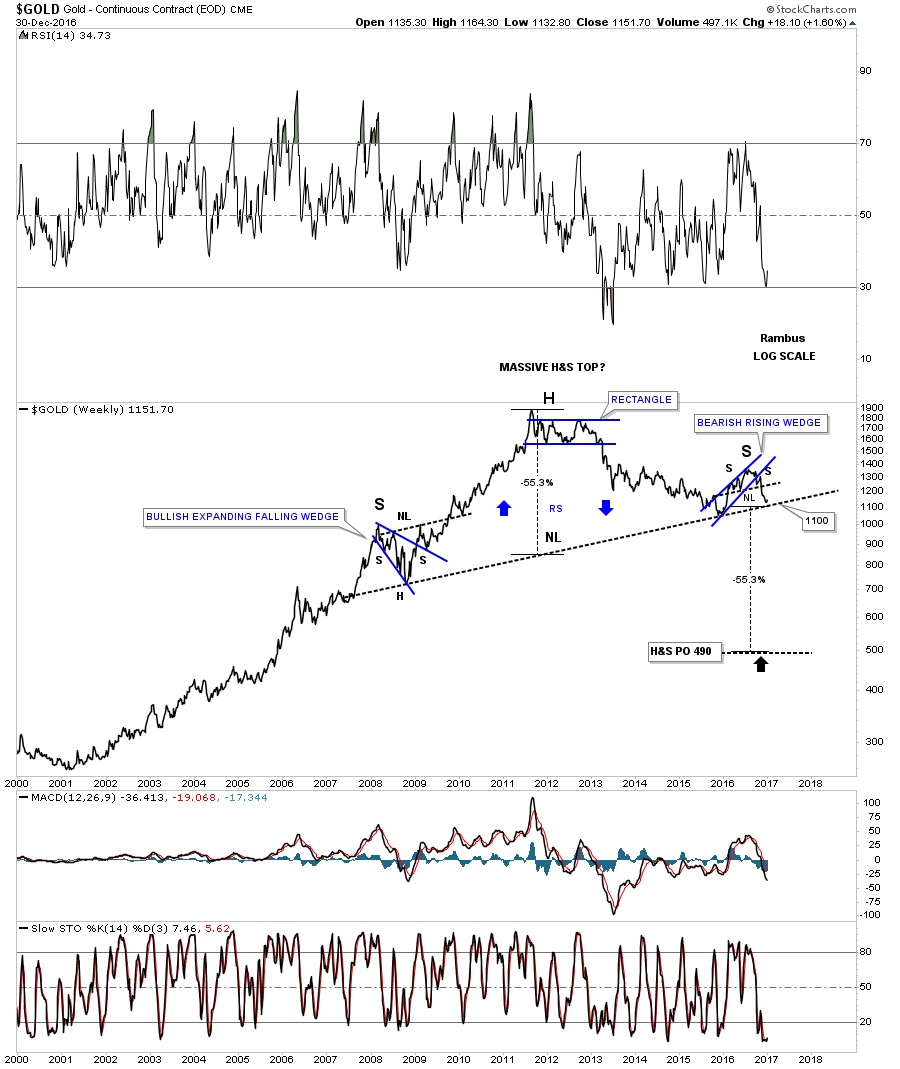
Below is a shorter term weekly chart showing the double H&S top in more detail.
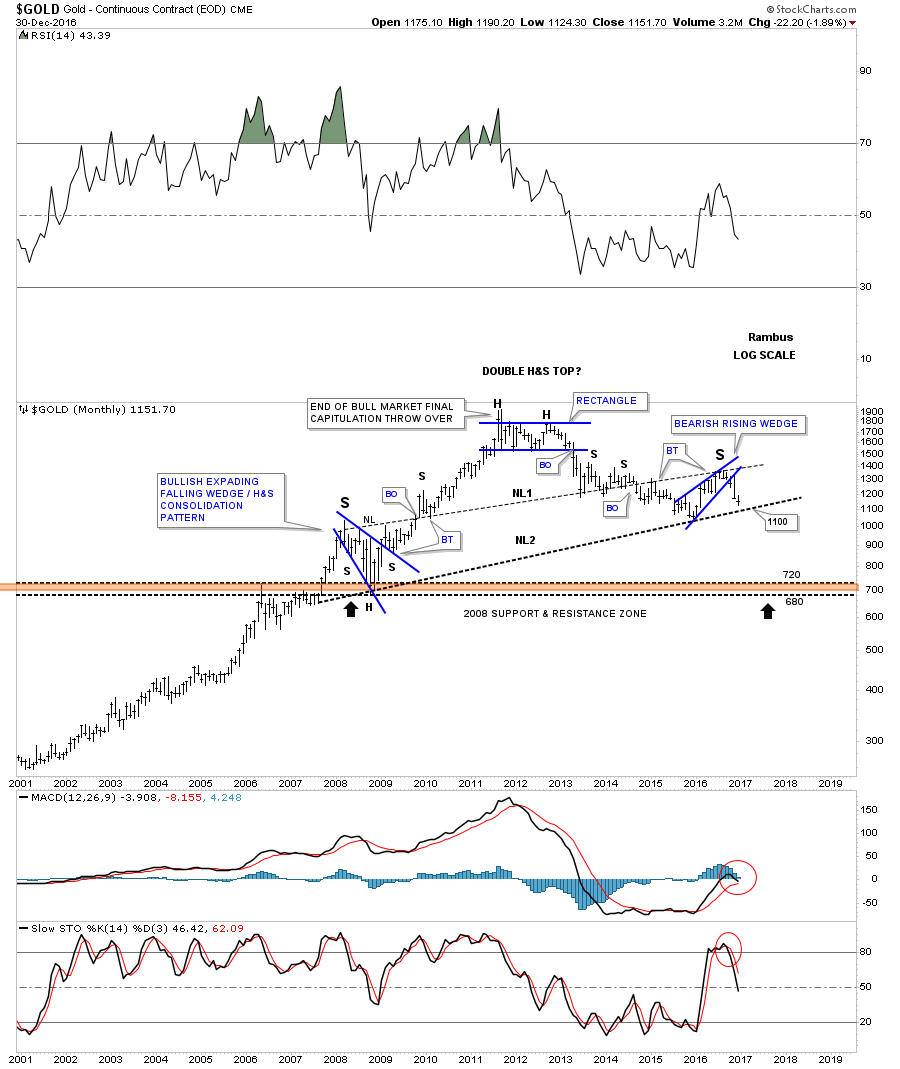
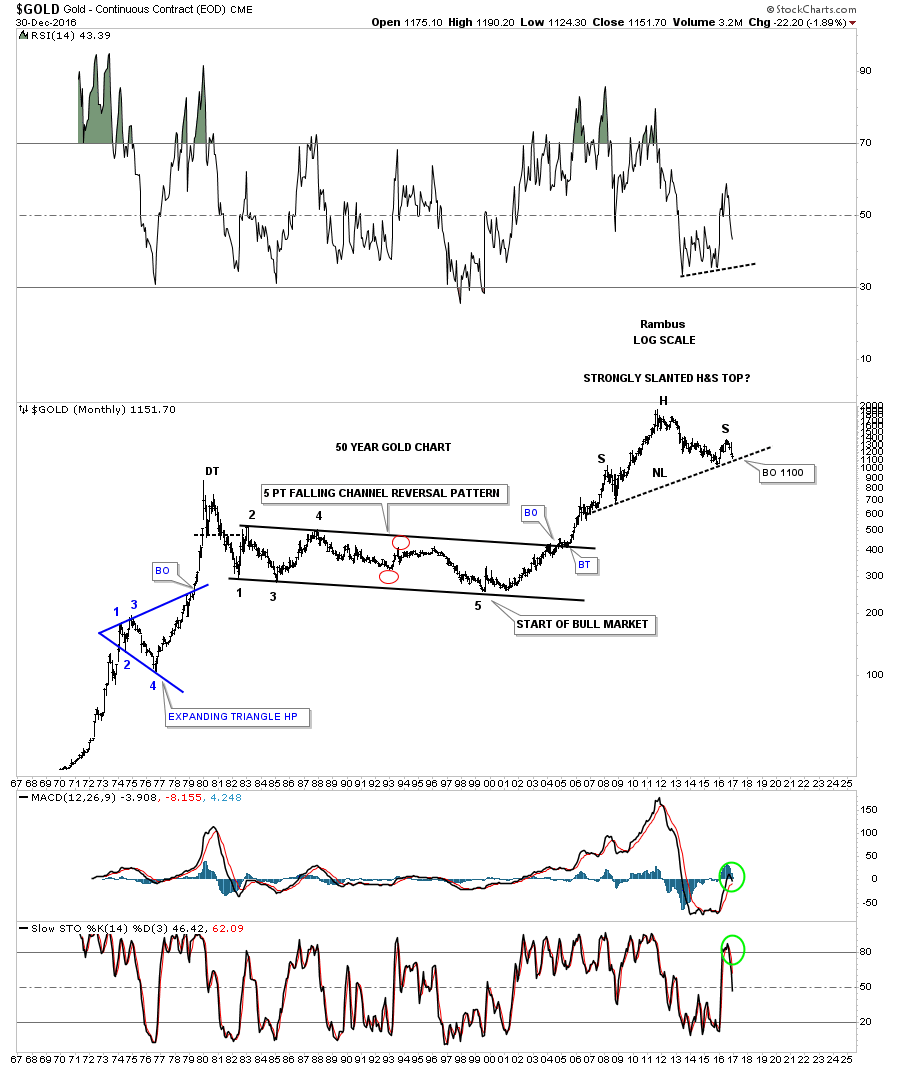
Now, on to the monthly bar chart which shows the parabolic bull market and the strongly slanted H&S top. Again, you can see how the 1100 area is going to be our line in the sand, which will have long term consequences if it the price action breaks below that now very important neckline.

This next monthly line chart for gold has just one trendline, which is the neckline.
This last chart for tonight is a long term monthly look that goes back 50 years and is pretty self explanatory.
We like to think of ourselves as not being part of the herd, but it’s very difficult not to be. With all the information we absorb everyday it’s bound to affect us in ways we don’t understand. If this massive H&S top plays out you’ll be some of the first PM investors that will understand what is really taking place in the precious metals complex. The bottom line is that if the 1100 area at neckline #2 gives way a major long term top will be in place, and big patterns equals big moves. All the best…Rambus