This content is for Yearly and Monthly members only.
Subscribe
Subscribe
Already a member? Log in here

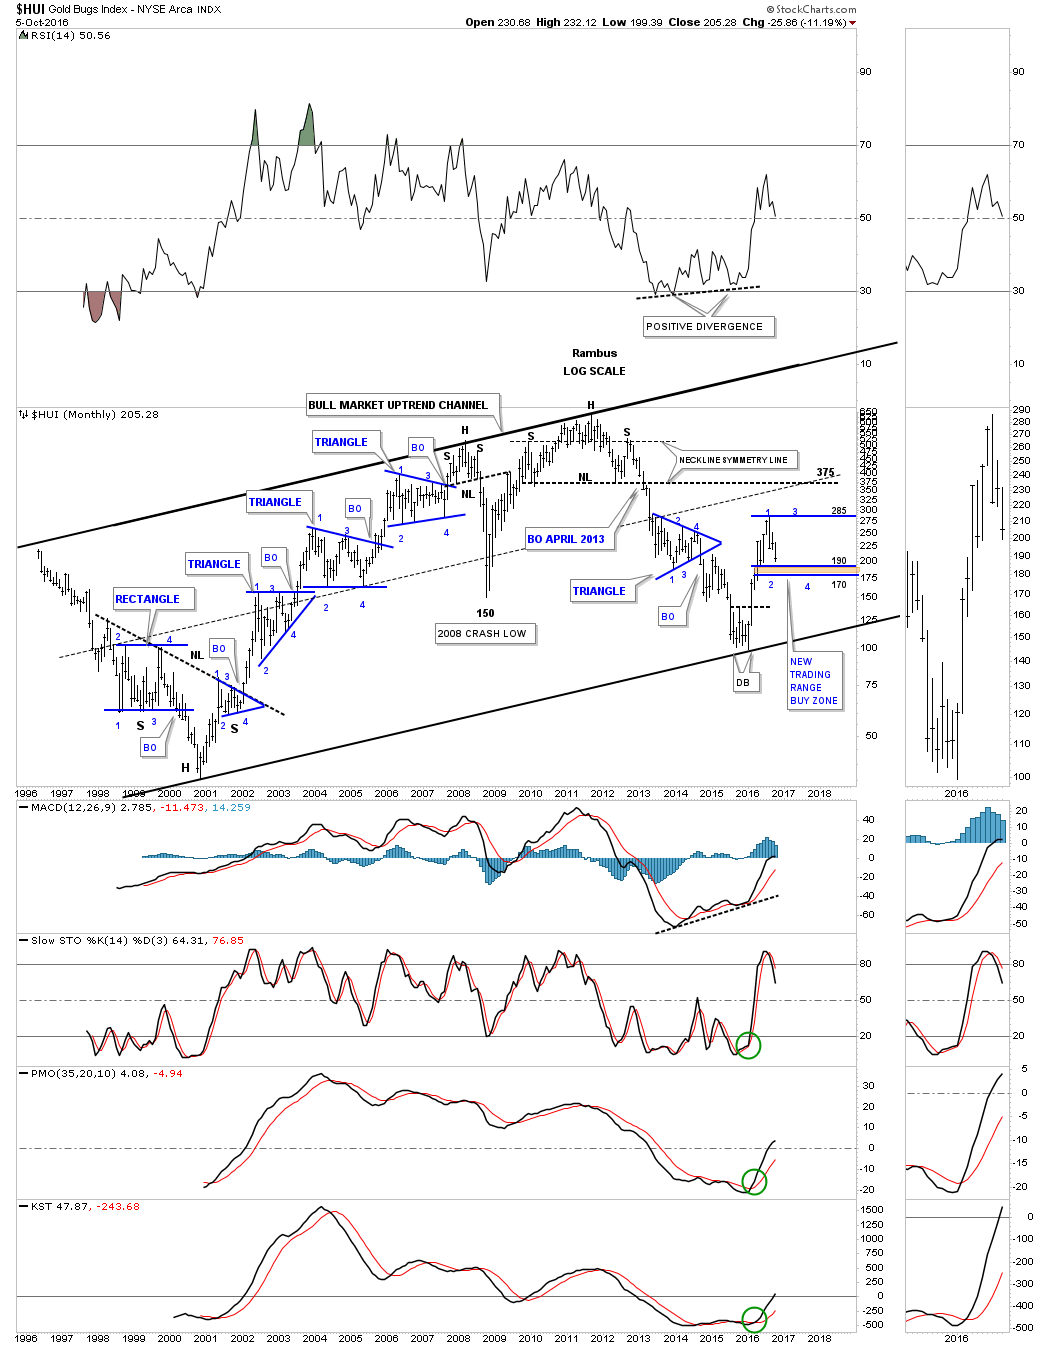
This past week there was some panic selling in the PM complex which is what we need to see happen to put in an important low. The HUI hit the 50% retrace at 195 for this first leg up in its new bull market, just under 200, which is an important physiological round number. Many times investor will place their sell/stops just under a round number like 40, 50 or 200 for instance, thinking if a stock drops below that important round number it’s time to exit that position. Many times a drop below these round numbers can be the reversal point for the next rally in the case of an uptrend.
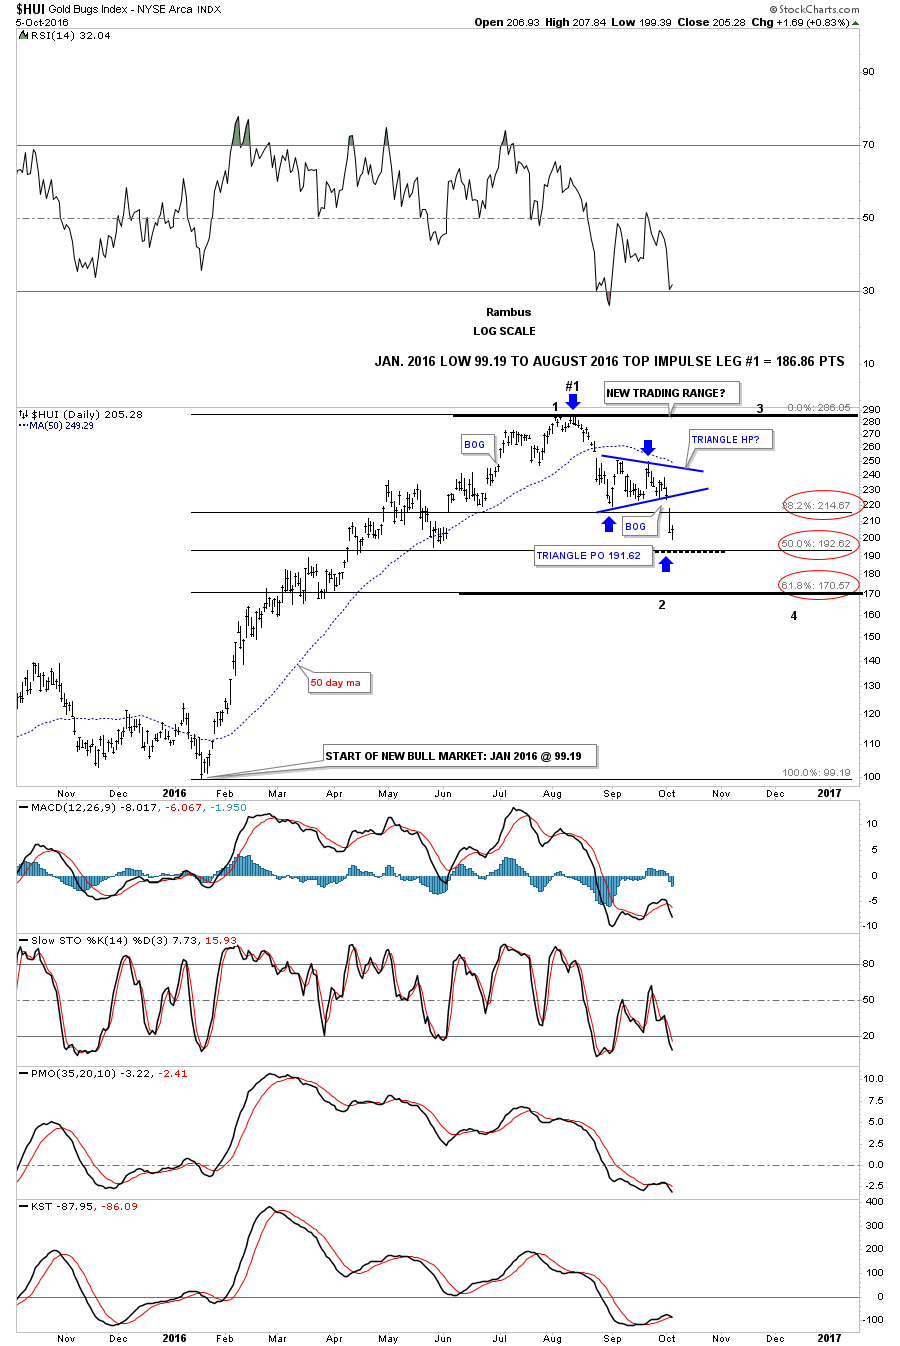
This first chart is a daily chart we’ve been following which shows the first impulse leg up and our first correction taking place. The 50% fib retrace plus the price objective for the small blue triangle comes in at the190 area, which is the tip of the strong buy point. As I mentioned last Friday the 190 area on the HUI is a place to start nibbling on your favorite precious metals stocks. If the HUI moves down into the brown shaded area, which I have labeled as a strong buy zone, this would represent your lowest risk entry point back into the precious metals stocks.
If the HUI were to break below the 62% retrace on a closing basis that would be the first red flag that the bull market in the PM stocks was in trouble. At this point in time this is a normal correction taking place in one of the strongest first legs up in history for the HUI. Emotionally it can be challenging to buy, when everyone is selling, as things are the bleakest at an important low.
Price wise the 170 to 190 area represents the lowest risk entry point back into the PM stocks. Time wise it can be a little different as we could see a V bottom but most likely there will be some type of small reversal pattern form, such as a double bottom or H&S bottom, which would be the two patterns I’ll be looking for. Identifying this first low will be important to the big picture, as this initial low normally marks the low for the rest of the bull market, just like the January low has.

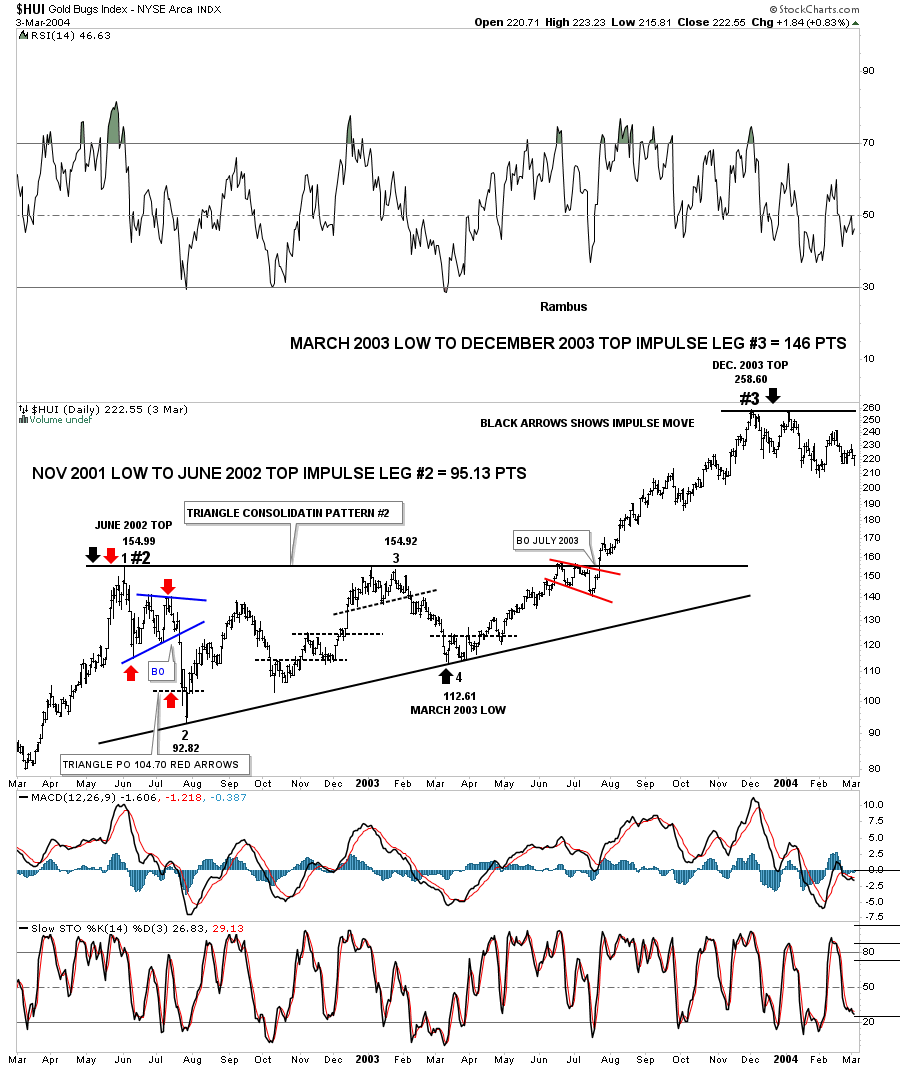
We looked at this next chart for the HUI in the Wednesday Report, which has the closest fit to what we’re seeing for our current correction. After bouncing for a day or two at the price objective in 2003, the HUI then capitulated down to the bottom at 92.82, which marked the end of reversal point #1 and the beginning of reversal point #2 back up. That low at 92.82 was never approached again during the rest of the bull market. Also note the price action doesn’t have to rally straight back up to the top of the trading range. We have no idea how long this correction may last but the odds favor some type of consolidation period should take place after such a big initial thrust out of the January bottom.
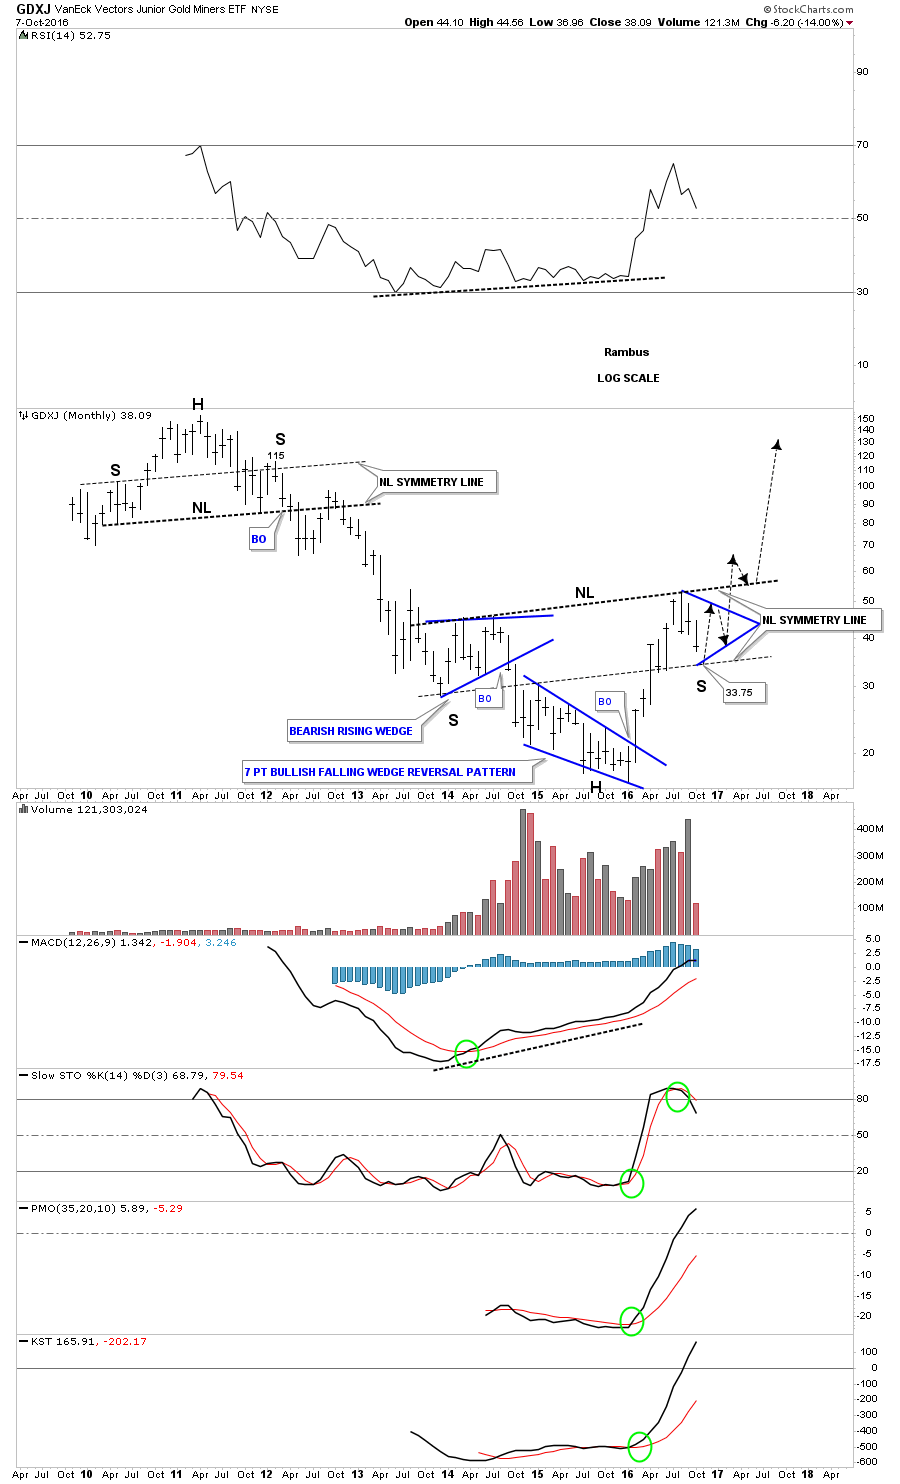
I would like to show you a long term monthly chart for the GDXJ which embodies the Chartology for the rest of the precious metals stocks indexes. If we are truly at the beginning of what may become one of the greatest bull markets of our lifetime then we should see a massive base in which to launch this bull market from. This monthly chart below shows the entire history for the GDXJ which was born during the later phase of the 2000 bull market when it formed its massive H&S top along with all the other PM stock indexes.
For over three years now the GDXJ has been building out a massive inverse H&S bottom with the possible right shoulder under construction presently. The neckline symmetry line shows the 33.75 area could mark the low for the right shoulder. This is exactly what happened during the formation of all the big H&S tops, in all the different PM stock indexes in 2011. The neckline symmetry line nailed the right shoulder highs, which actually started the bear market.This chart also shows you how from a time perspective, it could take six month or so to complete some symmetry to the left shoulder, possibly building out a triangle or falling wedge to complete the right shoulder.
When I look at the potential for this massive H&S bottom I get the same feeling I had when I saw all the massive H&S tops forming in 2011 for the PM stock indexes. It was so obvious but most investors never saw that massive H&S top until well after the bear market began. There was one short post I did as a, Late Friday Night Chart in which I labeled it, The Elephant in the Room, as the H&S top was so obvious but few seen it in real time.
https://rambus1.com/2013/03/01/friday-night-chart-2/
Keep in mind things were very bullish in the PM complex back in 2011 when the head was formed. It was just the opposite when the head was formed in January of this year after one of the greatest bear markets of all time ended just under 17.00. The 33.75 area, at the neckline symmetry line, could equate to the same area as the top of the right shoulder in February of 2012, when the GDXJ was trading at the neckline symmetry line around the 115 area. That area marked the absolute best shorting opportunity available. The 33.75 area at the bottom of our current neckline symmetry line could mark the absolute best buying point for this next phase of the bull market, when this potential massive base is completed. After nearly three years of base building the GDXJ looks like it’s in the finishing stages of completing a massive H&S base, which is what we need to see, if we’re going to see a once in a lifetime bull market. Big patterns equals big moves.
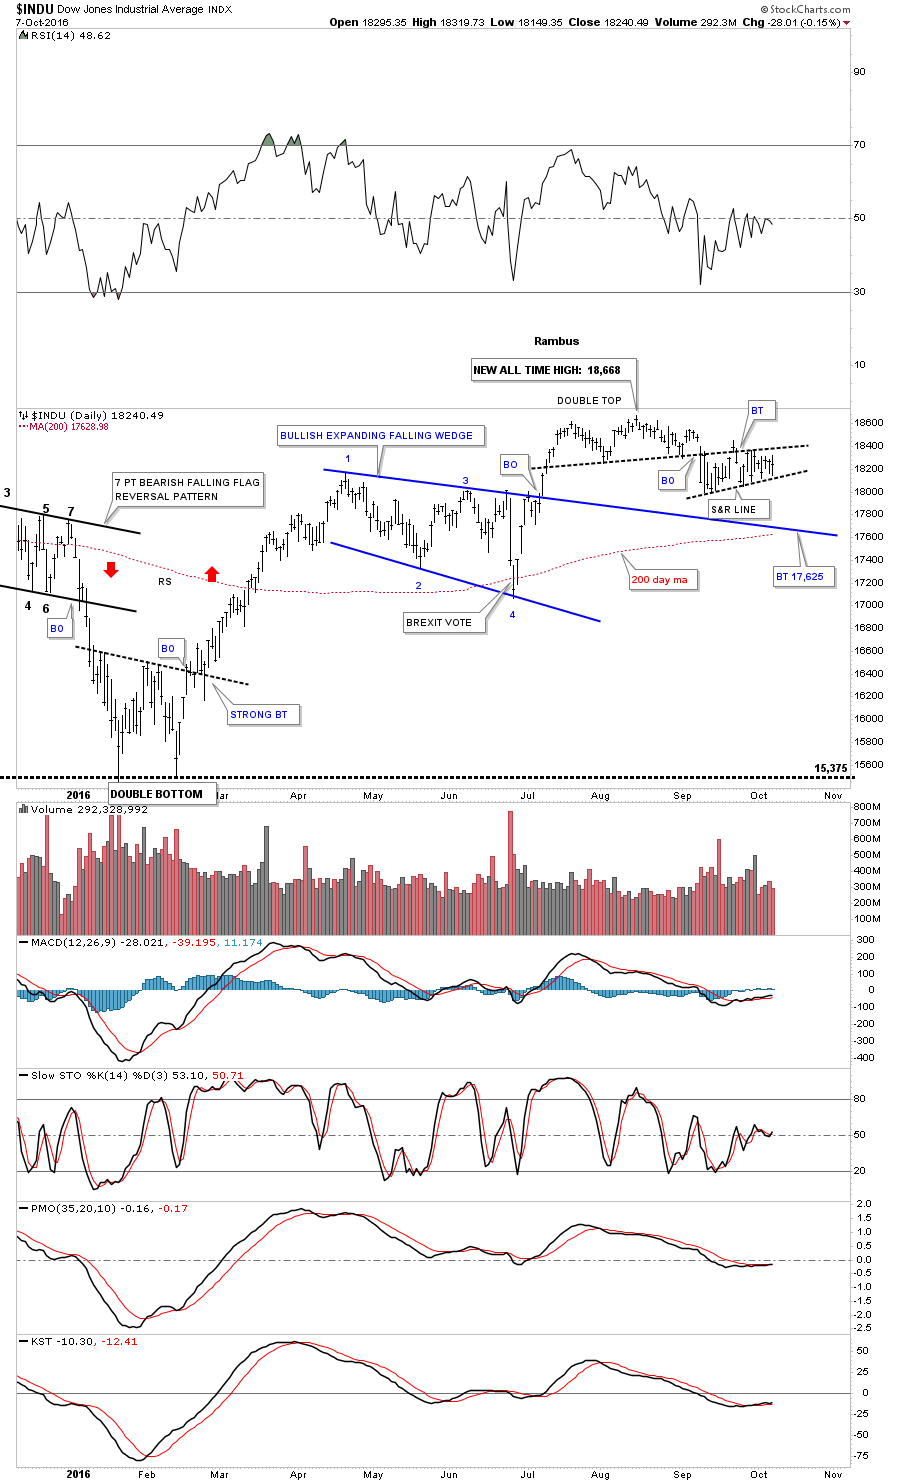
After the BREXIT vote and using the INDU as a proxy for the other stock market indexes the INDU rallied up strongly to a new all time high at 18,668, where it put in a small double top during the dogs days of summer. The price action broke below the double top trendline in September and has been backtesting that DT trendline ever since, creating another small S&R line. If the INDU breaks below the S&R line it could decline down to the top rail of the blue expanding falling wedge and the 200 day moving average, around the 17,625 area which should offer strong support.
The weekly chart for the INDU shows you the big picture and why the 17,625 area should offer initial support at the top rail of the blue expanding falling wedge and the 30 week ema. Except for the BREXIT vote, which is the spike below the top rail of the expanding falling wedge, the INDU has been acting in a positive manner for all of 2016.
I’m going to be doing an indepth quarterly report this week for Catherine Austin Fitts so I’ll be covering all the different areas of the markets from the PM complex, commodities, currencies and stock market indexes from around the world. It takes a lot of work to put these big quarterly reports together but it forces you to look at all the different areas to see if there are any major changes from the previous quarterly reports. It’s always important to look at the big picture first and then work your way back to the smaller time frames for perspective. It looks like another busy week ahead in more ways than one. Have a great weekend and all the best…Rambus

Tonight I would like to start off the Wednesday Report by looking at our current bull market in the HUI. I’m going to try and show you how our current setup is what one would expect in a bull market.
A stock or stock market does one of three things. First, it’s building out a reversal pattern that will reverse the current trend. Second, it’s building out a consolidation pattern that is consolidating the current trend. Third, the price action is impulsing after breaking out of either a reversal pattern or consolidation pattern. This is how markets works.
Below is a long term monthly chart for the HUI which shows the price action described on the paragraph above. As you can see the price action is either building out a reversal pattern, consolidation pattern or is impulsing in one direction or the other. This chart shows classic Chartology. On the right hand side of the chart the HUI had a big impulse move up out of its bear market low in January of 2016. At some point, during an impulse move, it will finally run out of gas and will begin to consolidate its gains. This is what I believe is happening presently. Note the bull market that began in 2000 with all the blue triangle consolidation patterns with an impulse leg between them. We’ll look at those in more detail later.
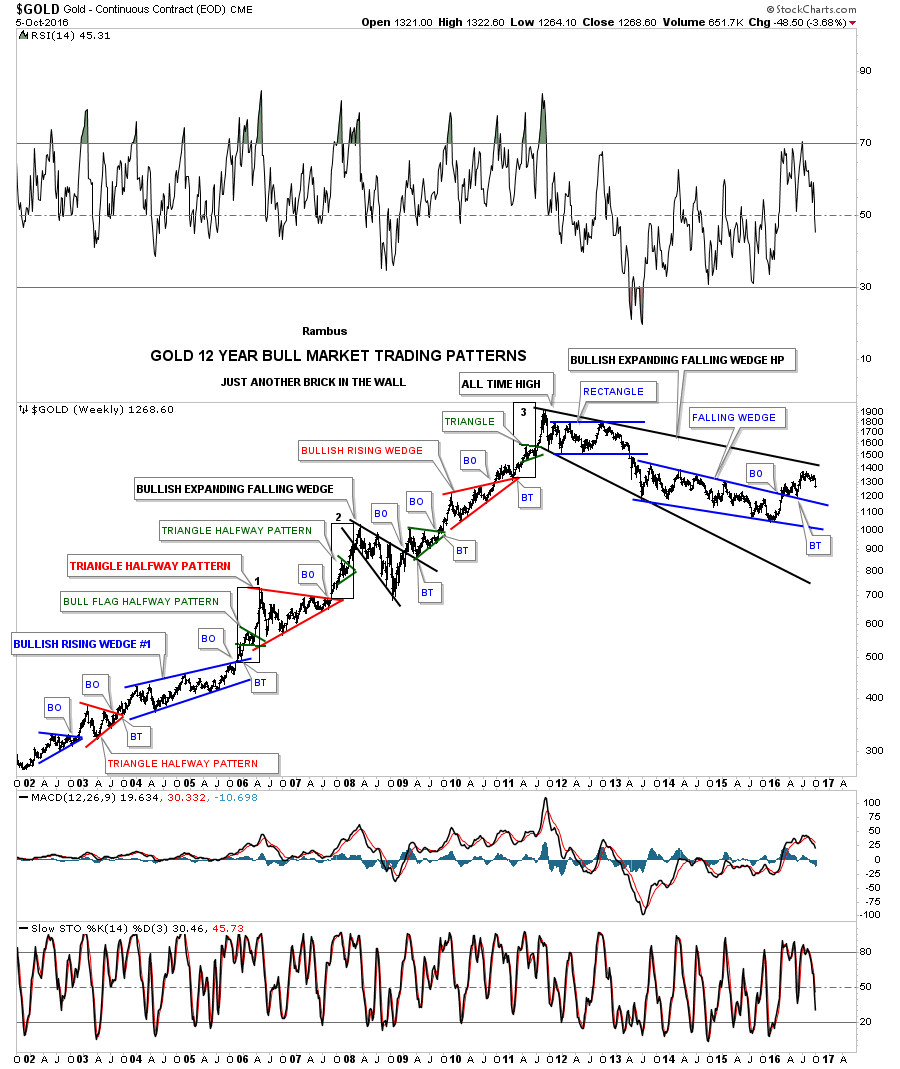
This next chart is a weekly chart for gold which I call, JUST ANOTHER BRICK IN THE WALL, which shows all the consolidation patterns that formed during gold’s bull market years from 2000 to 2011. I’ve always said this was one of the most beautiful bull markets of all time. Put yourself in anyone of those bigger consolidation patterns to get a feel of what it would take to hang on during the consolidation process. What’s important to notice is that gold never made a lower low except during the 2008 crash low as shown by the black bullish expanding falling wedge. If you look real close you can see little green triangles that formed halfway in many of the impulse moves up.
Looking to the right hand side of the chart you can see the very large black expanding falling wedge which is very similar to the 2008 black expanding falling wedge. Since the bear market low in December of 2015 gold has made a series of higher highs and higher lows. At this point the one thing that will get me concerned about our new bull market would be if I see gold close below the recent low, which was the backtest to the top rail of the blue bullish falling wedge.
One last note on the chart below. Notice how gold made all lower lows and lower highs from its bull market top in 2011 until the breakout above the bullish falling wedge.
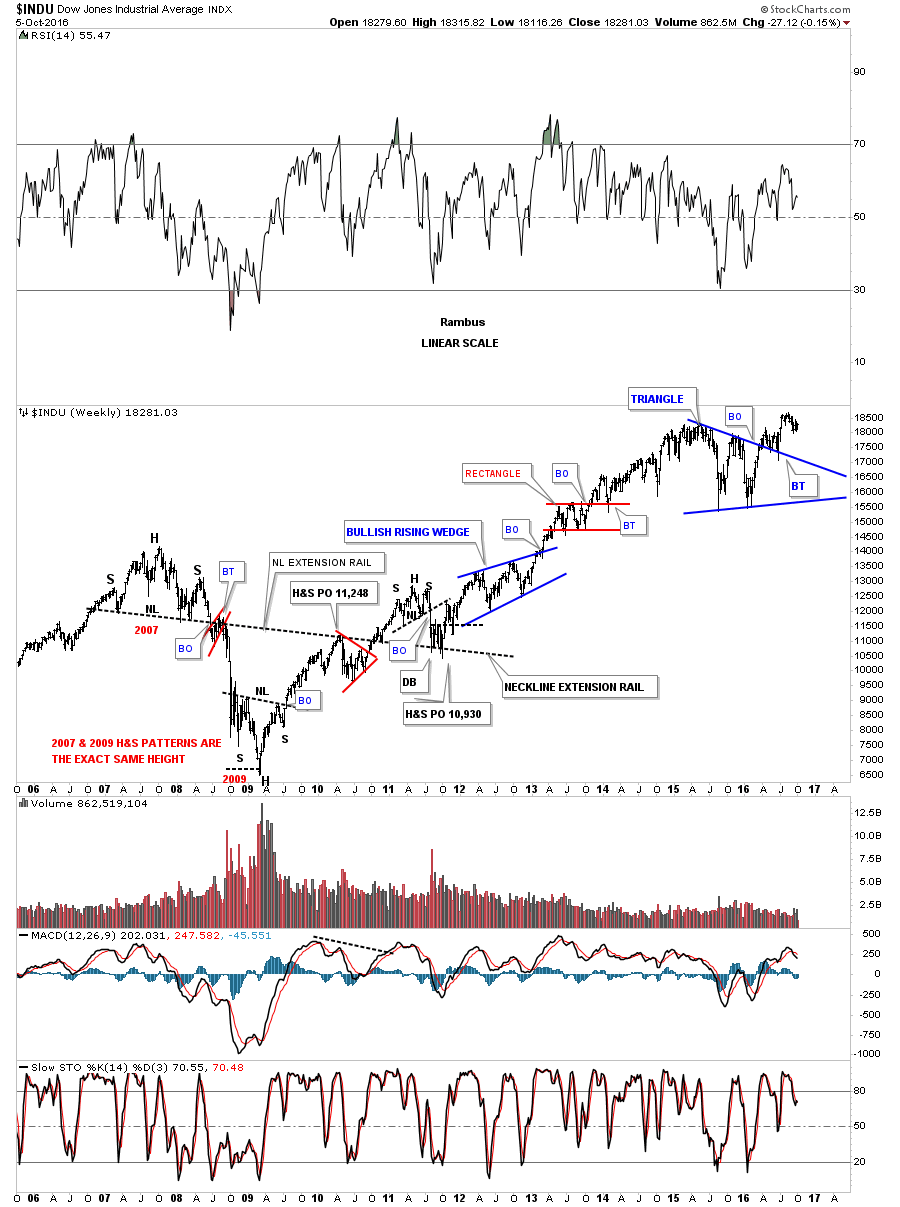
This next chart is an old weekly chart for the INDU which shows the same thing as the gold chart above. This eleven year chart starts with the H&S top in 2007 which lead to the infamous bank and housing crash. That H&S top, which reversed the bull market up to that point, was the reversal pattern. The second reversal pattern formed at the 2008 – 2009 crash low which was the same height as the 2007 H&S top.
From that bear market low in 2009 began one of the most hated and greatest bull markets of all time. Note the small H&S top that formed back in 2011 which temporarily reversed the uptrend. As you can see that small H&S top found support on the old neckline extension rail that was actually taken from the 2007 H&S neckline labeled neckline extension rail. It’s pretty hard to see but there was a small double bottom that formed on the neckline extension line which reversed the price objective from that small H&S top.
Now I would like to turn your attention back to the present daily chart for the HUI keeping in mind the charts we just looked at above. This first chart for the HUI shows the impulse move up in its new bull market that began in January of 2016 and topped out in August of this year. As you can see this correction is bigger than any of the previous small correction that formed during this first impulse move up. As I mentioned previously I would expect the 62% retrace of the new bull market to be the worst case scenario if the HUI dips that low. The little blue triangle has a price objective down to the 50% retrace which comes in around the 192 area.
At this point in time there is no way to know what type of consolidation pattern may build out so for now the top and bottom trendlines are horizontal. As you can see we are now closer to the bottom of this new trading range than the top. So far this is normal Chartology behavior taking place.
Before you read this next section please go back and review the first chart in this post which is the 20 year monthly chart for the HUI which shows all the blue triangle consolidation patterns that formed when the bull market began in 2000.
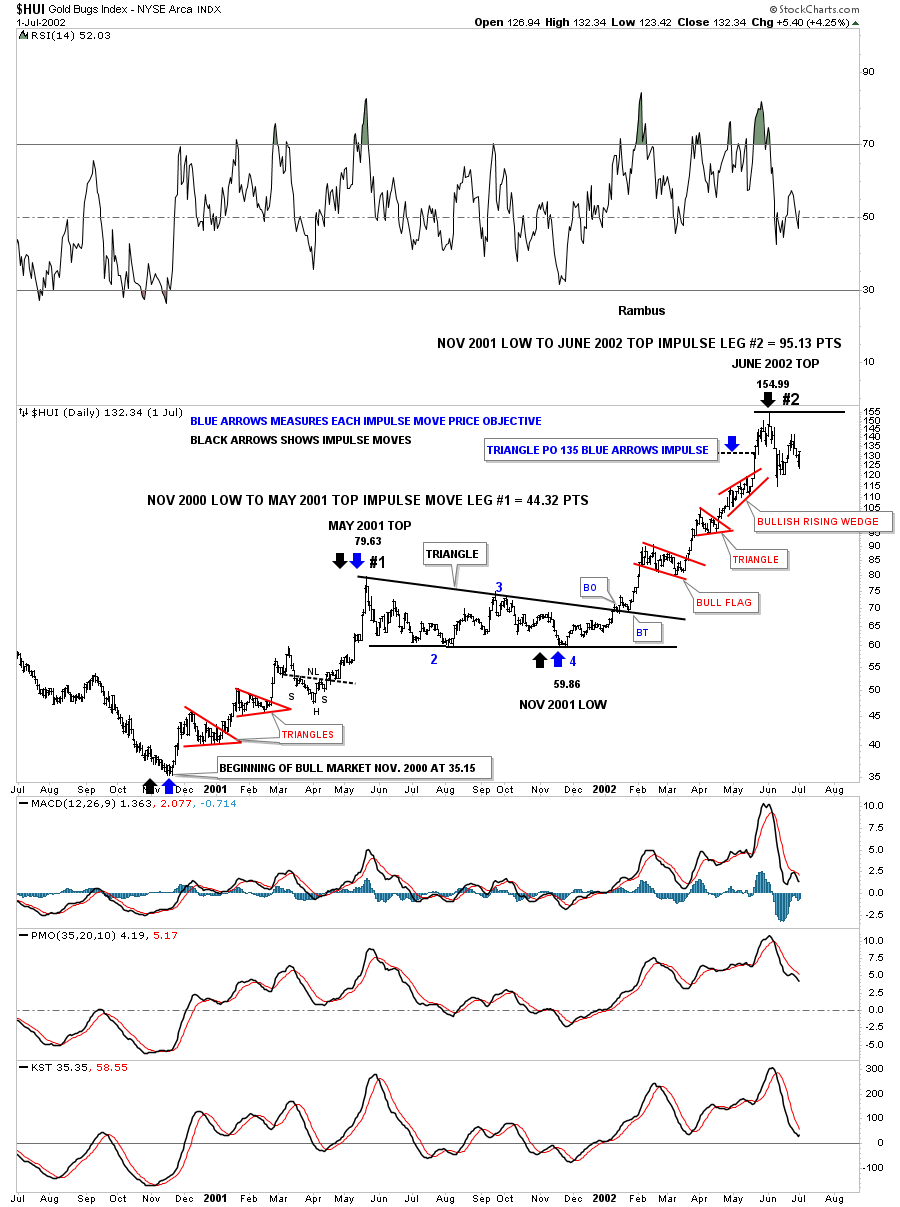
This first chart shows the bear market low in November of 2000 and the first impulse move up that topped out six months later in May of 2001. That first impulse move up gained 79.63 points before the HUI began to correct and build out its first consolidation pattern which was the black triangle.
After a nearly six month correction the HUI began its second impulse leg up gaining 155 points in six months. Note how each impulse leg formed three smaller consolidation patterns. At this point there are two impulse moves up with the triangle consolidation pattern sitting in the middle.
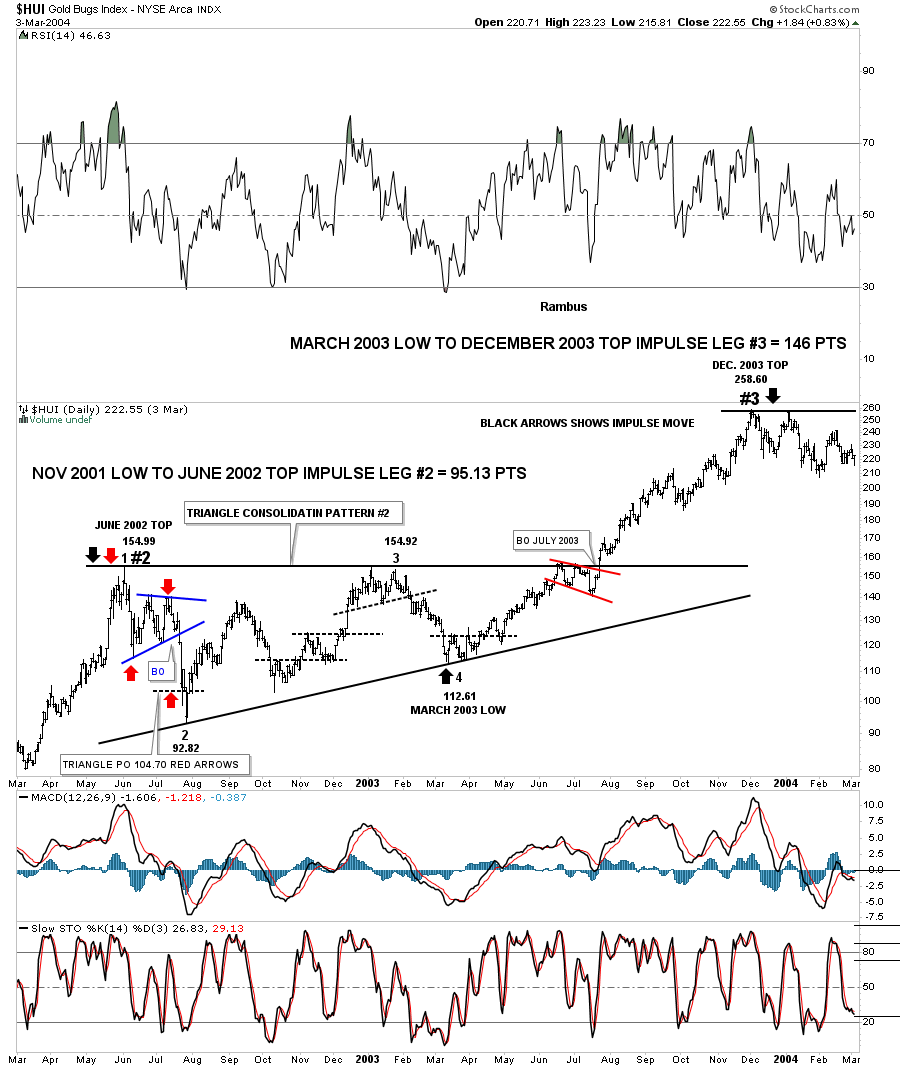
This next chart for the HUI starts where the last one leaves off at the June 2002 top, impulse leg #2. The beginning of this second triangle consolidation pattern looks eerily similar to our current one. The red arrows measures the price objective for the small blue triangle down to the 104.70 area. As you can see the price action spiked to the bottom at 92.82 which created the second reversal point in the black triangle that built out over the next year. Impulse leg #3 began in March of 2003 and ended in December of 2003 gaining 146 points.
You may have notice the small black dashed lines which shows small reversal patterns at the reversal points. In big consolidation patterns like this these are the patterns I look for to try and trade within the consolidation patterns. Sometimes they’re very obvious but other times they can be hard to spot in real time. The main thing to keep in mine when trading these consolidation patterns is the big picture. It’s easy to get chopped up trading these consolidation pattern but knowing where the top and bottom of the trading range are located can help immensely.
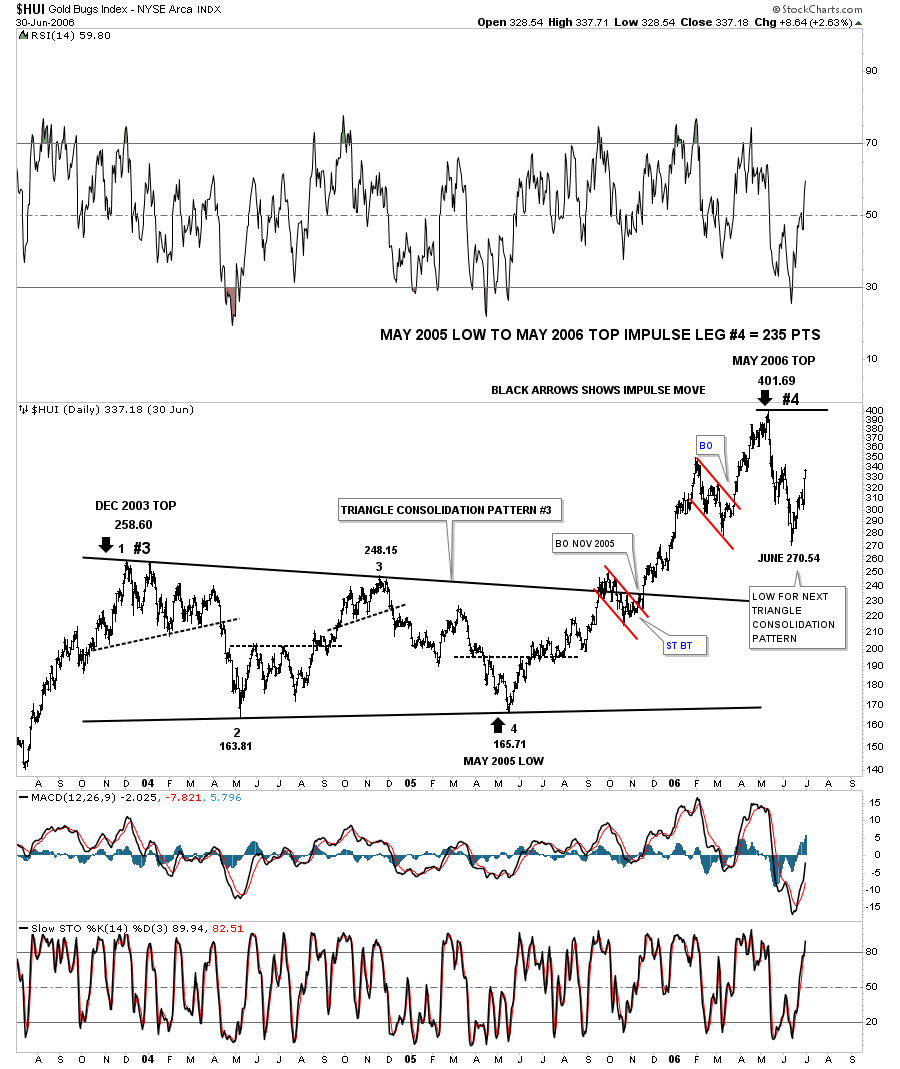
This last chart for the HUI tonight starts where the last one left off at impulse leg #3. Again notice the black dashed lines which helps us find the reversal points inside the nearly two year triangle consolidation pattern. Impulse move #4 ran from May 2005 to May of 2006 which took one year to complete. This impulse move gained 235 points before it was finished. Big patterns equals big moves.
Note the hard shakeout after this last impulse move finished at 401.69. That two month shakeout down to 270 was actually the low for the next triangle consolidation pattern that would form.
There is no way to know how this bull market is going to play out. The odds favor that when we see a large impulse leg up that it will be followed by some type of consolidation pattern that will consolidate that move. It looks easy in hindsight when everything is 20/20 but it’s another story in real time. Knowing that after a large impulse move is finished that some type of consolidation pattern will form, will help us try to trade the swings within the consolidation pattern, always keeping the big picture in mind. All the best…Rambus