ANF.V Update…

Tuesday of this week ANF.V broke out of H&S consolidation pattern where I took an initial position and bought 3000 shares. The daily chart shows the breakout and backtest holding.

ANF.V BUY

The monthly chart really puts everything in perspective for this stock. The H&S consolidation pattern on the daily chart above is just part of a much bigger inverse H&S bottom on the monthly chart below. You can see the beautiful H&S top which ended the bull market. Big patterns lead to big moves. The H&S bottom is 2 1/2 years in the making with the price action testing the neckline presently. That big H&S bottom is actually bigger than the H&S top and has a price objective up to the old high around the 6.40 area. I’m going to put an order in to buy another 3000 shares at 1.83 which is just above the neckline, on the breakout.

ANV MONTHLY BUY

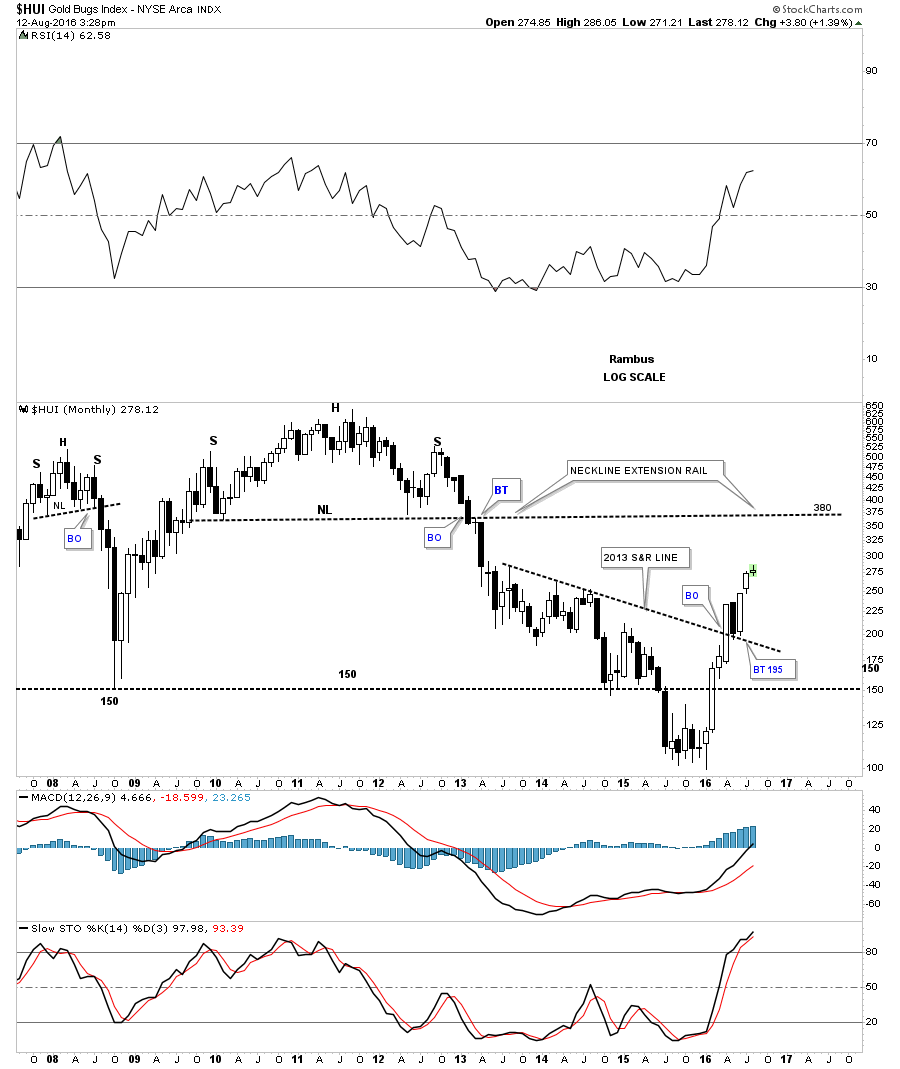
HUI Update…

Below is the reverse symmetry chart with the support and resistance lines we’ve been following since the new bull market began. So far the price action has interacted perfectly with each S&R line. The last rally phase took the price action above the highest S&R zone and now is backtesting it from above between 245 and 260. The 50 day moving average has been rising strongly and now comes in at the 234.06 area.

HUI S&R ZONE

The weekly line chart shows the reverse symmetry and S&R zones. As you can see the HUI made it all the way up to the top of the S&R zone at 275 where we should see it act as initial resistance which it has. The bottom of the brown shaded S&R zone comes in around the 245 area. The bottom of the S&R zone is taken from the highs made back in 2013 and 2014. Once this counter move down is complete and the next move higher begins, the area above the top of the brown shaded S&R zone is called the thin zone in which the price action can move easily threw until it reaches overhead resistance at the old neckline around the 380 area.

hui wweekly


$XJY Update…

This week the yen is backtesting the neckline on a possible three year H&S base at the 94 area. This is the first critical test of support.

yed week 1

Below is a longer term weekly chart for the yen which puts the H&S bottom on the chart above into focus. The lower portion of the base was the seven point inverted roof reversal pattern. On the completion of the inverted roof pattern the yen rallied back up to the bottom of the blue bearish falling wedge where we seen a small decline. That small decline built out the possible right shoulder of a pretty big H&S bottom. You can follow the price action which shows the yen is now at the backtest point to the neckline from above. So far this is exactly what we would expect from a Chartology perspective. Now we need to see the neckline hold support.

yen weekly big h&s base

This next very long term weekly chart is the reverse symmetry gap chart as shown by the green circles. If you recall we were looking for a possible reverse symmetry gap above neckline #2 after the bottom of our current right shoulder was put in place. We didn’t get the gap but the price action did have a clean breakout right at the neckline with no overlap to the downside. As you can see the backtest is taking place right now at the 94 area. If the inverse H&S bottom plays out we should see the yen rally up to the 112 area at a minimum. Neckline #2 also shows you a good example of how a support and resistance line works going all the way back to 2008. The price action is either above it or below it but the breakouts are clean with no overlapping of the neckline.

yen reverse gaps