This content is for Yearly and Monthly members only.
Subscribe
Subscribe
Already a member? Log in here

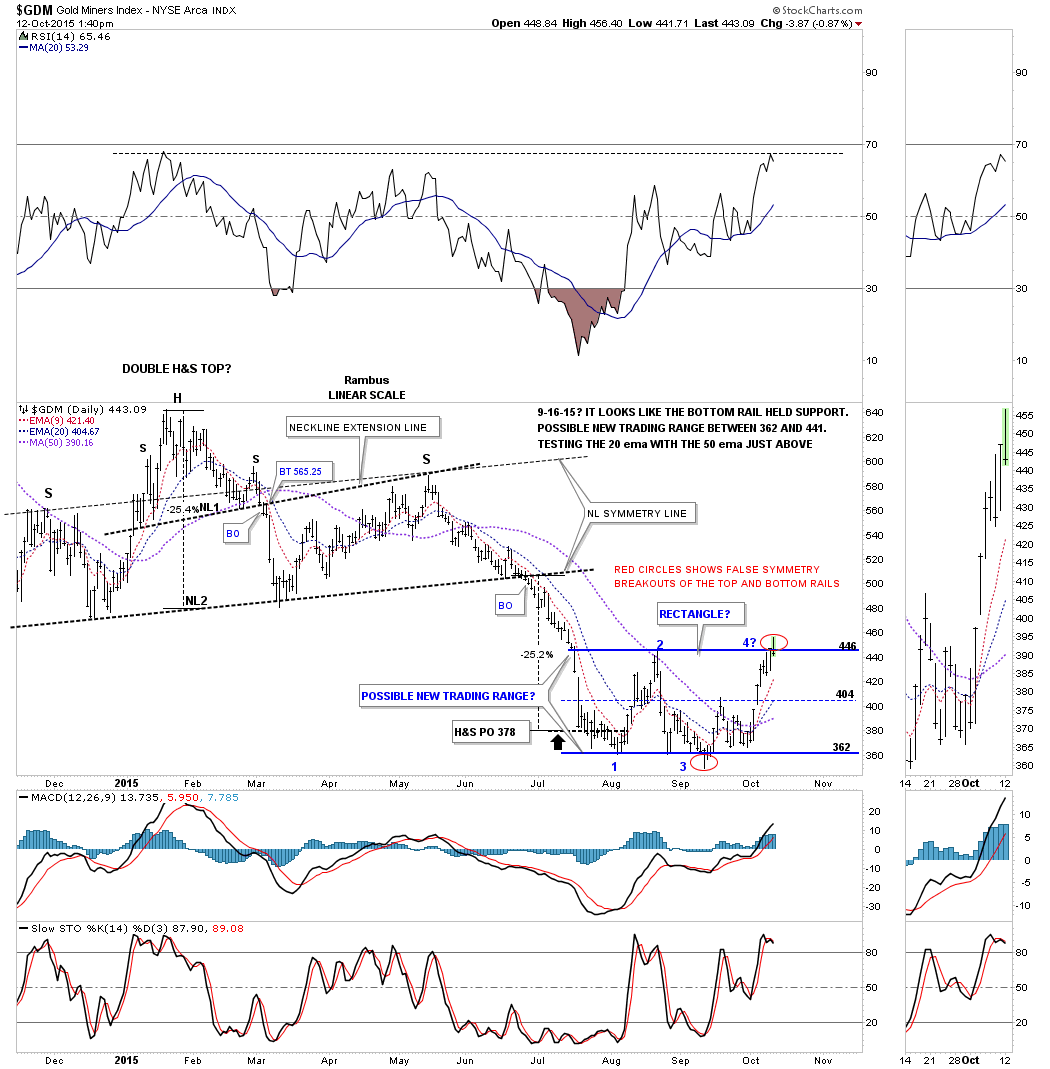
Below is the daily chart for the GDM we’ve been following for sometime now which is showing the potential trading range the GDM has been in since the first reversal point was put in back in late July of this year. Today the GDM spiked above the top rail of the potential rectangle consolidation pattern and has quickly reversed back down inside the rectangle. Today could very well show a false breakout to the upside, red circle, that matches the false breakout to the downside in September bottom red circle. I call these, false symmetry breakouts as they are the same height.
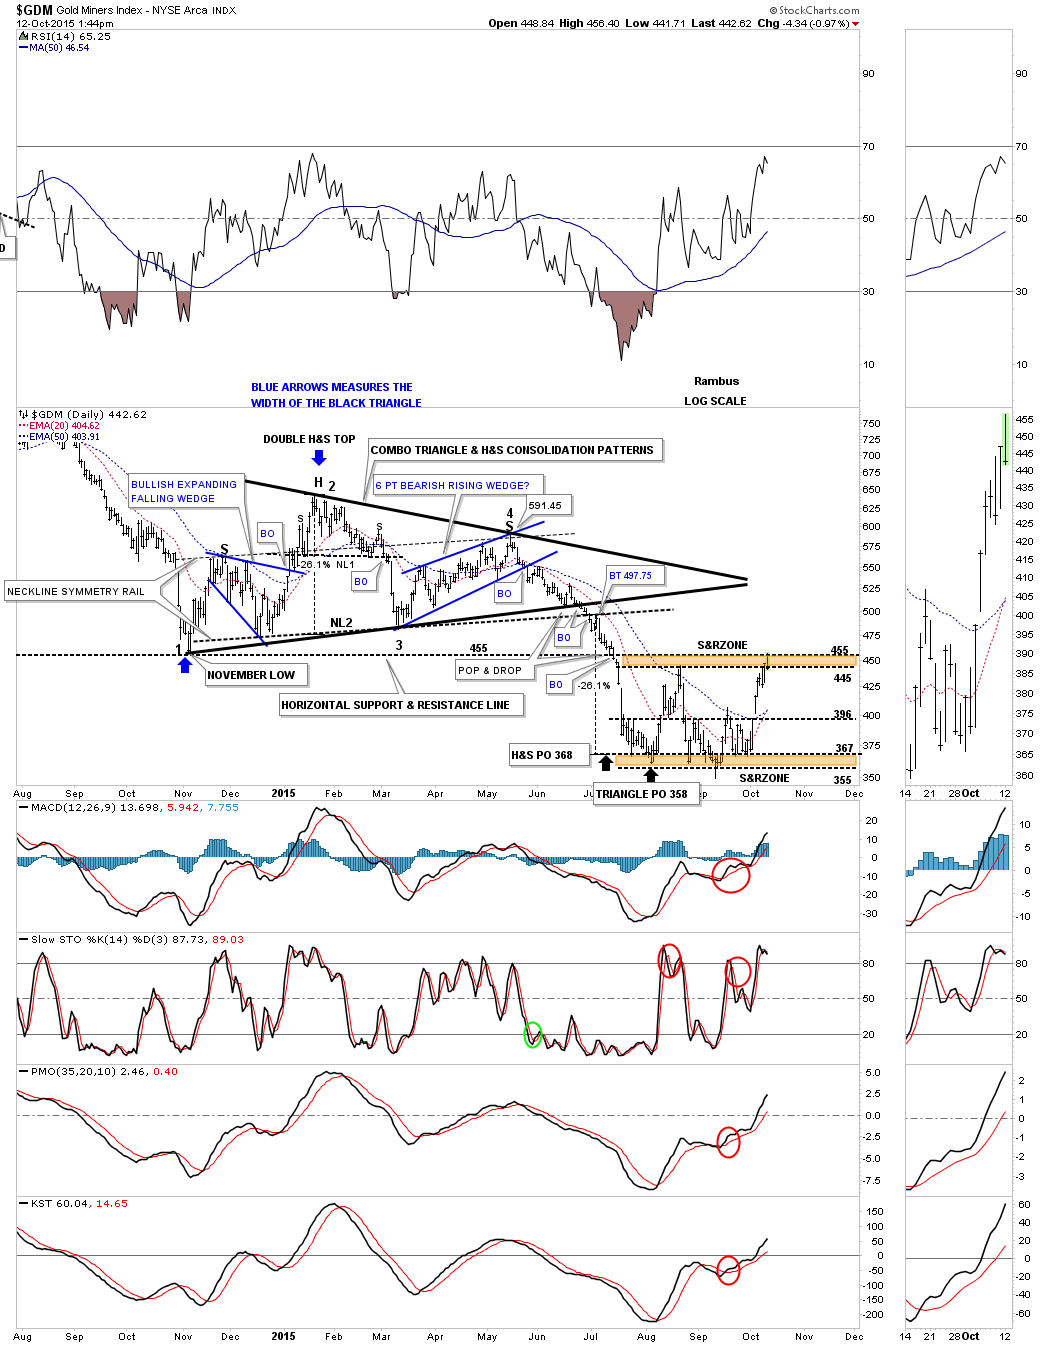
This next daily chart for the GDM shows the top and bottom brown shaded support and resistance zones. Today the GDX hit the top of the upper S&R zone at 455. The 455 line is taken from the low made last November which started the big triangle / H&S consolidation patterns which broke down in June of this year and has led to our most recent area of consolidation which is looking like a rectangle at this point.
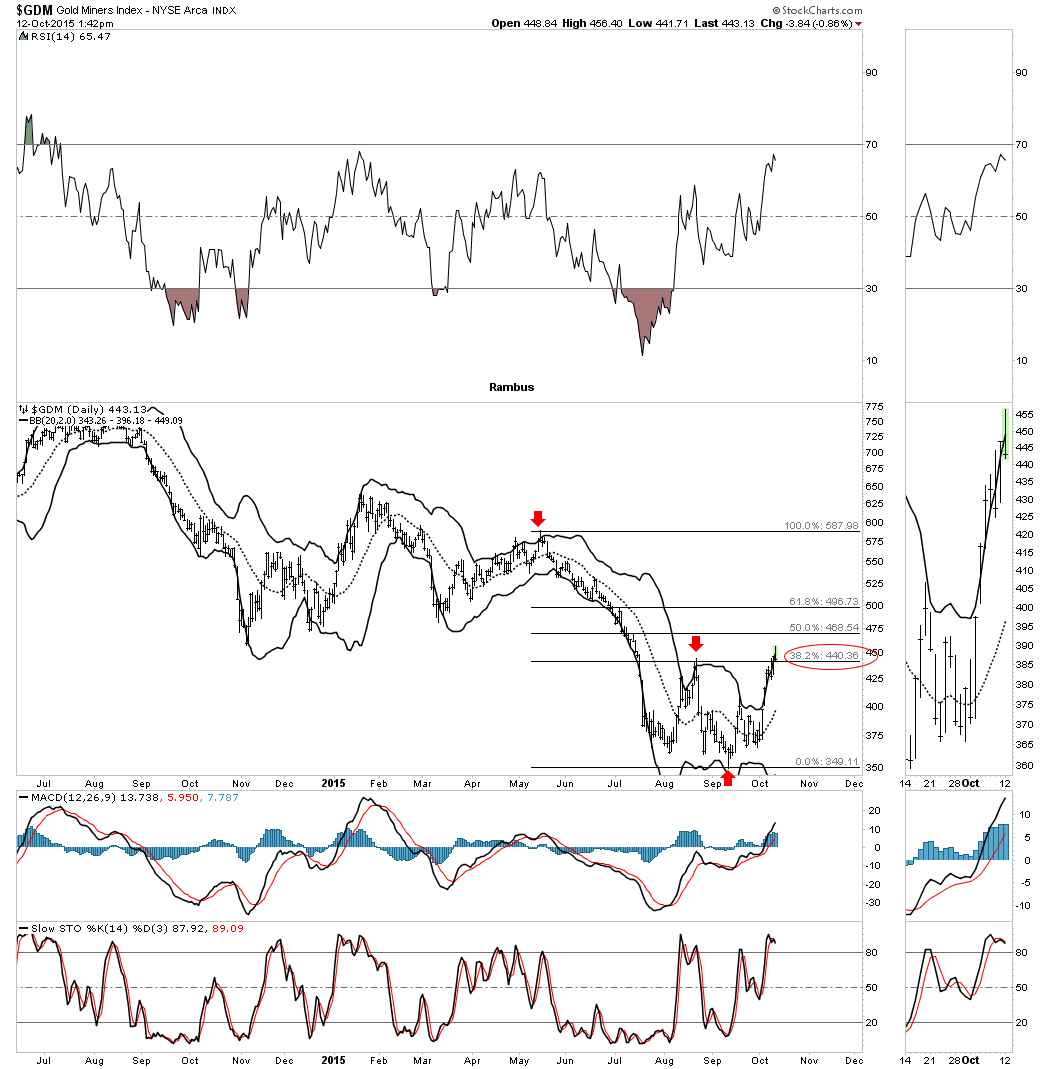
This daily chart for the GDM shows the BB bands which the GDM spike above this morning and the fib retrace which so far has held resistance between the 38% and 50% of the last move down as shown by the red arrows.
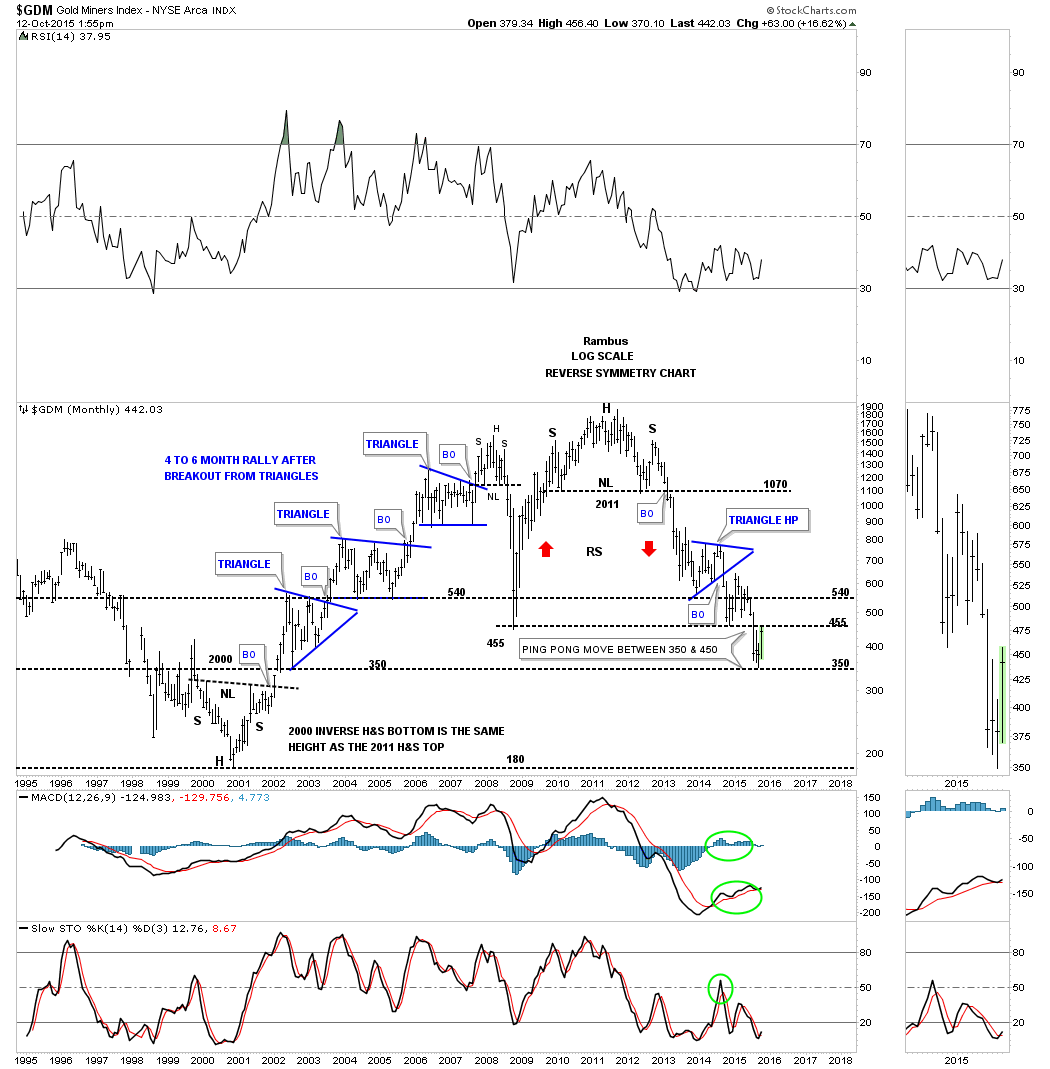
I’ve shown you this potential ping pong move on the monthly chart for the GDM which is between the 2008 crash low and the previous low around the 455 area. It’s basically caught between support and resistance.
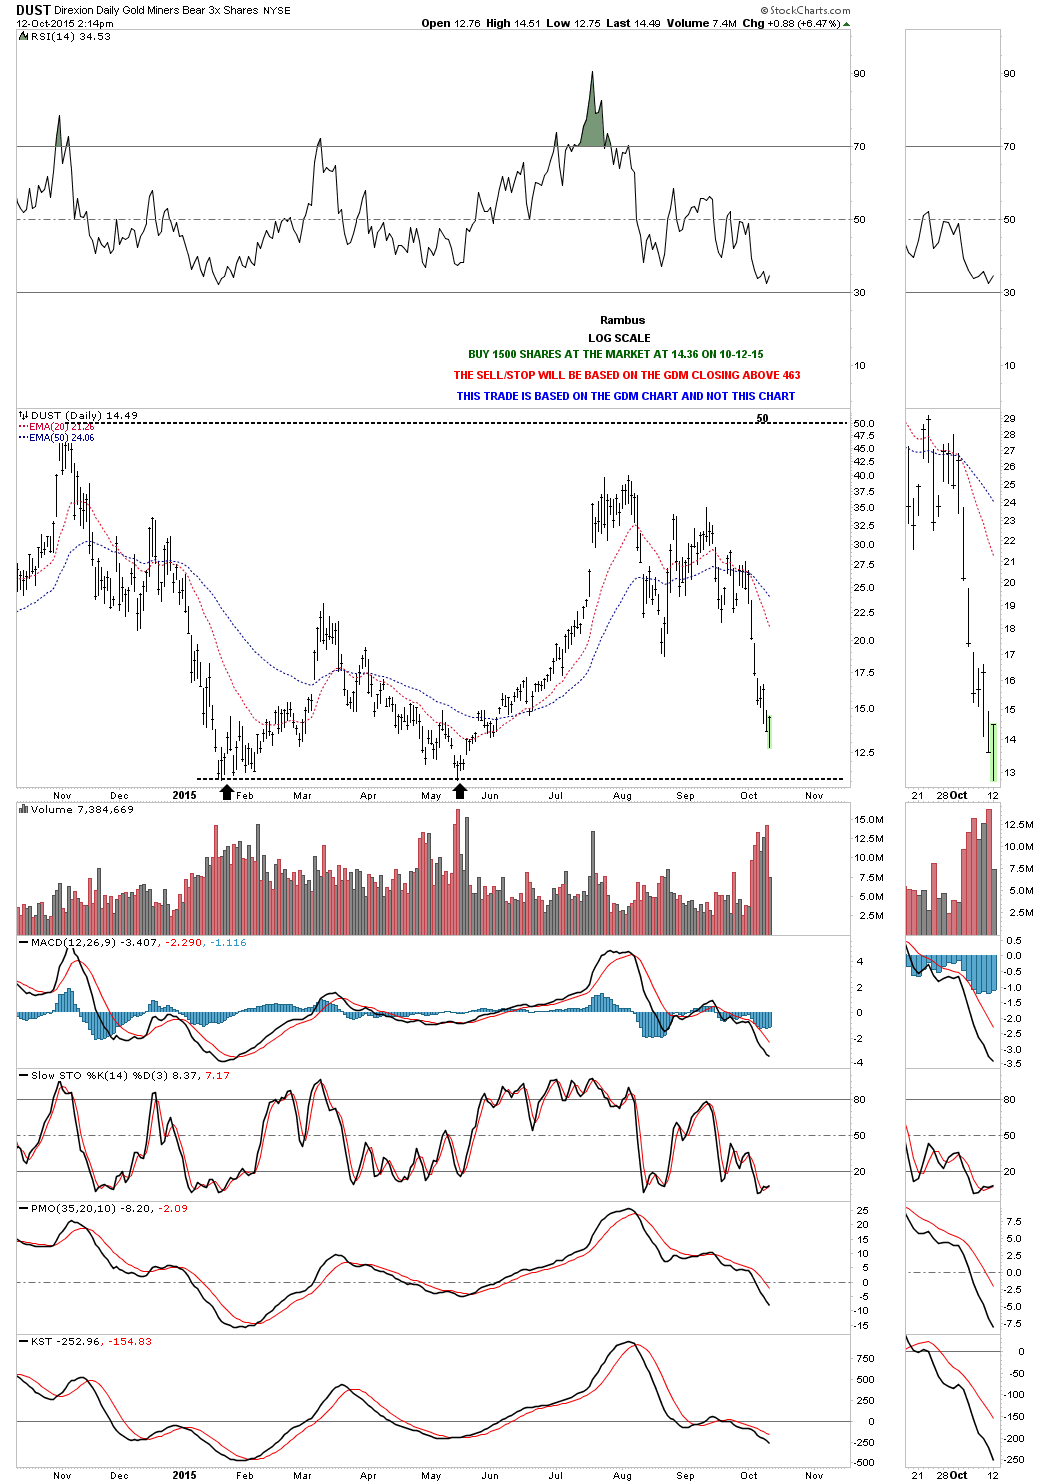
Based on the charts above I’m going to take an initial position in DUST and buy 1500 shares at the market at 14.36 using a closing price above 463 on the GDM chart as my sell/stop. This trade is based on the GDM chart and not the DUST chart.