This content is for Yearly and Monthly members only.
Subscribe
Subscribe
Already a member? Log in here

This from Sir Metallica at the Chartology Forum
Excerpt from the Oct.1, 2014 report:
“I envision we are starting a similar impulse move down that will have some twist and turns along the way that will try to shake us off. The ride won’t be easy but if you can hang on you will experience a ride of a lifetime… If you can fasten your seat belt and hold on for dear life, when the going gets tough, you will come out on the other side with a high cash reserve and the experience of actually riding and understanding what an impulse move is and how they work. That experience alone will be worth more than the profits you’ll make as you can take what you’ve learned and use it the next time you see an impulse move beginning. All the best…Rambus”
Excerpt from the Sept. 30 report:
“As I’ve been telling you the impulse move is happening right before your very eyes. You will be given every reason in the book to sell out and take a small profit with the hopes of getting back in. I imagine some of you are already at this point. It’s important that you understand what is happening right now. This is a totally different ball game from what we were playing for the last 15 months or so. Understanding the difference between a consolidation phase, topping phase or bottoming phase is totally different from the impulse move that happens when those patterns are finished building out.”
Any members who do not visit the Forum are missing some really good stuff
posted by some real Students and Teachers !!
24/7
Fully (Town Crier)
Tonight I would like to update a few oil charts I posted several weeks ago when oil was breaking out of that multi year five point triangle reversal pattern.
………………………….
Editor’s Note :See the links below to follow the evolution of this move in the Friday Night Energy Series .
……………………………….
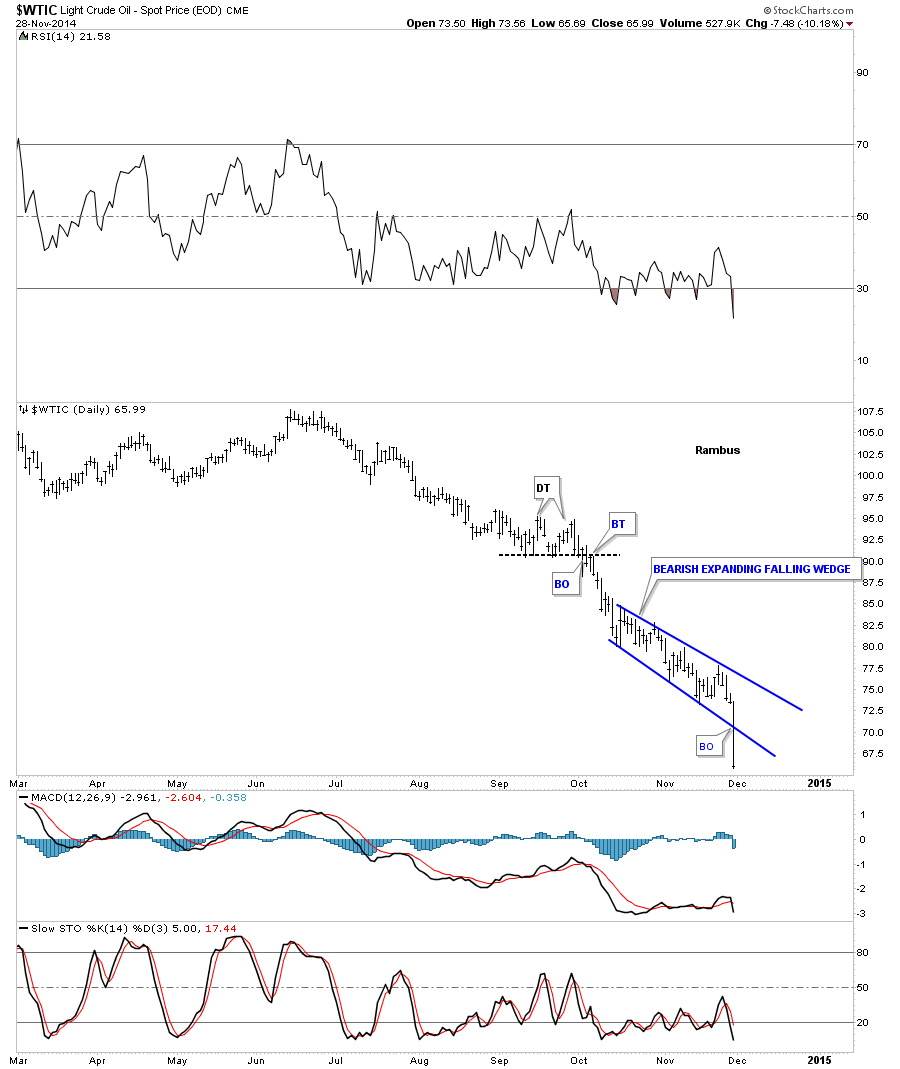
Before we look at the bigger picture I want to show you a short term daily chart that had an interesting day. There are several things I like to look at when I see a stock that looks like it’s breaking out. First, it’s nice to see an increase in volume but sometimes it happens a day or to later. Secondly, it’s always nice to see a gap where you were expecting a breakout. That gives you a little more confidence when your anticipating a breakout and it happens right where it should. The third thing I like to look for is a long bar that covers a lot of ground. It tells us that, in oils case, there were no more bulls left to defend the support zone, so they retreat en mass looking for the next support zone to try and defend. In a bear market all the bulls can do is put up some minor support as the big trend is down and they’ll be overrun again in due time by the bears. You can clearly see this on the short term daily chart for oil below.
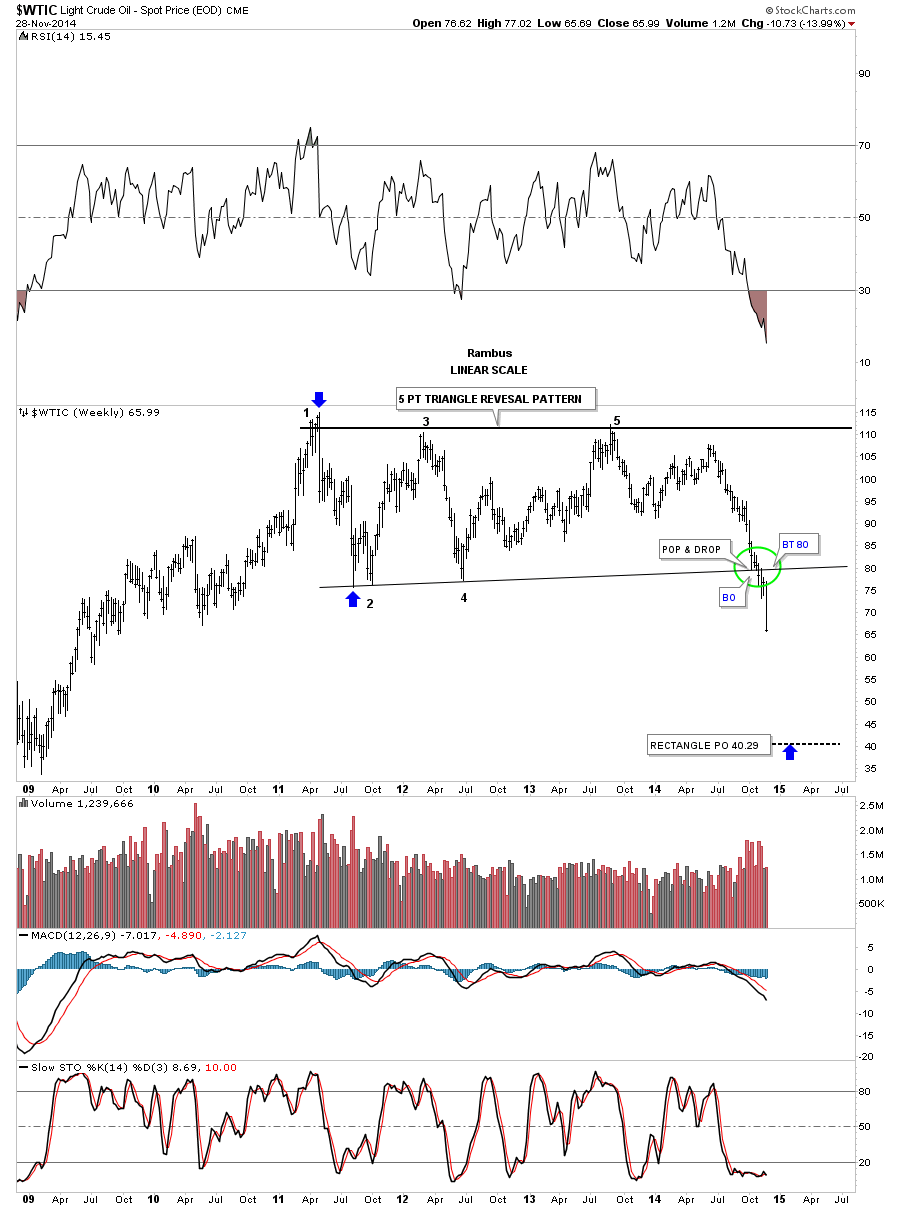
This next chart is the weekly look where I showed you the POP & DROP taking place at the bottom rail, green circle, of the 5 point bearish triangle. If you look at the price action very closely you can see oil tested the bottom rail for three weeks as support was holding. Then we had the drop where the price plunged right on through the bottom rail like a hot knife through butter. And if you look real close at the price action below the bottom rail you can see there was a quick backtest before this current impulse move got underway. Looking at a daily chart of the breakout area you can see the breakout and backtest more clearly. I purposelessly left the bottom rail of the 5 point triangle reversal pattern thin so you can see how cleanly the price action broke out and backtested the bottom rail.
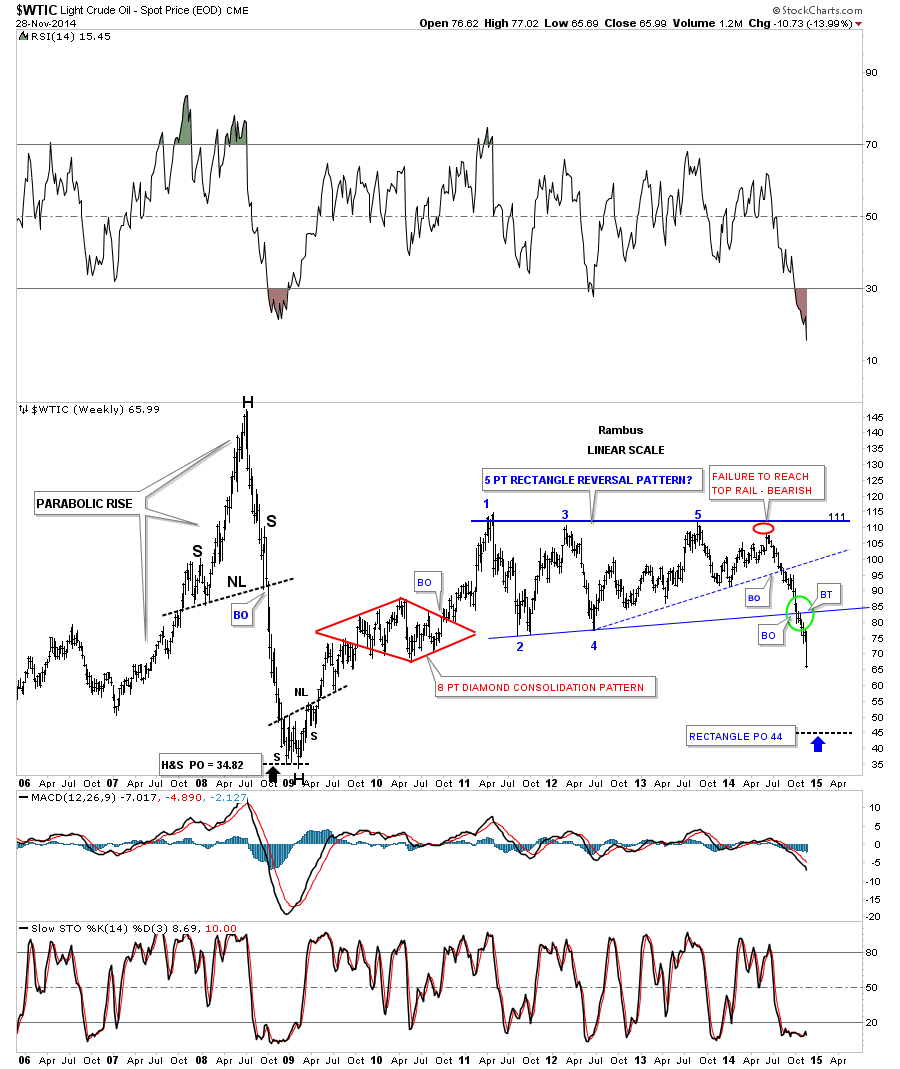
The next chart for oil is a long term daily look that shows all the different chart patterns going all the way back to 2006. It shows the beautiful parabolic rise back in 2007 & 2008, that as a chartists, I live for. To experience and follow every wiggle that a parabolic move makes, both up and down, is as exciting as it gets. After bottom in late 2008 and 2009 oil put on a decent rally forming the red Diamond as a halfway pattern to the high in 2011 where almost all commodities topped out including gold and silver. I would expect we’ll see some reverse symmetry now going down vs how oil went up into the 2011 high.
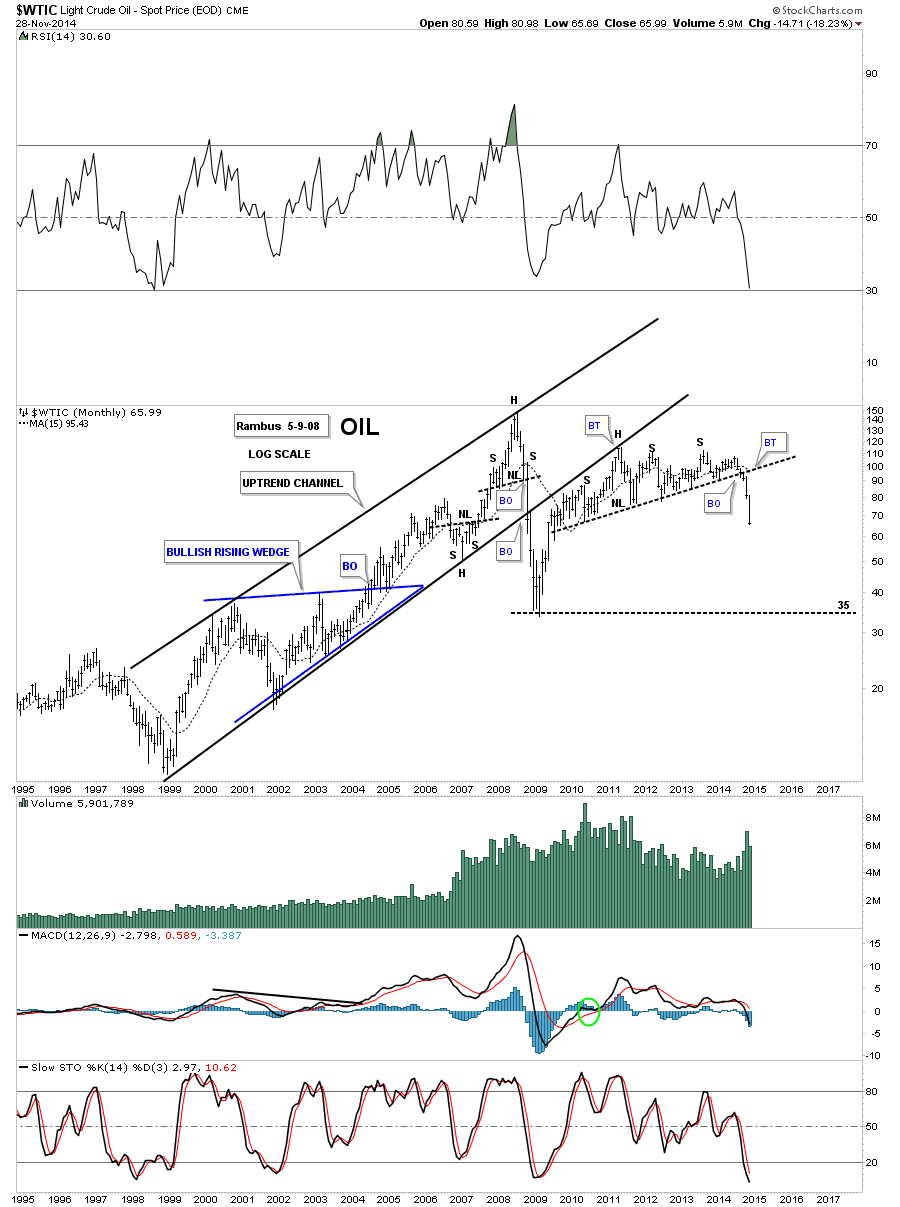
Below is a completely different view for oil that I had been following for years when the neckline became apparent. Note how many touches that neckline has. You can also see the breakout and backtest of the neckline that has led to our most recent impulse move lower. If you look to the left side of the chart, and the rally off of the 2008 low, you can see there really isn’t very much in the way of support as this decline unfolds. It’s possible at some point during this impulse move lower we might see some type of consolidation pattern form that will probably show we’re at the halfway point in this major decline.
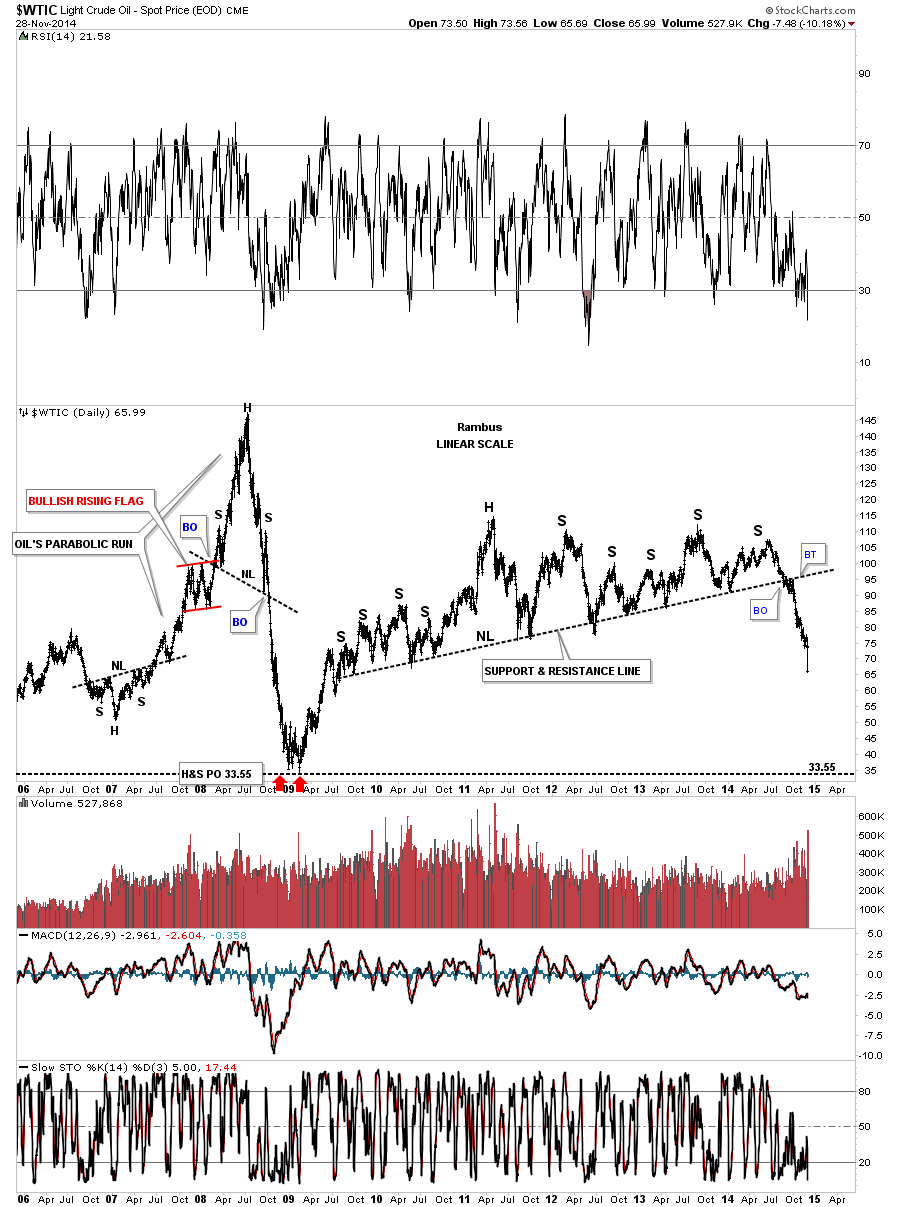
I’ll let this chart speak for itself.
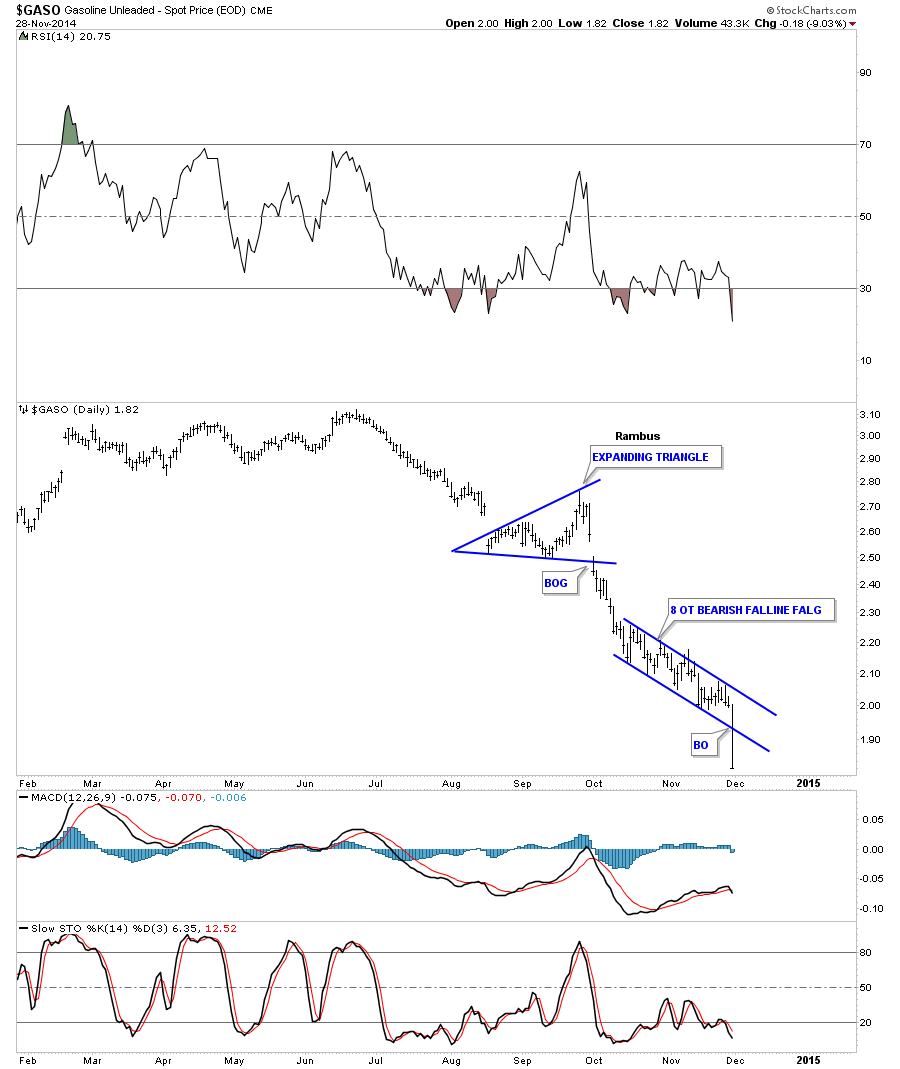
It’s been awhile since we looked at the GASO chart that is following in oil’s footsteps. Nice breakout today of an eight point bearish falling flag.
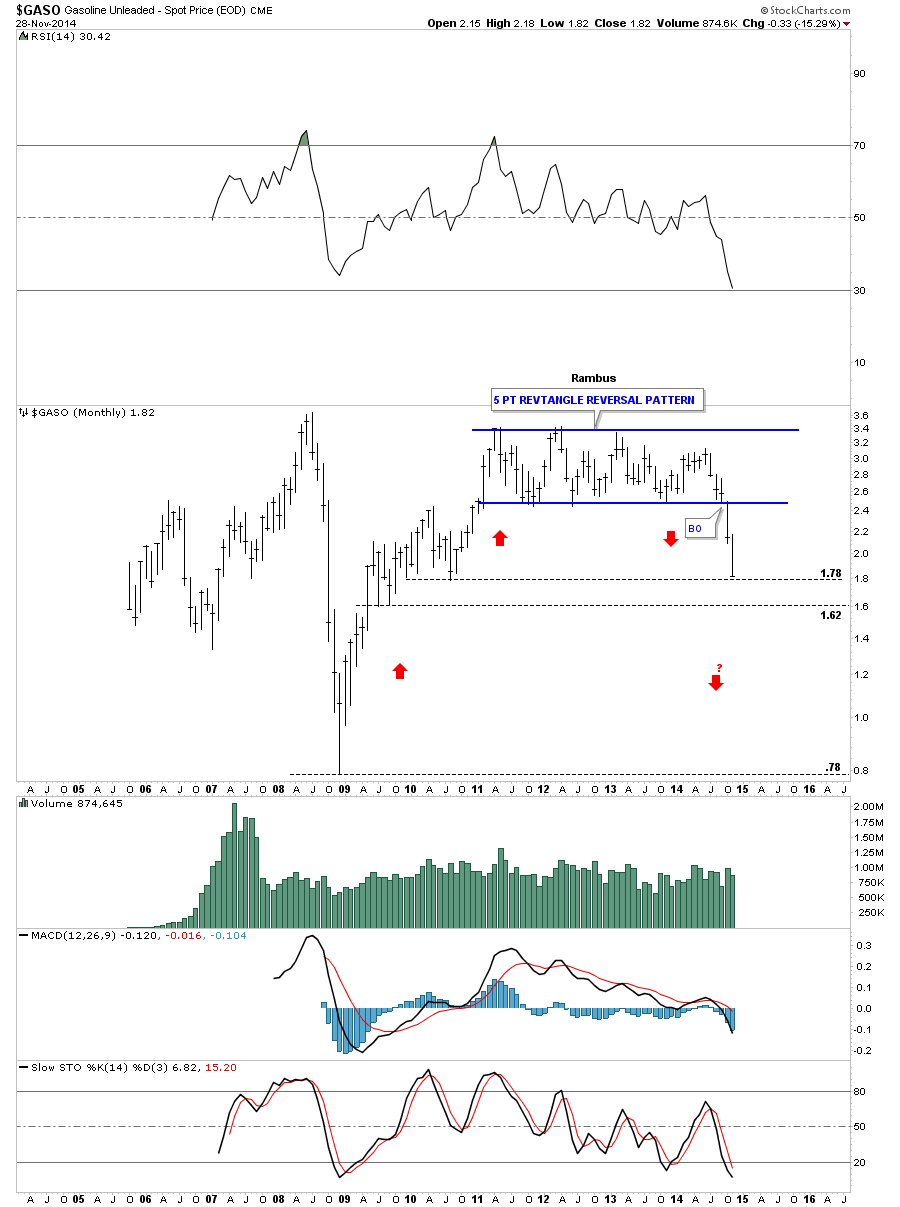
When Gaso broke out from the big five point rectangle reversal pattern I got a price objective by measuring the height of the big rectangle and added it to the breakout point that gave me a price objective down to 181 where the price action is closing in on the bottom rail. Normally this would be a place to look for a bounce of some kind maybe setting up a POP and DROP scenario. Oil will probably be our guide. If the price action gaps the bottom rail that will tell us Gaso wants to go down faster than what most expect. We’ll just have to watch the price action down at this 180 area and see how Gaso interacts with the bottom rail. Note the reverse symmetry that took place as Gaso was coming down vs how it went up in the 2010 – 2011 rally, red arrows.
I believe the Oil complex is just one piece of the puzzle that is leading to the deflationary spiral that looks like it’s already happening IMHO. When you start adding everything up and look at the long term charts for commodities and currencies, it’s happening and it’s happening right now. Many will be looking and talking about when we will see deflationary spiral begin in earnest but they won’t know it’s happening right now below their very noses. All the best…Rambus
………………………………………….
Editors Note : I note that there is gnashing of teeth all over the net regarding this Energy Move …WHO could ever have seen this coming ?
Sept 6 2014 Friday Night Charts
Oct 4 Friday Night Charts
Nov 14 Friday Night Charts
One Last Chart Notice the Date Dec 6 2012 and Especially Notice the Price Objective (PO) …NOW this is playing out 2 Years later . Patience is not for Sissies ..

I wonder if the Leaders at OPEC or Vladimir Putin read Rambus Friday Nite Charts and hedged .