This content is for Yearly and Monthly members only.
Subscribe
Subscribe
Already a member? Log in here

Note the new Category on the Sidebar
“Chartology Watch ”
Watch this space for important short term trade set ups and developing situations
currently
1….HUI Million Dollar Line
2….SLV Mother of all false Breakouts ?
3…Stock Market Developing Trade Set Up
and dont forget to choose the automatic e mail notification on the bottom of the sidebar to keep current in these wild markets
EDITOR’S NOTE :
Rambus Chartology is Primarily a Goldbug TA Site where you can watch Rambus follow the markets on a daily basis and learn a great deal of Hands on Chartology from Rambus Tutorials and Question and Answeres .
Most Members are Staunch Goldbugs who have seen Rambus in action from the 2007 to 2008 period at www.goldtent.org and now Here at Rambus Chartology since early 2012 .
To review his Work and incredible calls from the 2007-2008 period click on the top right sidebar in the “Wizard of Rambus” ….”What If !!” Post
To Follow Rambus Unique Unbiased Chart Work and participate in a Chartology Form with questions and answeres and learn the Art and Science and Mindset of a Pro Trader please Join us by subscribing monthly for $29.99 at
www.rambus1.com
We have many subscribers from all over the world who are glad they did as they enjoy the many daily updates and commentaries provided at this exciting new site
As you will see Rambus (Dave) has prepared us for this difficult period by being one of the only ones to see and warn about this incredibly debilitating PM smackdown as early as Jan 2 2012 …click on the” HUI Diamond in the Rough” Post in the “Wizard of Rambus” top right
You will find Rambus to be a calm humble down home country tutor with an incredible repitoir of all the TA based protocols tempered with his own one of a kind style…simply put…He wants to keep his subscribers on the right side of these crazy volitile and downright dangerous markets
See you at the Rambus Chartology
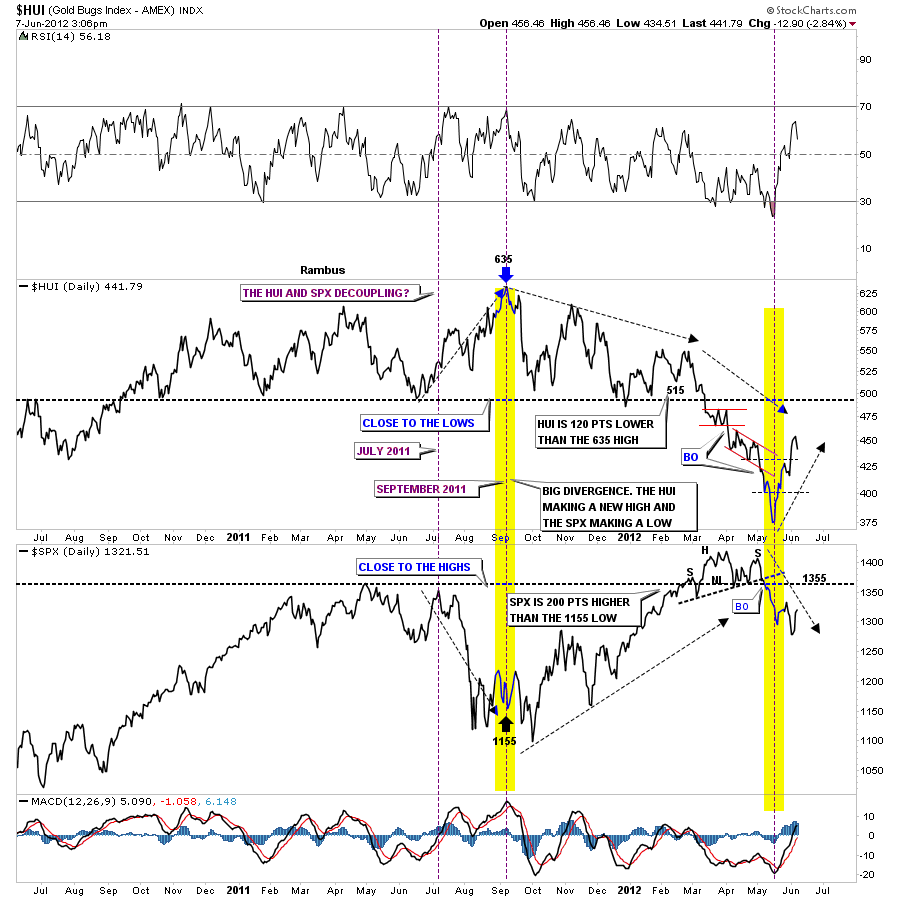
The first chart I want to show is the divergence chart that compares the HUI to the SPX. You can see the divergence is taking place over the last 3 weeks or so, yellow vertical zone. Today the SPX is up and the HUI is down. If the Dow rallies up to the 12,650 area, that I showed on the last post, we could see some weakness in the HUI and at that point is where things will get interesting for the HUI and PM stocks in general. If the negative correlation continues to play out and the stock markets top out over the next few days or so the PM stocks maybe bottoming out. Its something I’ve been watching very close.
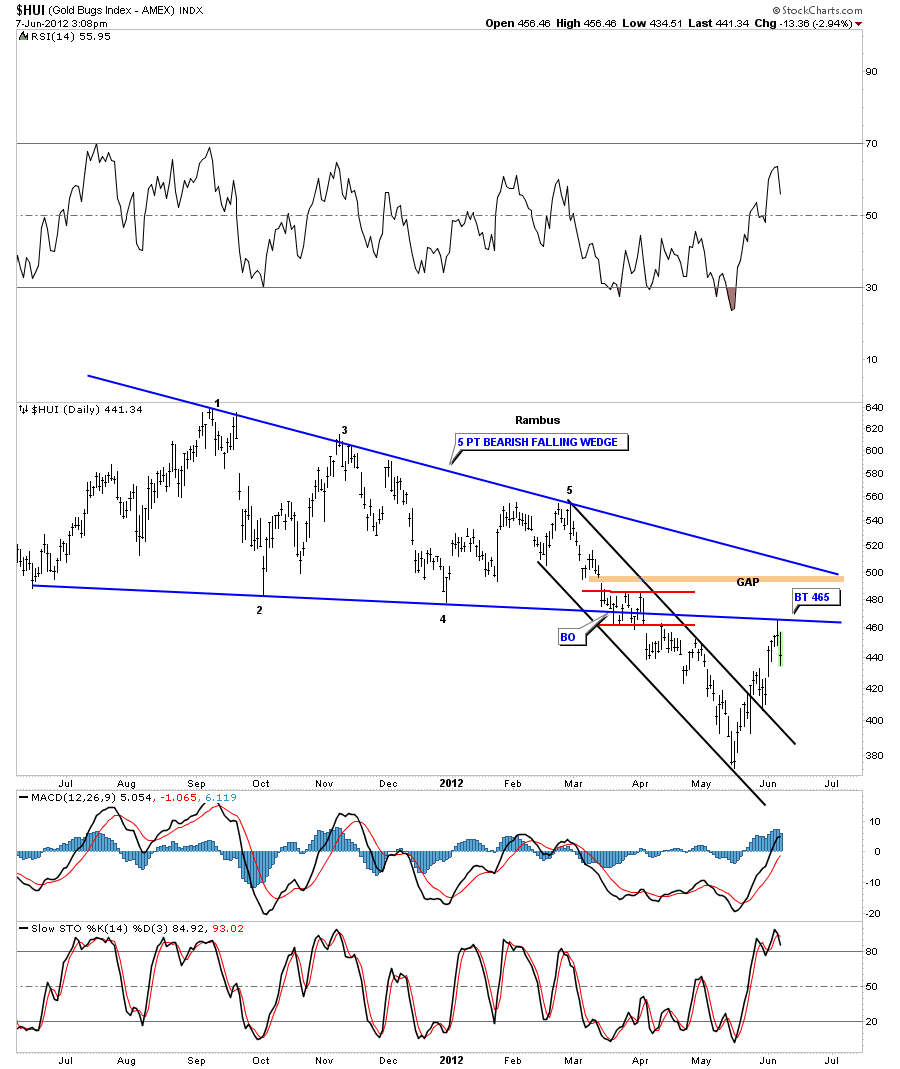
The next chart is a daily bar chart that shows a 5 point bearish falling wedge that had a beautiful backtest yesterday to the bottom rail. This tells us the bottom blue rail is hot and to pay close attention on how the price action interacts with it.
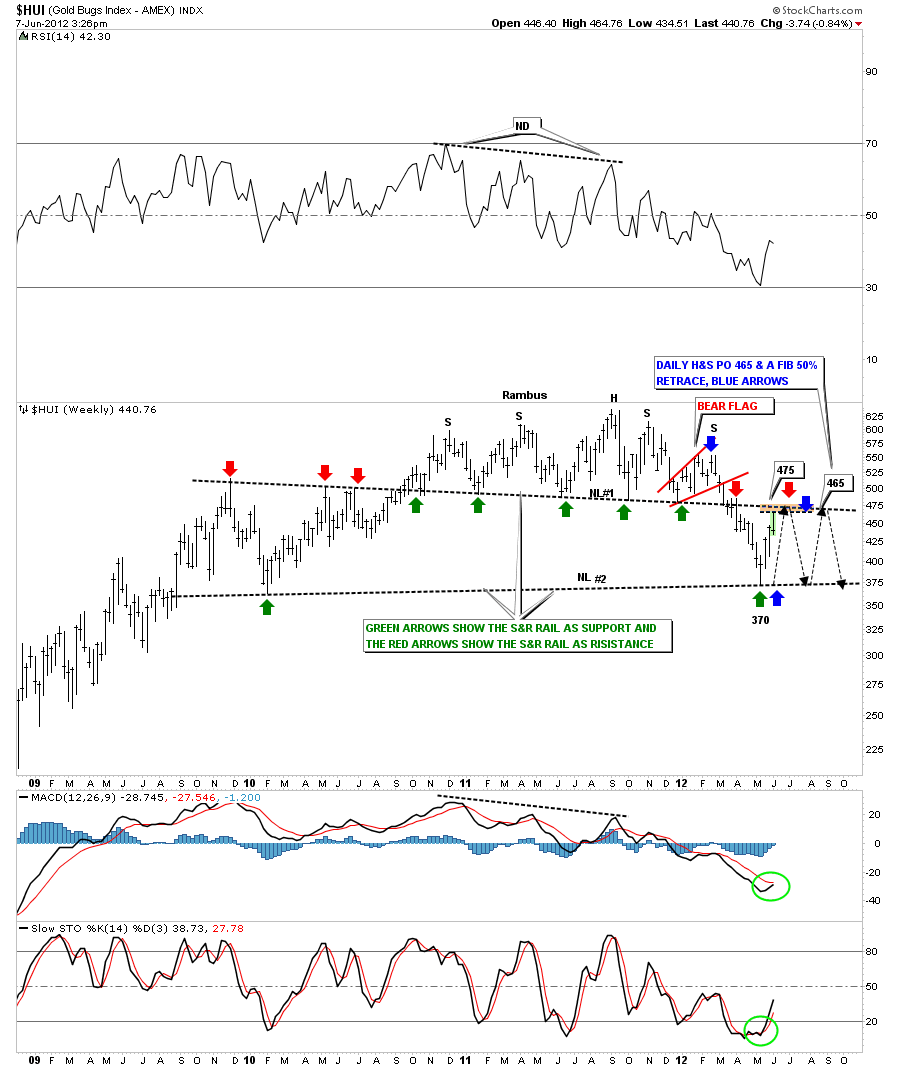
The next chart is a weekly look that shows the big H&S top pattern with the backtest to the neckline yesterday at 465. That’s a million dollar neckline. If the HUI can ever trade above it, that would be showing much strength that would suggest a strong move up for the PM stocks. On the other hand as long as it holds resistance the PM stocks will not be able to rally any higher than this current move higher. I also put on a possible trading range if the HUI stalls out right here, between neckline # 1 and neckline #2.
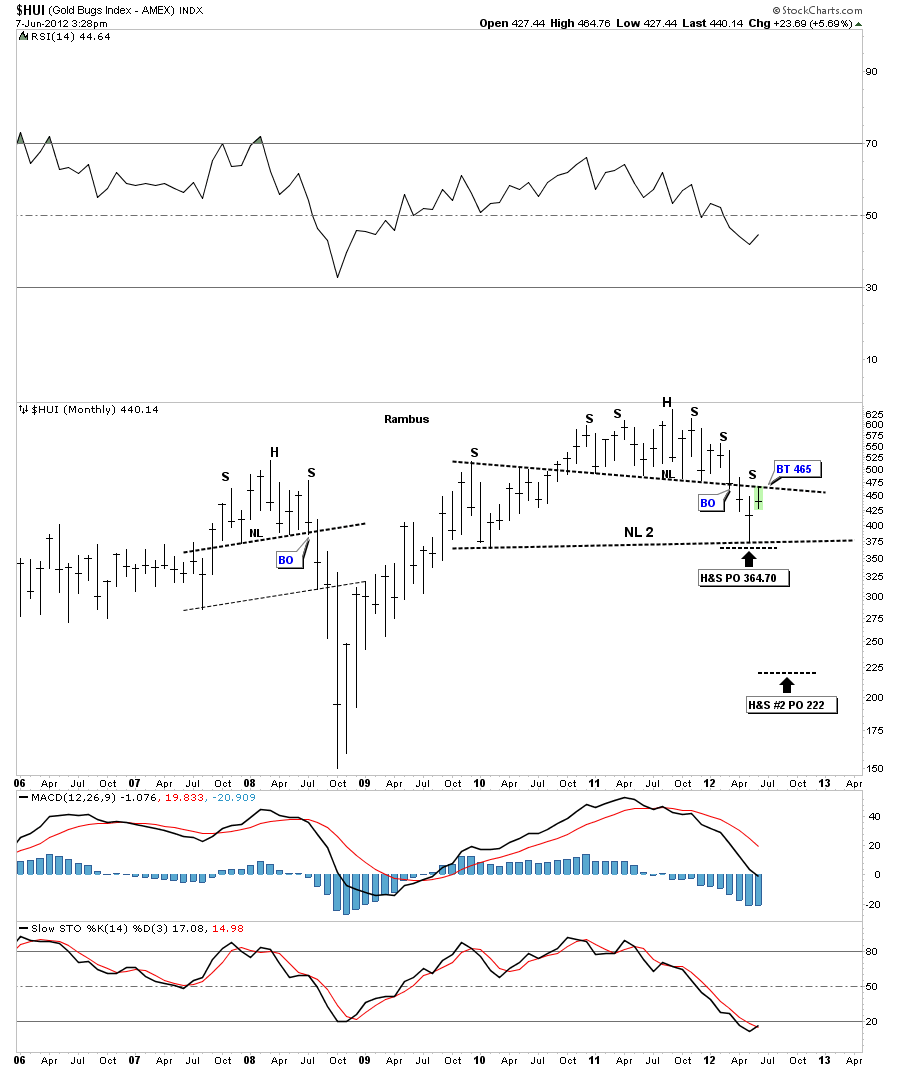
I want to show you one more chart that is a monthly look. Its easy to see how the neckline is working as support and resistance. Above it has acted as support and below it has acted as resistance so far.
The bottom line is how is the HUI going to act if the Dow tops out at 12,650? Will it rally up and break through the neckline? How long will the negative divergence last? We’re definitely at a critical area right here where anything can happen quickly.
I’ve been working on the PM stocks and if the HUI can take out the neckline to the upside I’ll be ready to post a model portfolio. So lets see what happens over the next day or two and take it from there.
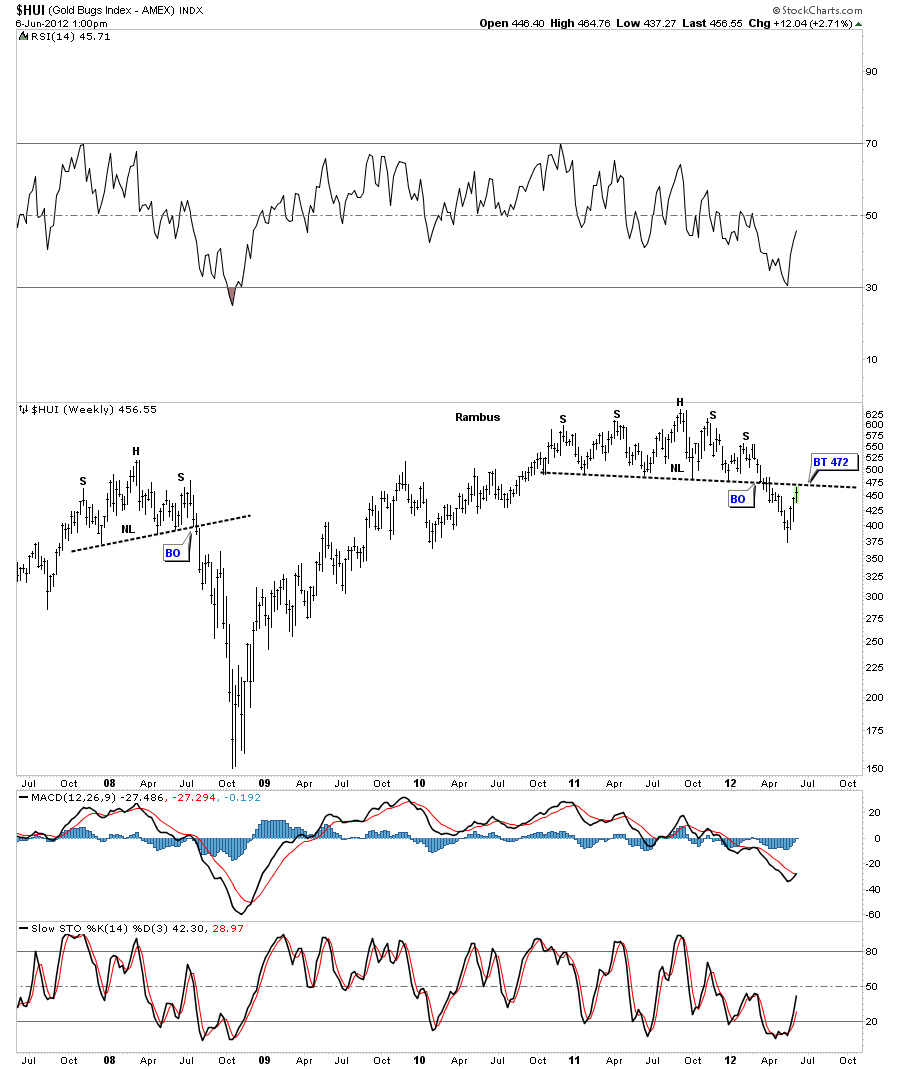
All the precious metals stock indexes are starting to reach into there respective resistance zones from the big H&S top patterns. The HUI touched the lower end of resistance at 465 this morning. The top end of the resistance zone comes in around the 480 area.
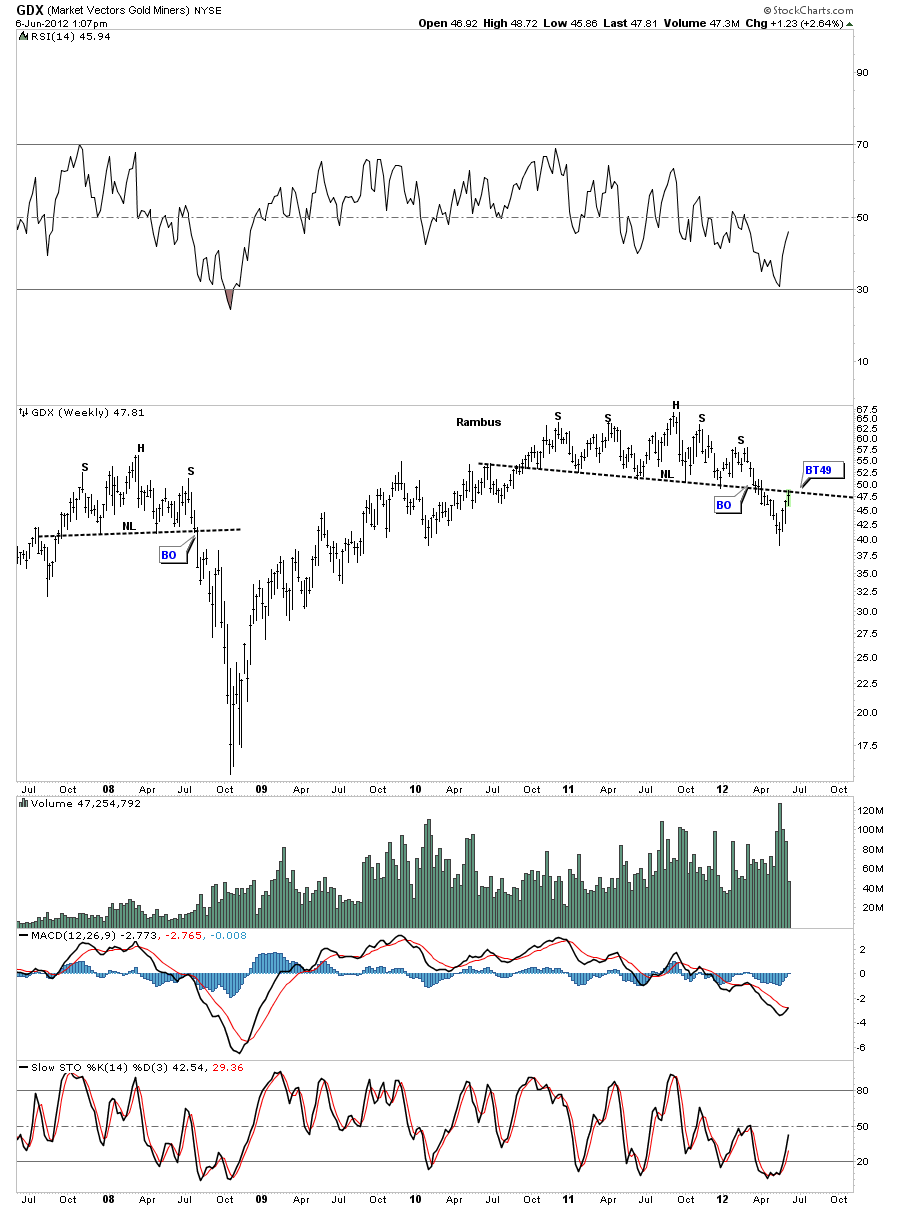
GDX is also approaching its neckline around the 49 area.
The XAU is approaching it’s resistance area in the 172 area, brown zone on chart below.
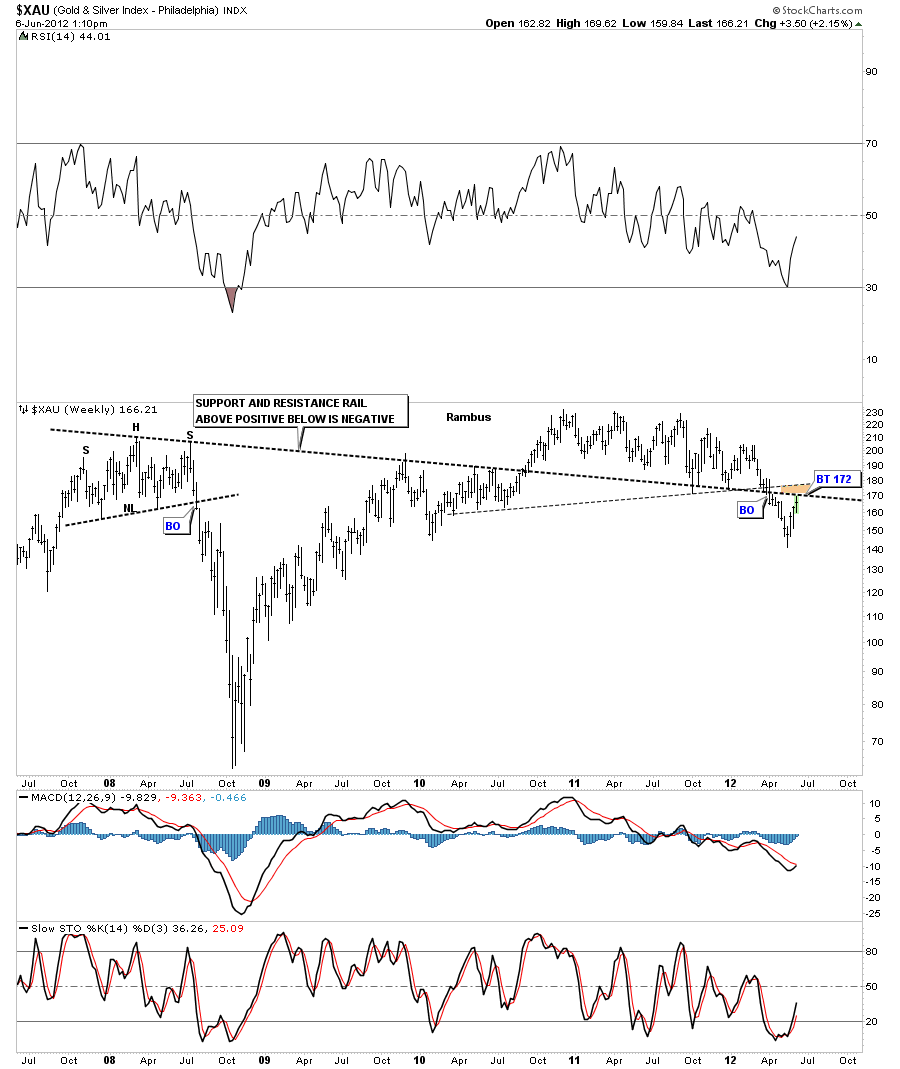
If this precious metals stocks rally is for real then these critically important resistance rails will be taken out to the upside. For right now, sitting on the sideline and observing the price action, seems like the prudent thing to do. You can call this area an inflection point as this area will determine the next move for the precious metals stocks. If it fails then we go back down and if the PM stocks show some serious strength in here and break back above the resistance rails that would be very positive. There is nothing wrong with having a big cash position at this juncture to deploy when we get alittle more clarity.