AAPL Top is in..

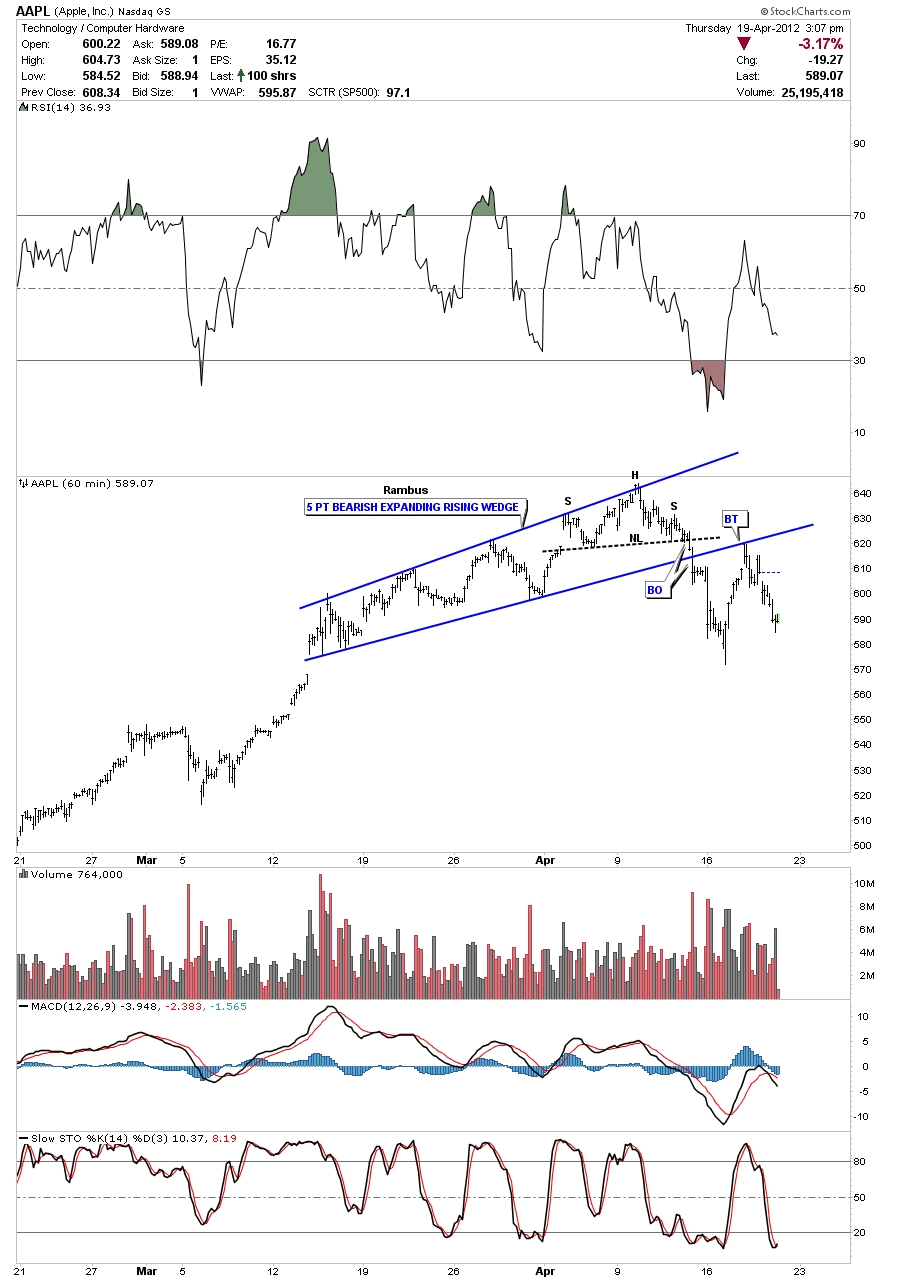
Below is a 60 minute chart I’ve been tracking Apple Computer with. After putting in a small H&S top pattern AAPL then went on to break the bottom blue rail of the 5 point bearish expanding rising wedge. You can see the initial break was pretty hard. The backtest to the bottom blue rail of the expanding rising wedge was spot on. So now all the work is done with the breakout and backtesting. As it was a parabolic move up the chances are real good that the move down will be just as fast if not faster than the move up.
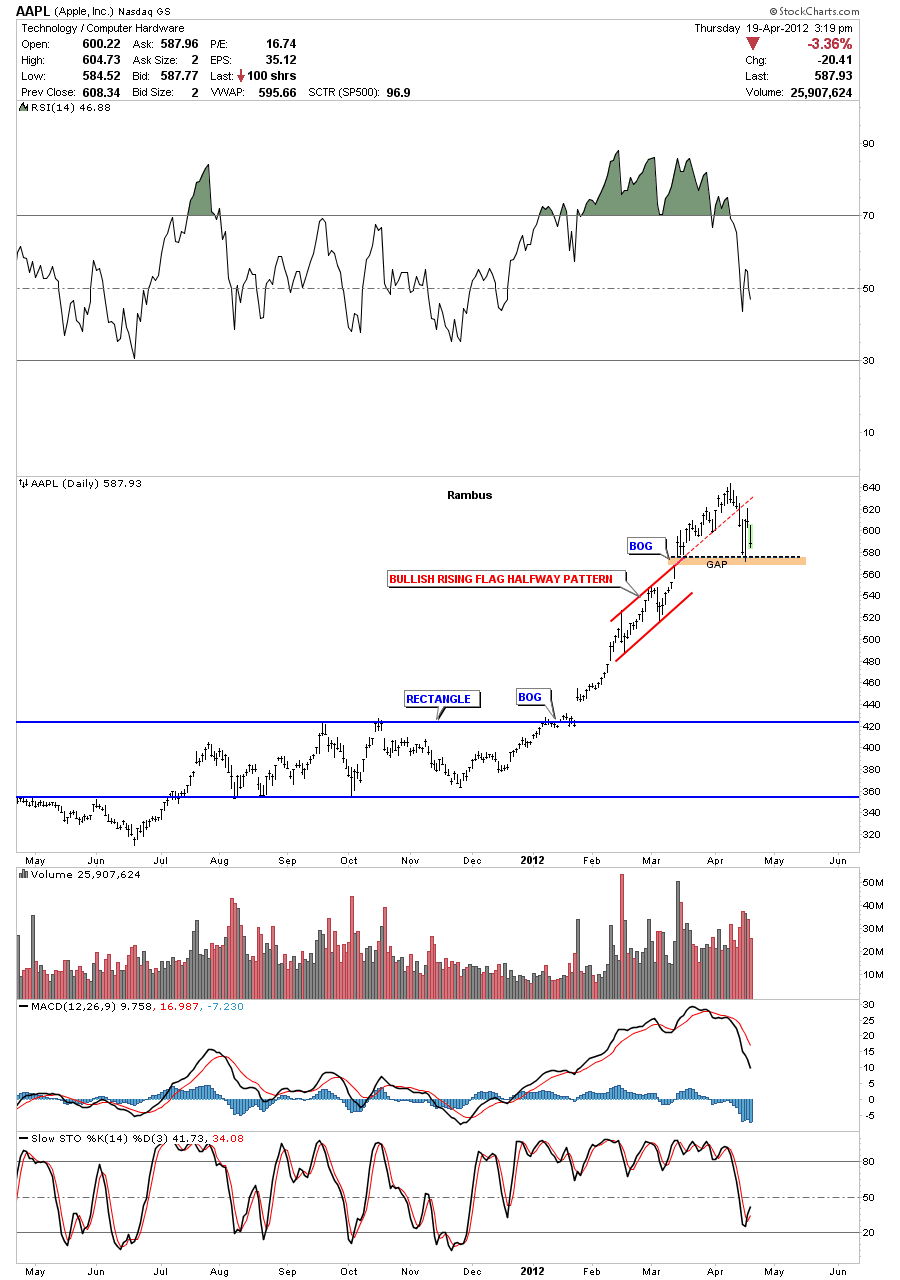
The daily chart for Apple Computer shows a big gap just below the most recent low. A close below that gap will help insure the top is in.
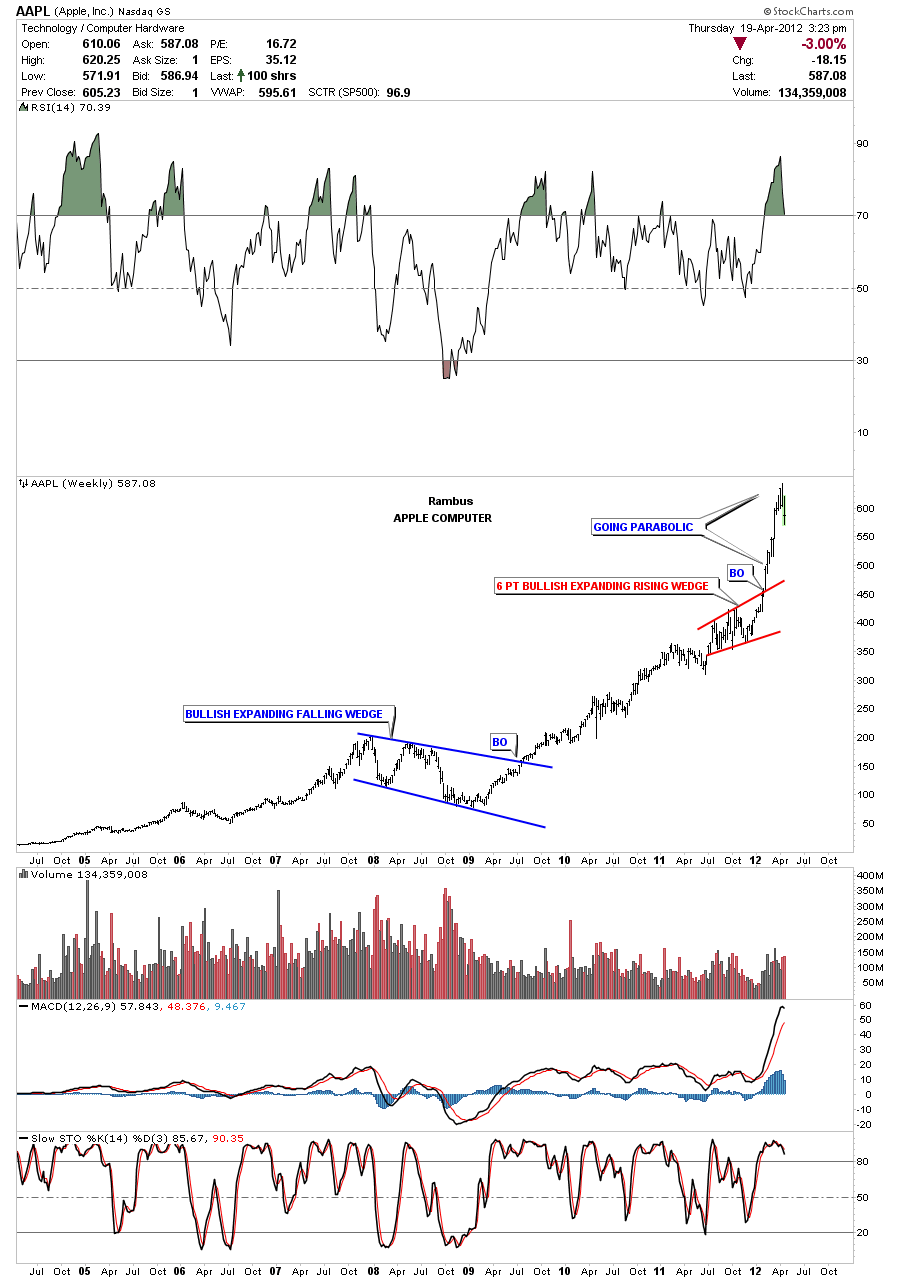
The weekly chart shows the near vertical move Apple made once it broke out from the 6 point bullish expanding rising wedge.
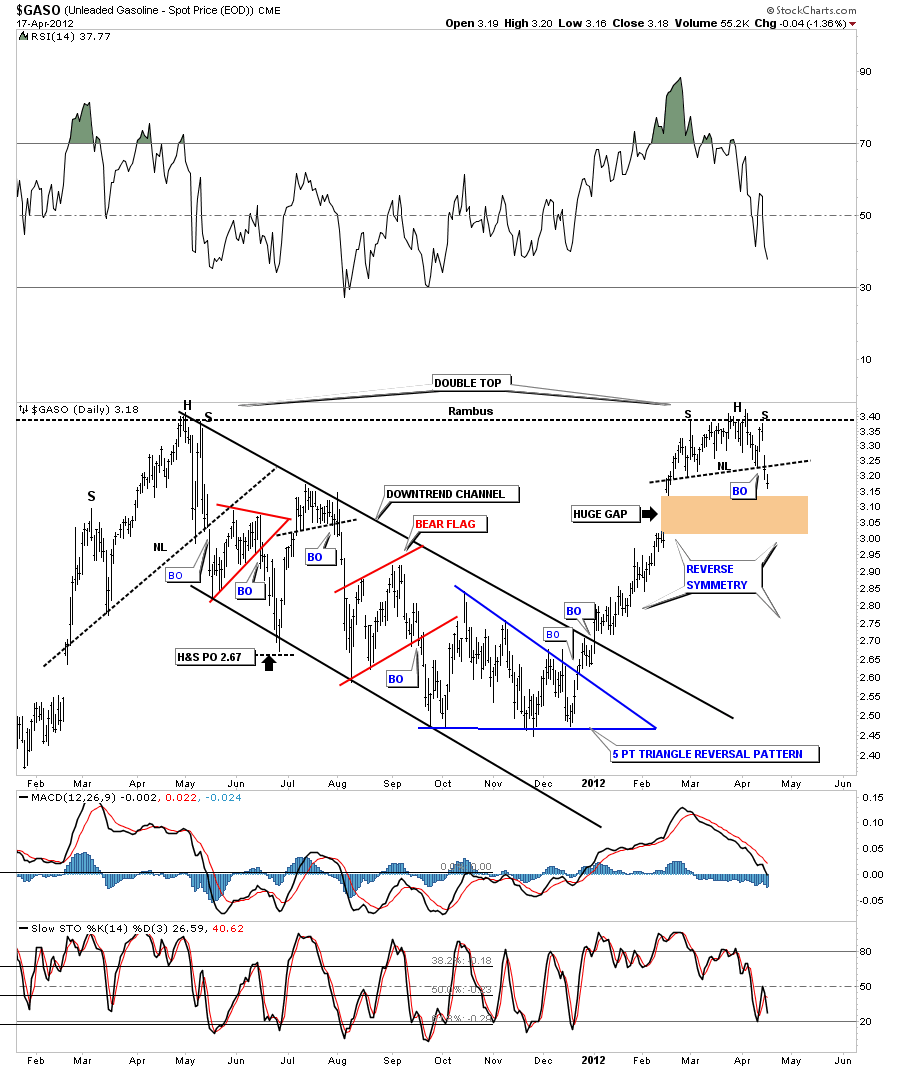
GASO Update

Last week I posted a chart on gasoline that showed we could be in a topping pattern, as part of the risk off trade. After putting in a right shoulder last week gasoline broke the neckline on Monday. There is also a much bigger pattern in play here as well and that is the big double top. The previous top was made just over a year ago last May. There is a good chance that the price of gasoline could fall pretty fast as the rally leading into this most recent top didn’t form much in the way of any consolidation patterns. So when the price starts to move down there aren’t many shelves of support to help stem the decline. I call this reverse symmetry. How it went up is probably how it will come down. Also notice the huge gap just below the neckline. This is an important chart for the risk off trade IMHO.

PCLN Update….

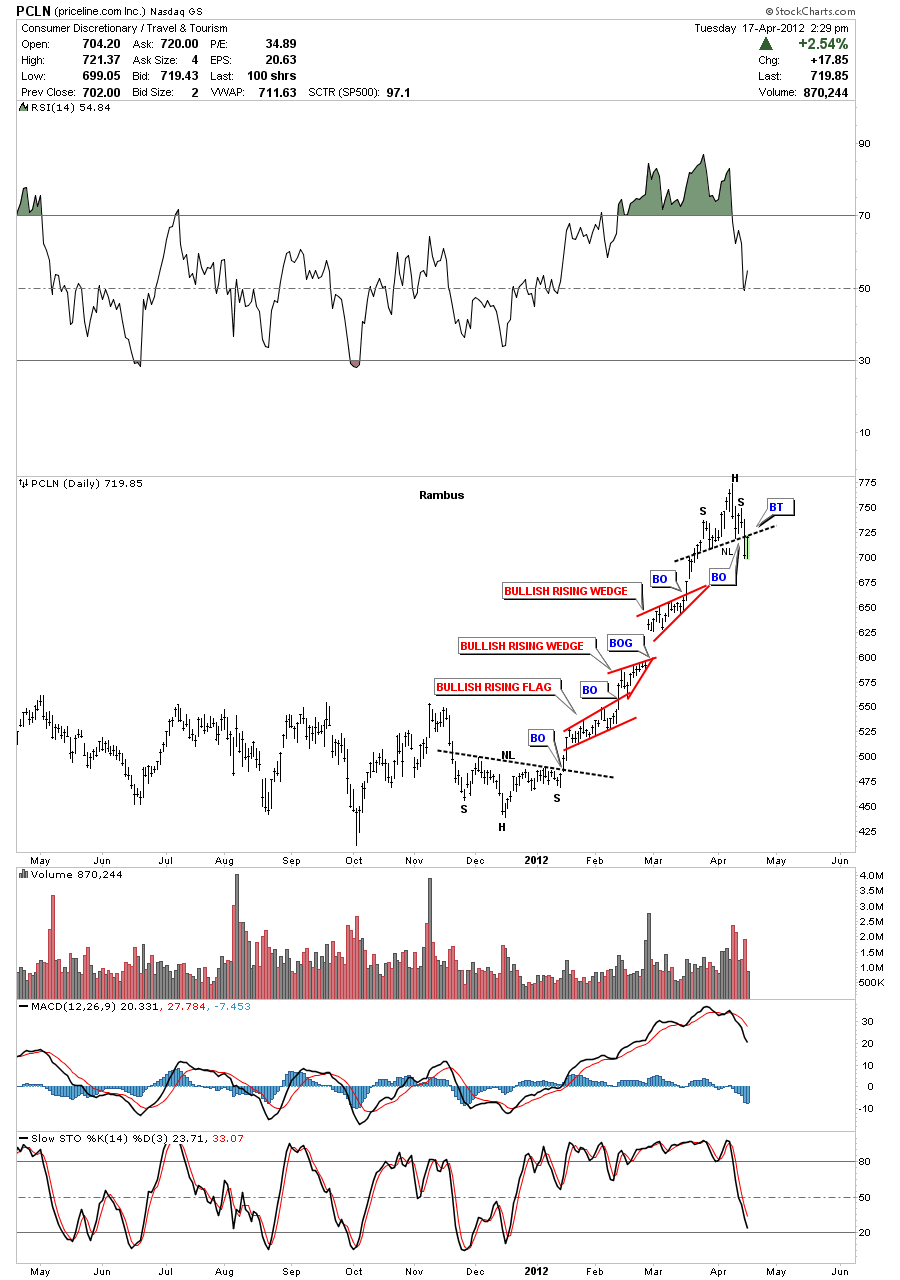
Its the moment of truth for PCLN as it’s now doing the backtest to the neckline. This is a low risk entry point if one wanted to buy some put options using the neckline as your line in the sand.