Tonight I would like to update the Basic Materials sector as this area now looks like it’s ready to resume its bull market. Also with the stock markets breaking out today, especially the INDU, this adds another layer of confirmation that the breakout is the real deal. As we’ve discussed previously there are many big cap Dow stocks that make up the XLB, Basic Materials fund, and with the INDU making a new all time high today there will be some individual components making new all time highs as well.
Lets start by looking at a weekly chart for the XLB, Basic Materials fund, that is breaking out of a bullish rising flag this week. This bull flag has been building out since last spring and now the price action is trading into new all time highs. There was a conventional bull flag that formed between 2015 and 2016 that sloped down. That down sloping black flag started to form after the 7 point bearish rising wedge completed.

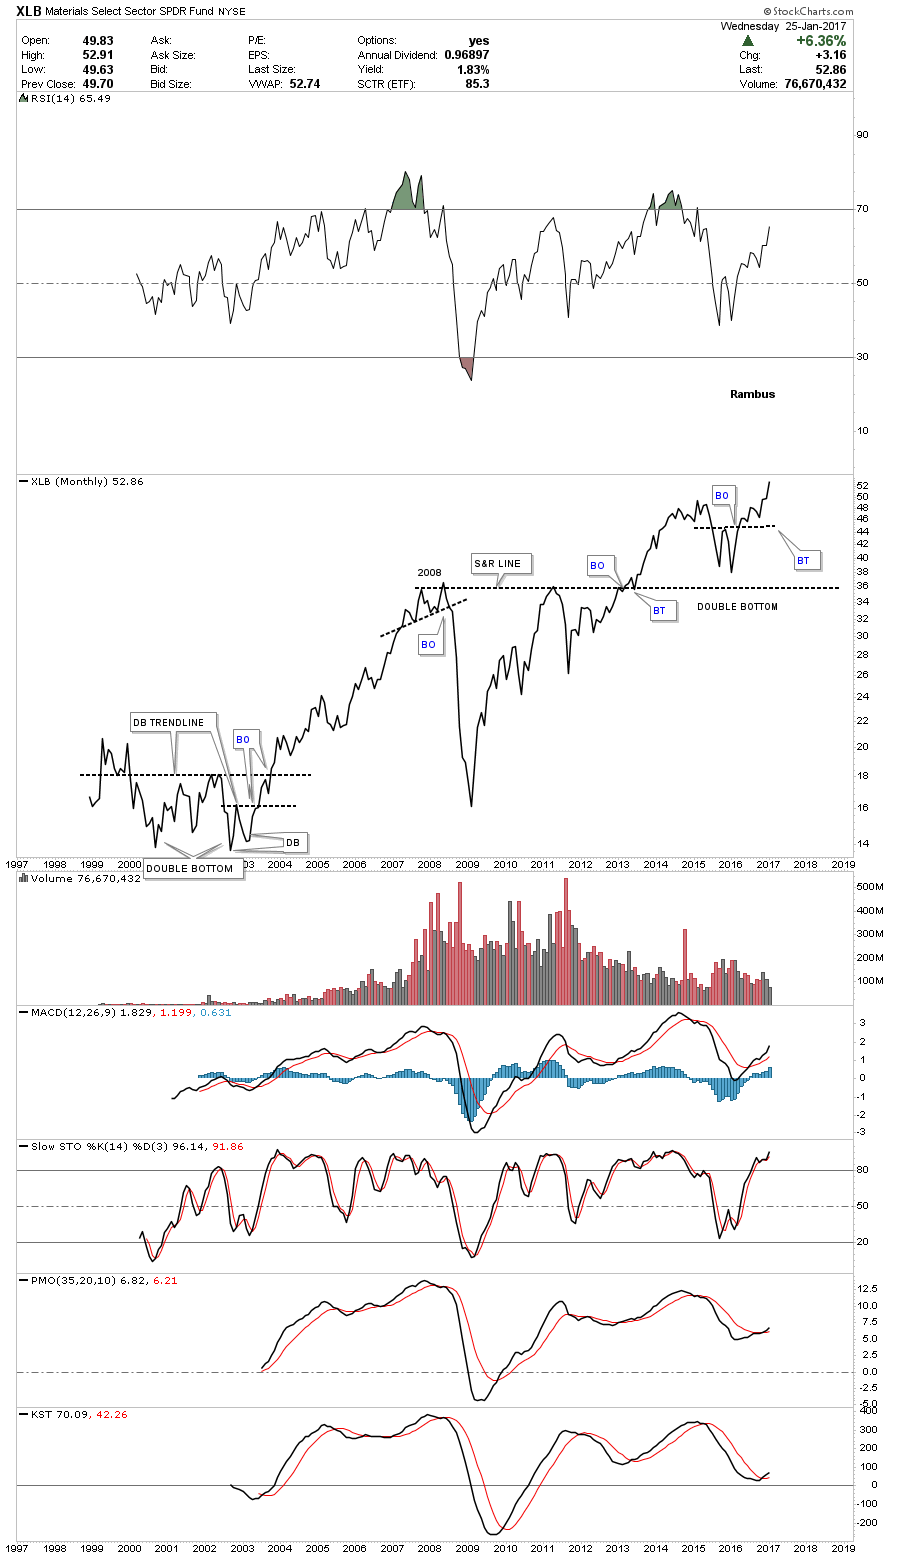
This 20 year monthly line chart shows the entire history for the XLB. In 2015 this basic materials fund built out a double bottom which launched the recent impulse move up. That double bottom formed right on top of the multi year support and resistance line.There was a bigger double bottom that formed back in the early 2000’s which launched the bull market.
There is one last point I would like to make on this monthly line chart which compares the 2008 top to the current price action. As you can see the XLB is considerably higher than the 2008 top. If you compare this chart to the HUI, the HUI is still a long ways off from breaking out to a new all time high.
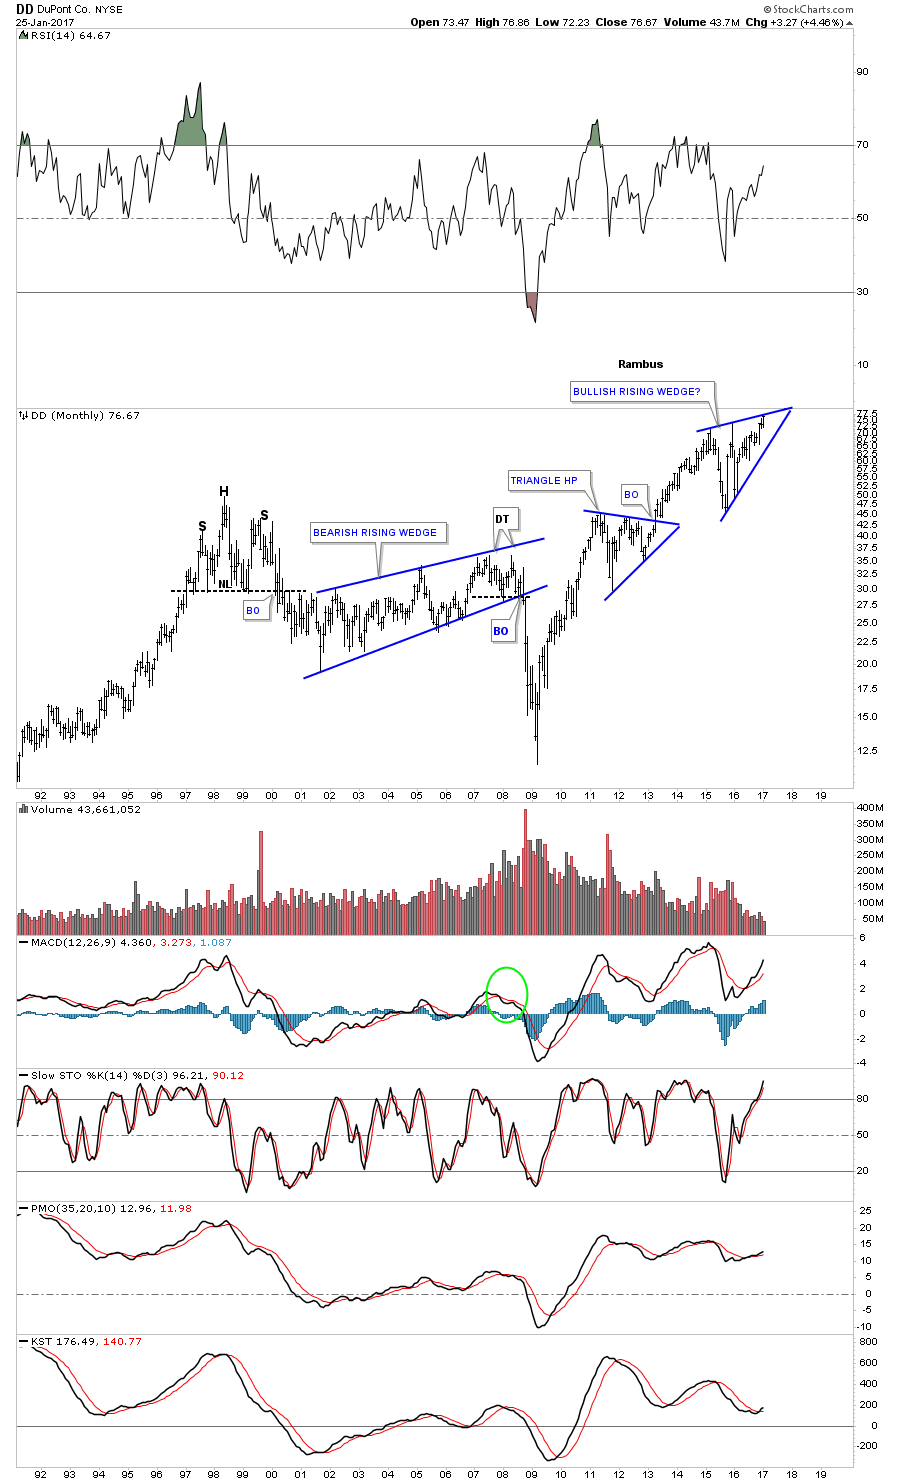
Now lets look at some big cap basic materials stocks that help make up the INDU. This first chart is a monthly look at DD, DuPont, which is trading at a new all time high but still hasn’t broken out above the top rail of it blue expanding triangle. When it does this stock will add a lot of fuel to the INDU’s bull market.
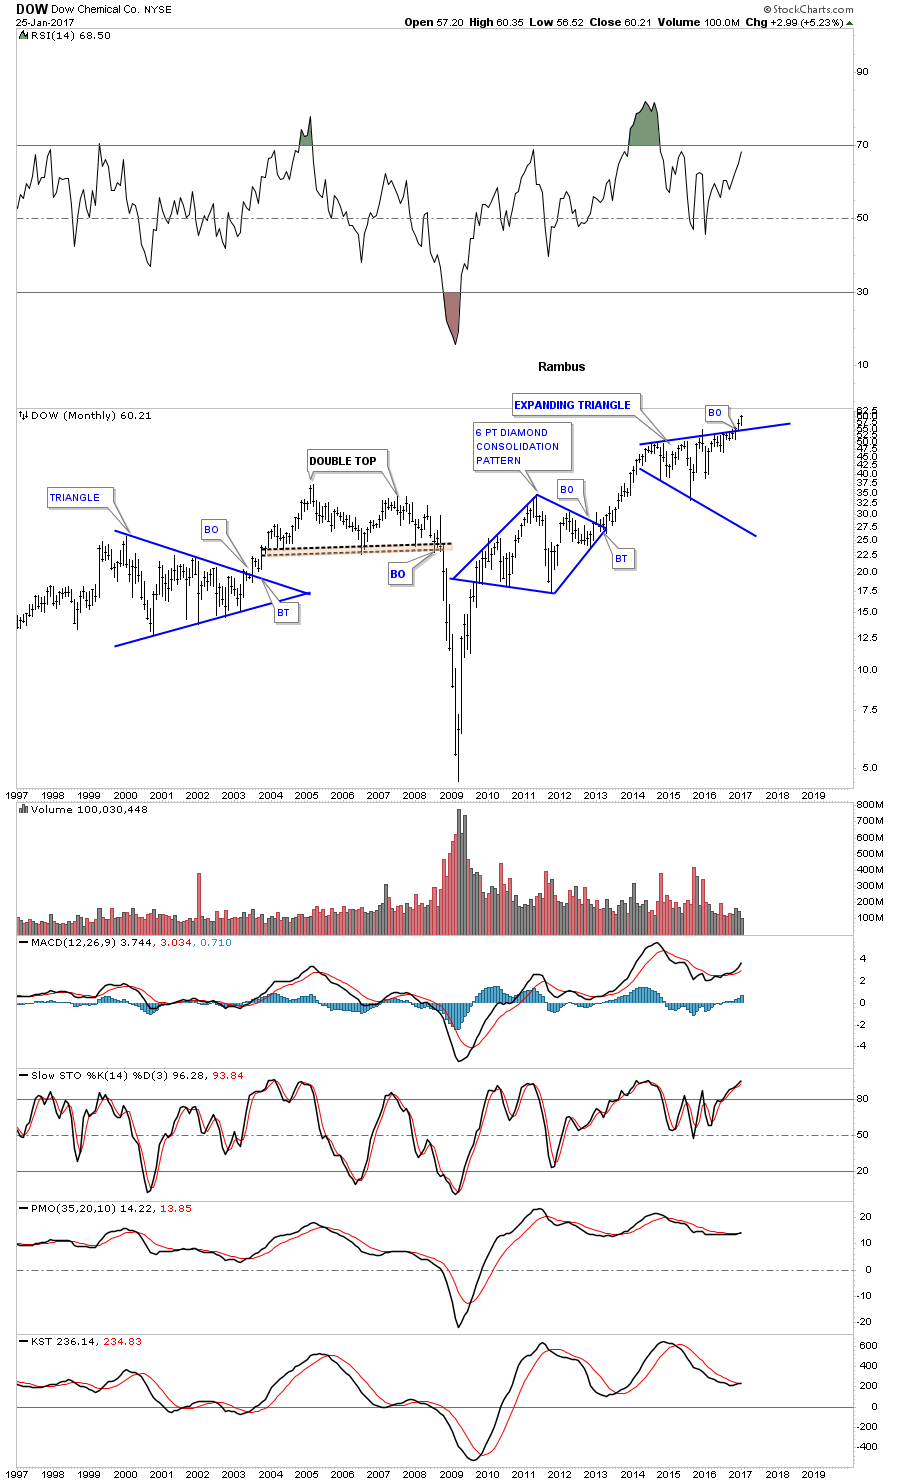
Below is a 20 year chart for DOW, Dow Chemical, which broke out topside of its blue expanding triangle consolidation pattern and is hitting new all time highs.
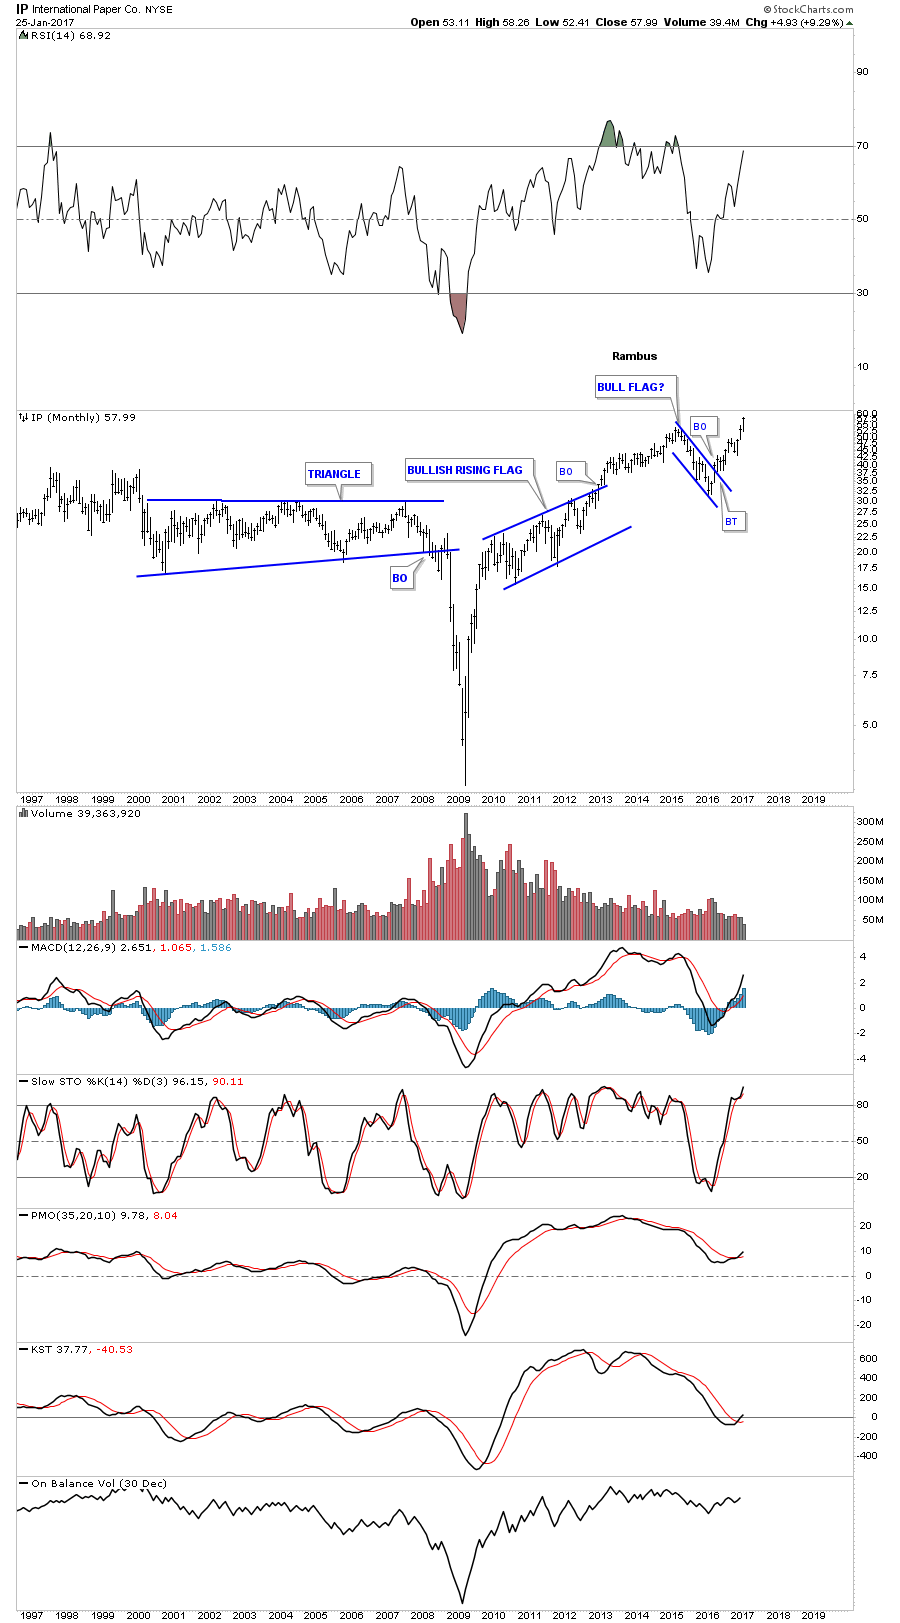
This next chart is a monthly look at IP, International Paper, which is also trading into new all time highs.
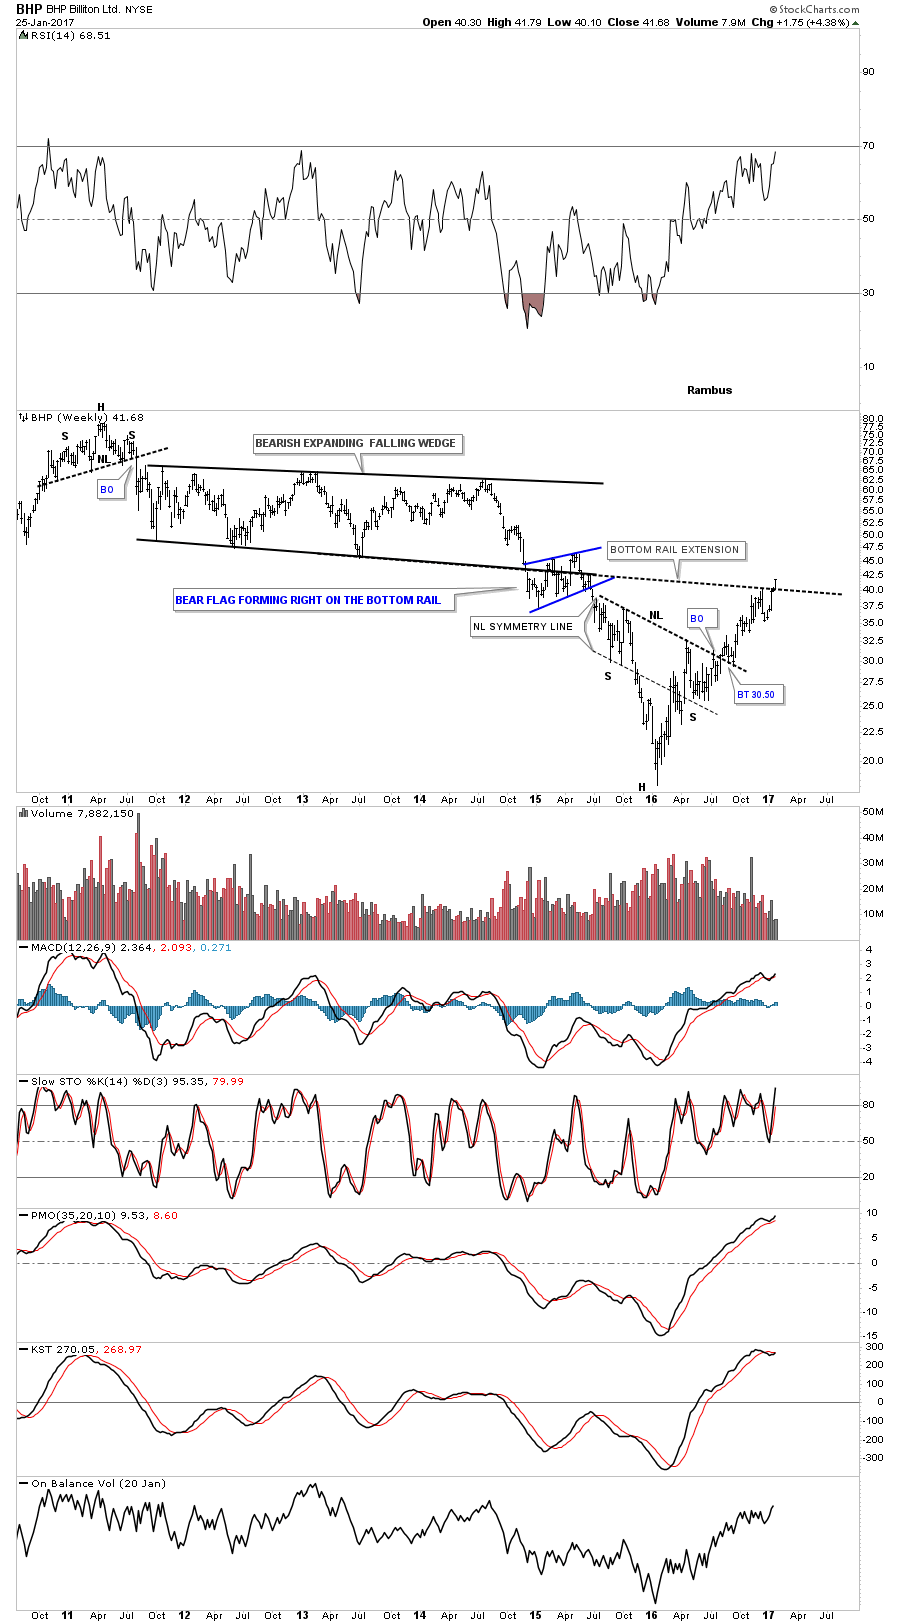
Lets look at some other basic materials stocks that have been showing some strength recently. Last fall I posted this chart for BHP, which was starting to breakout above the neckline of a strongly slanted inverse H&S bottom. This week the price action is trading above the bottom rail extension line taken from the bearish expanding falling wedge.
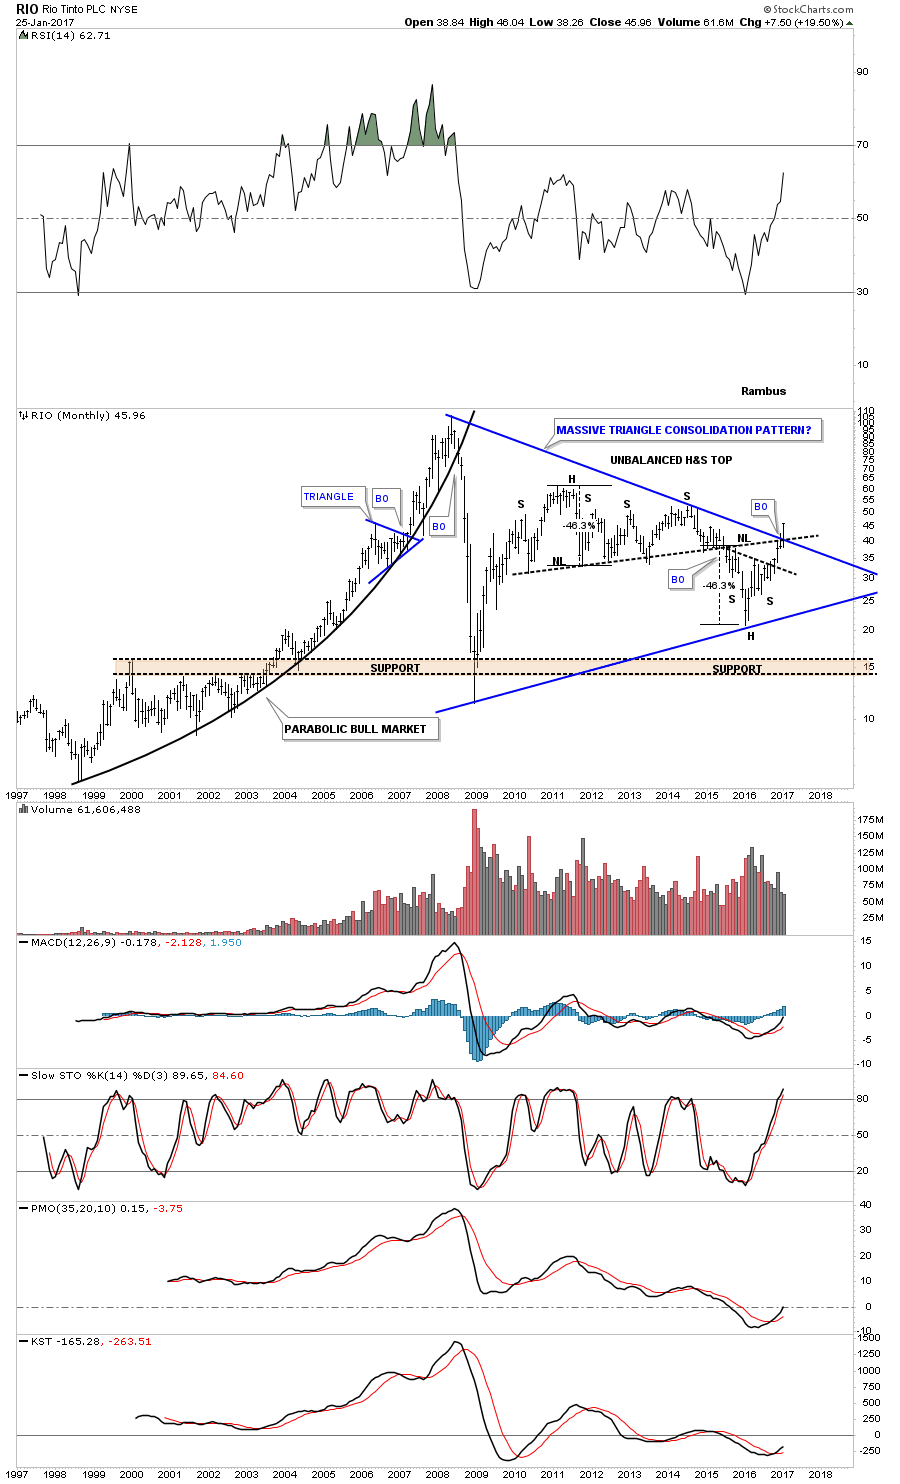
Another big mining company is RIO which is taking out some overhead resistance this month. Note the breakout from the nearly 9 year blue triangle consolidation pattern and the the old neckline from the unbalanced H&S top. The bulls are starting to take control.
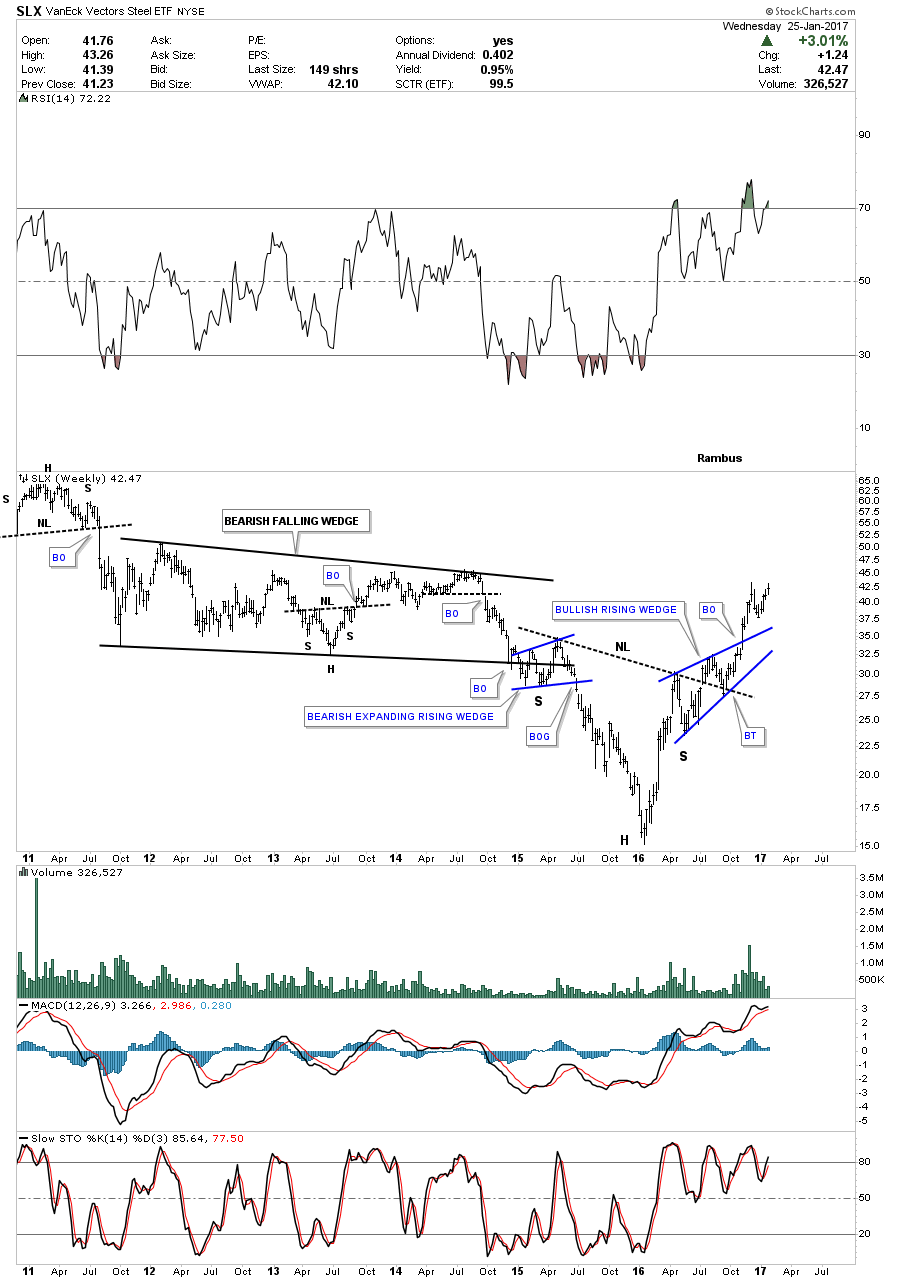
The steel stocks have been doing very well over the last year or so and have been one of the stronger areas in the basic materials sector. Below is the SLX, steel etf, which built out an inverse H&S bottom. Note the two smaller blue consolidation patterns that make up the blue bullish rising wedge separated by the neckline which is usually a bullish setup.
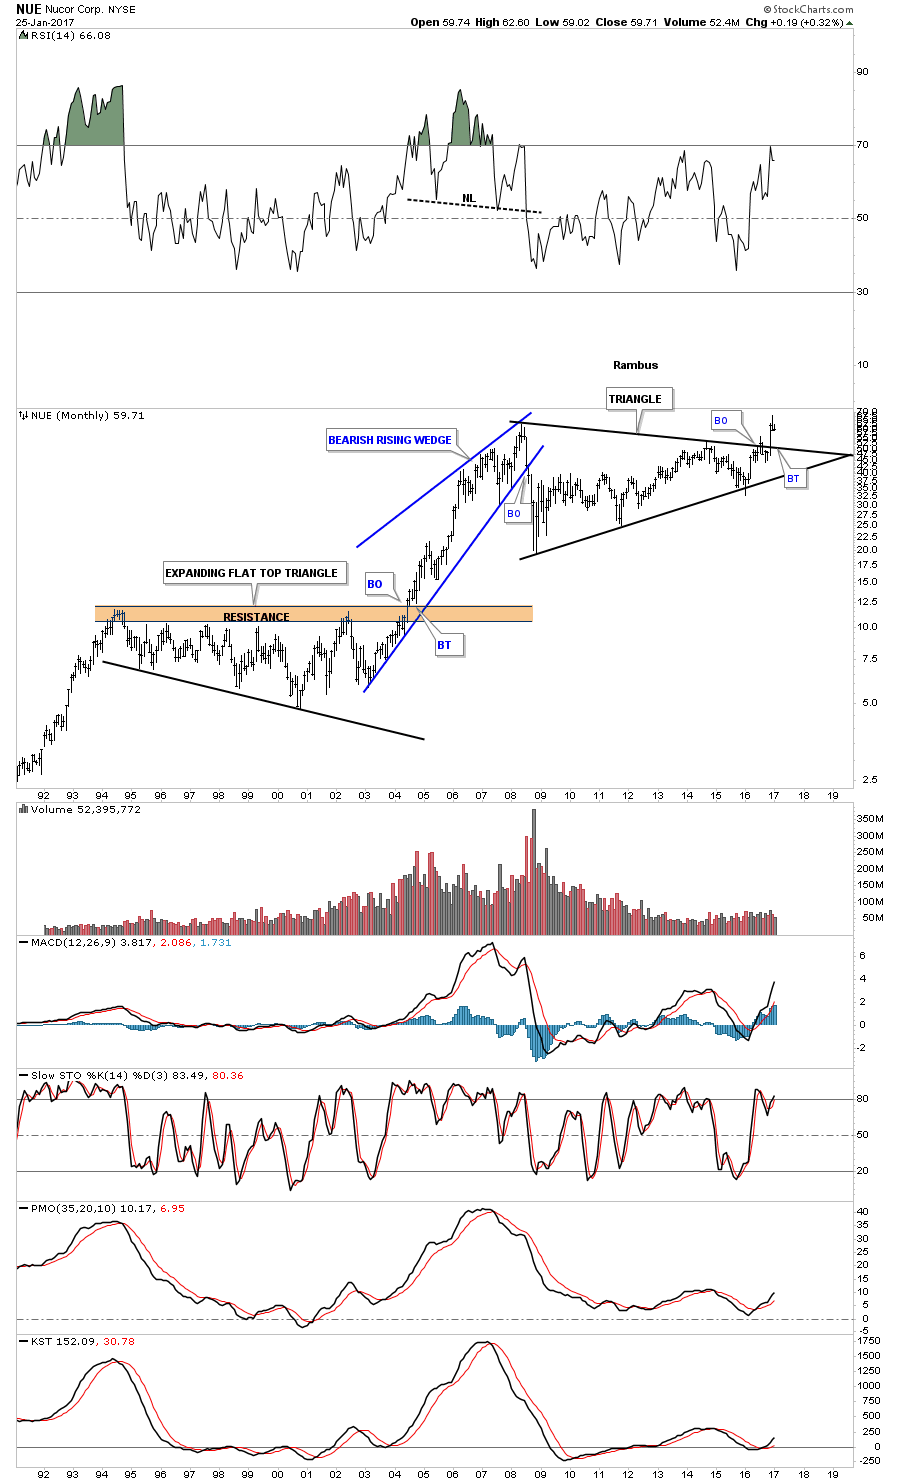
In November of last year NUE, steel company, broke out of a massive triangle consolidation pattern and is currently in backtest mode.
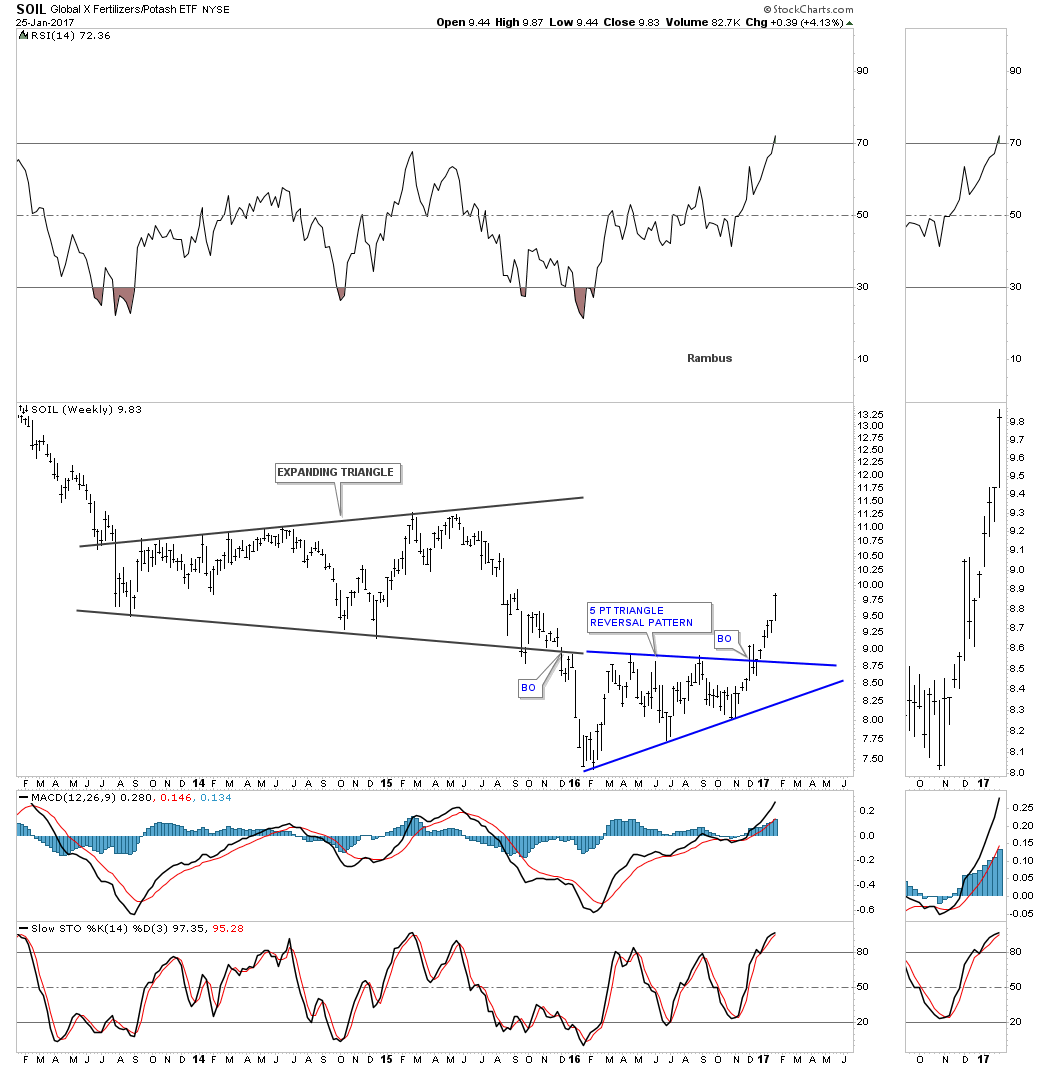
SOIL is a fertilizer company that just broke out from a blue 5 point triangle reversal pattern.
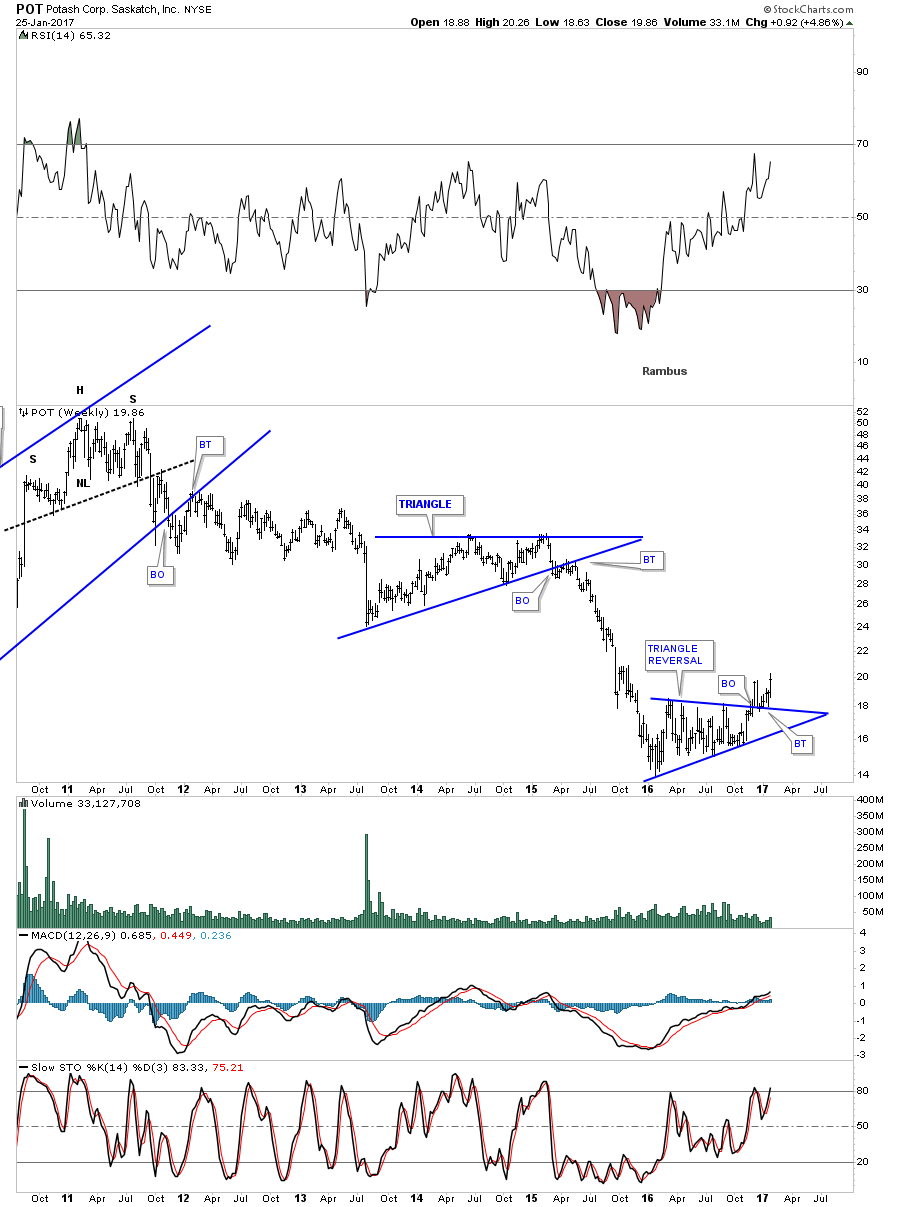
POT is another fertilizer company that is also breaking out from a 5 point triangle reversal pattern.
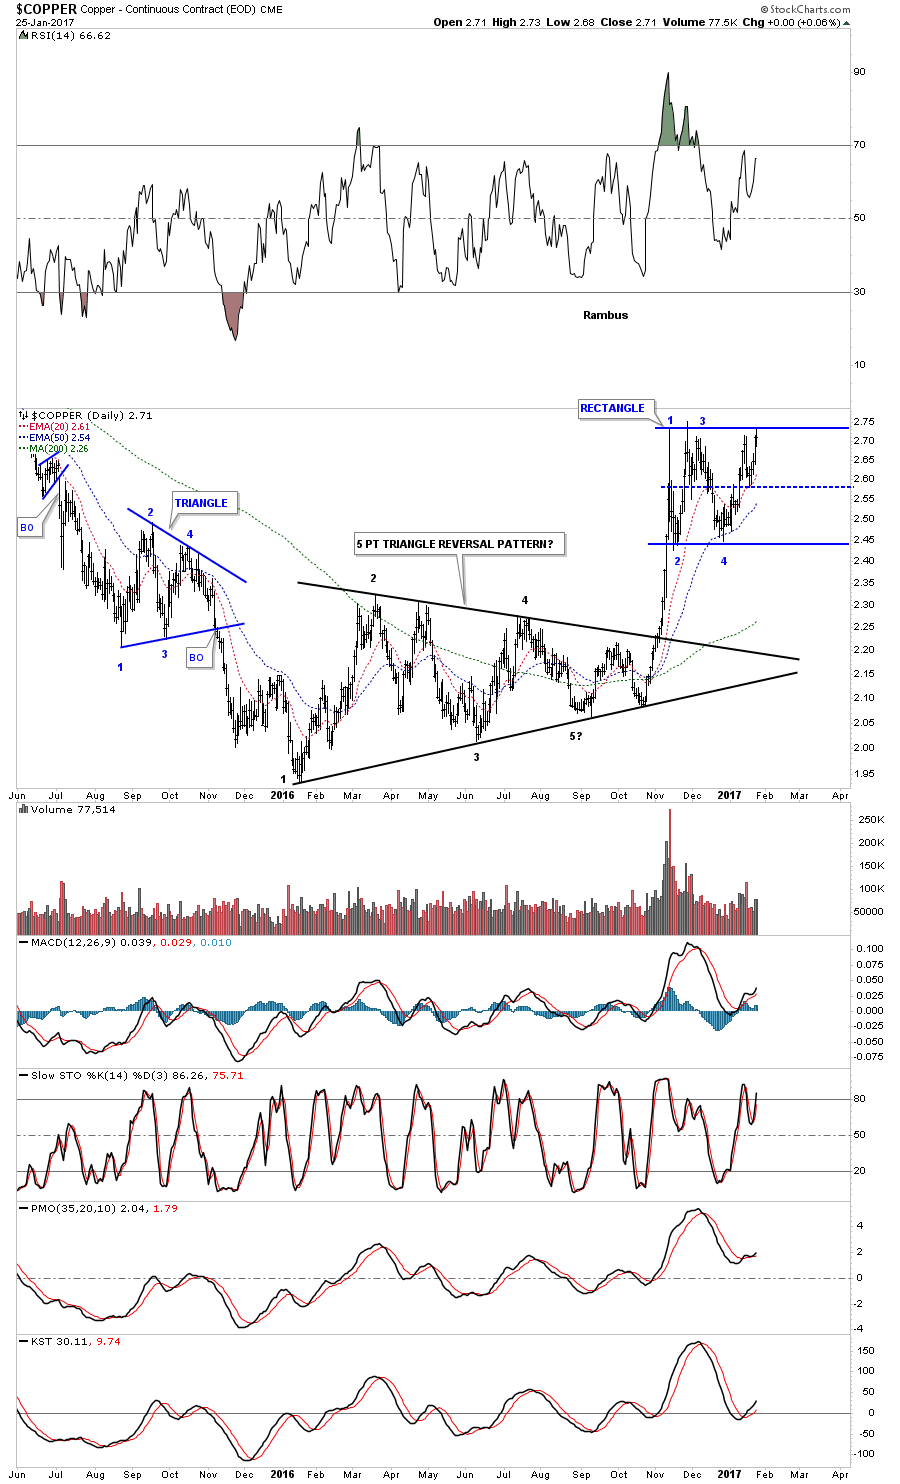
After breaking out of an almost 1 year black triangle reversal pattern Copper has been chopping out a blue rectangle trading range. Many times during the formation of a rectangle consolidation pattern, after the 4th reversal point is in place, there can be one more small decline which will take the price action down only to the center mid dashed line before the breakout occurs. That just happened over the last week or so.
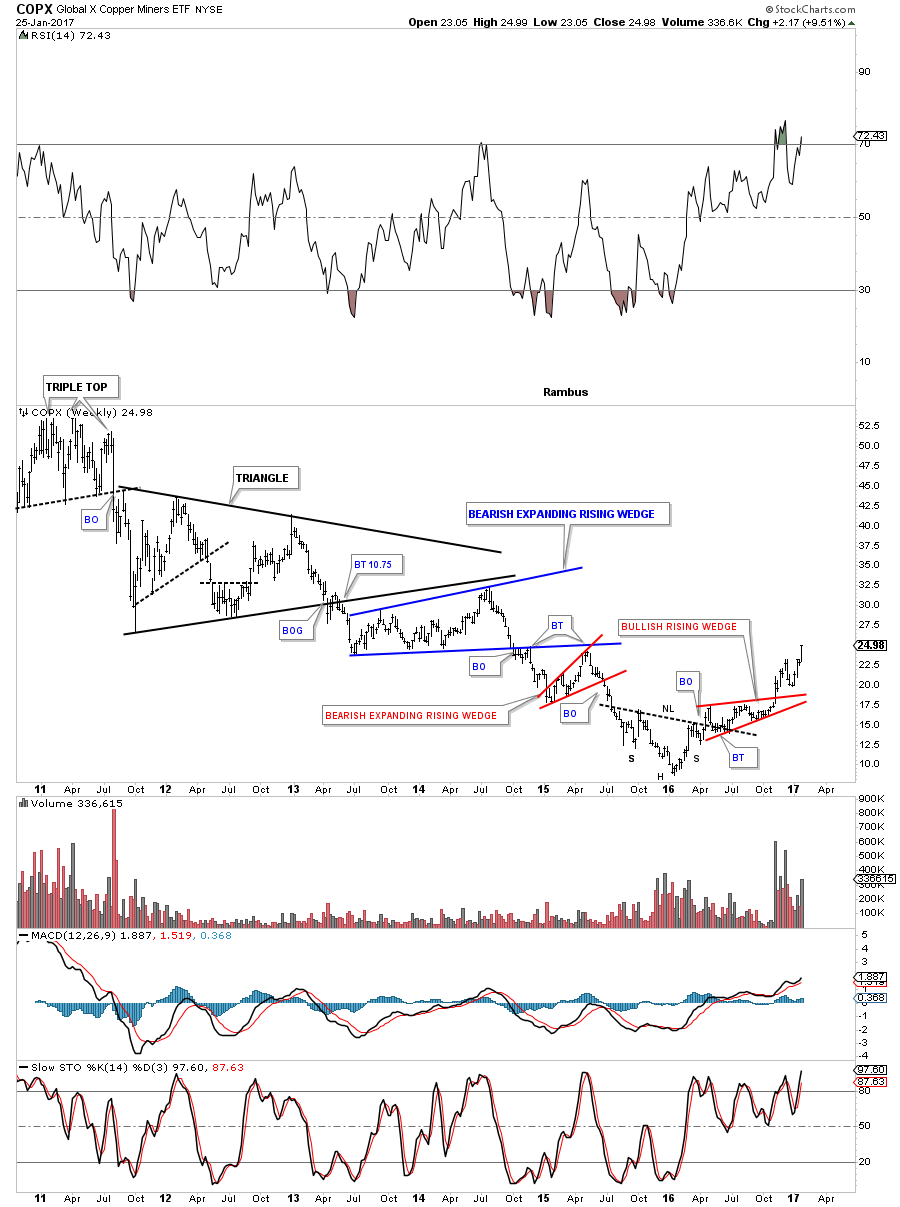
COPX is a Copper Miners etf which formed an inverse H&S bottom with the red bullish rising wedge as the backtest. It’s currently making a new 2 year high.
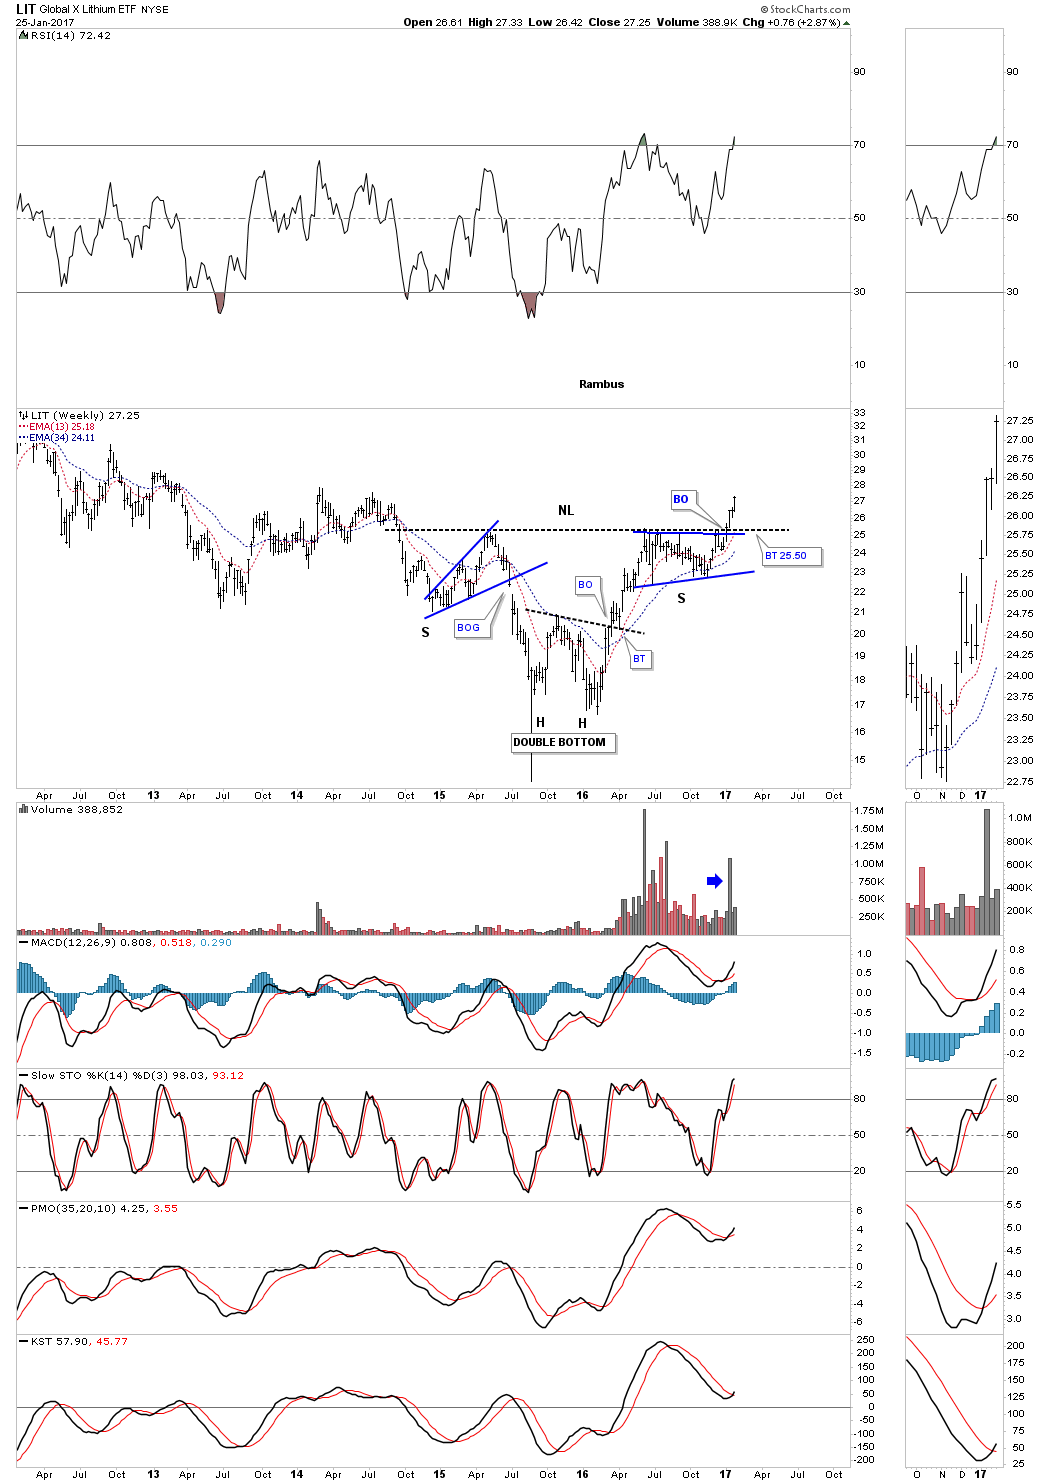
These next three stock aren’t in the Basic Materials sector, but are in the natural resource area. Below is a weekly chart for LIT, Lithium etf, which broke out of an inverse H&S bottom 3 weeks ago.
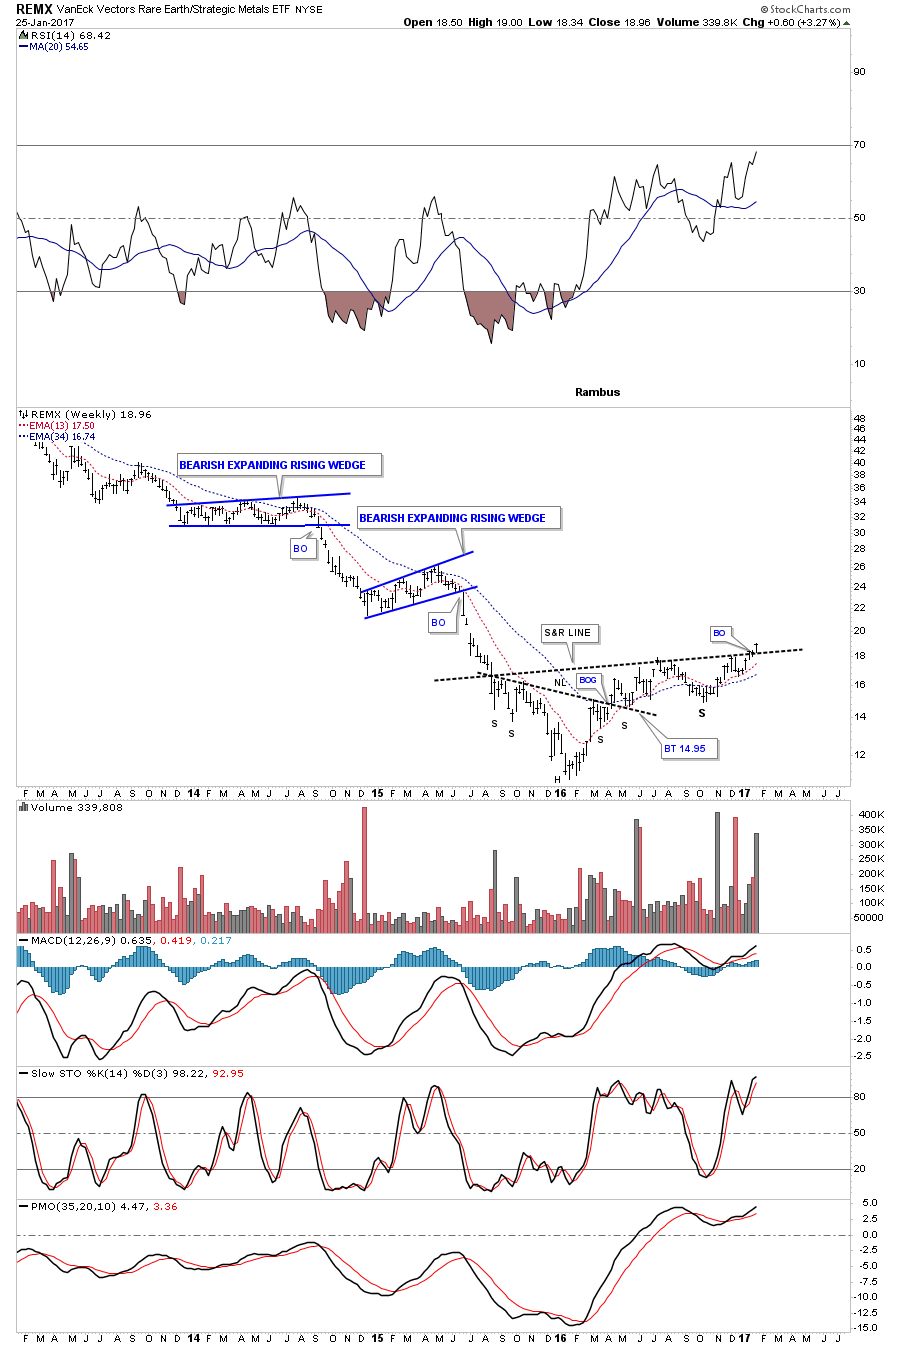
The weekly chart for REMX, Rare Earth etf, is breaking out from a complex H&S bottom this week.
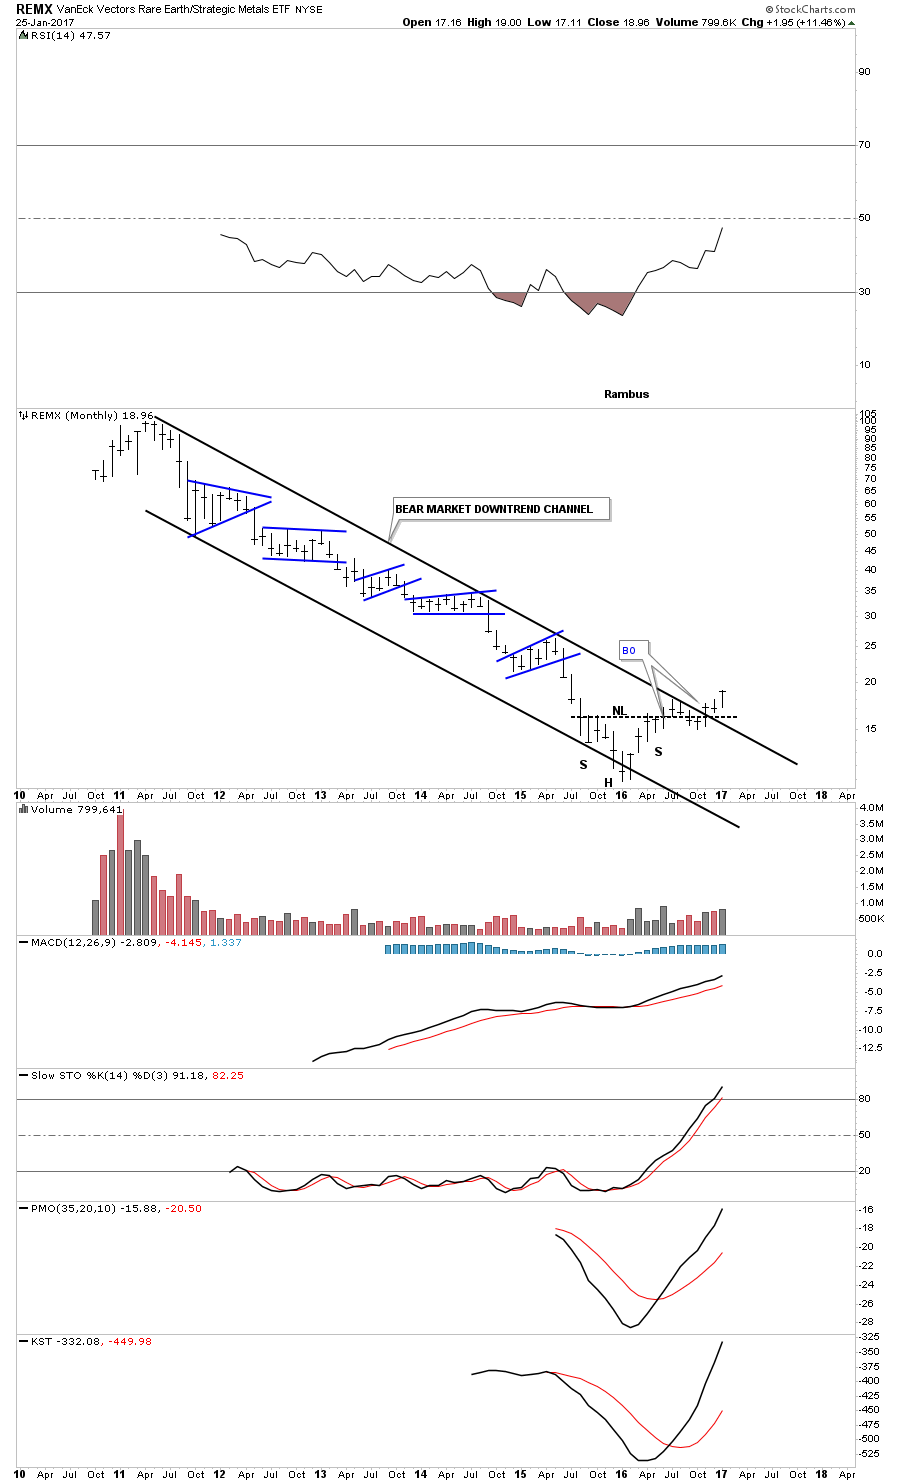
The long term monthly chart for REMX shows its entire history which is comprised of the massive downtrend channel. It’s currently in breakout mode above the top rail.
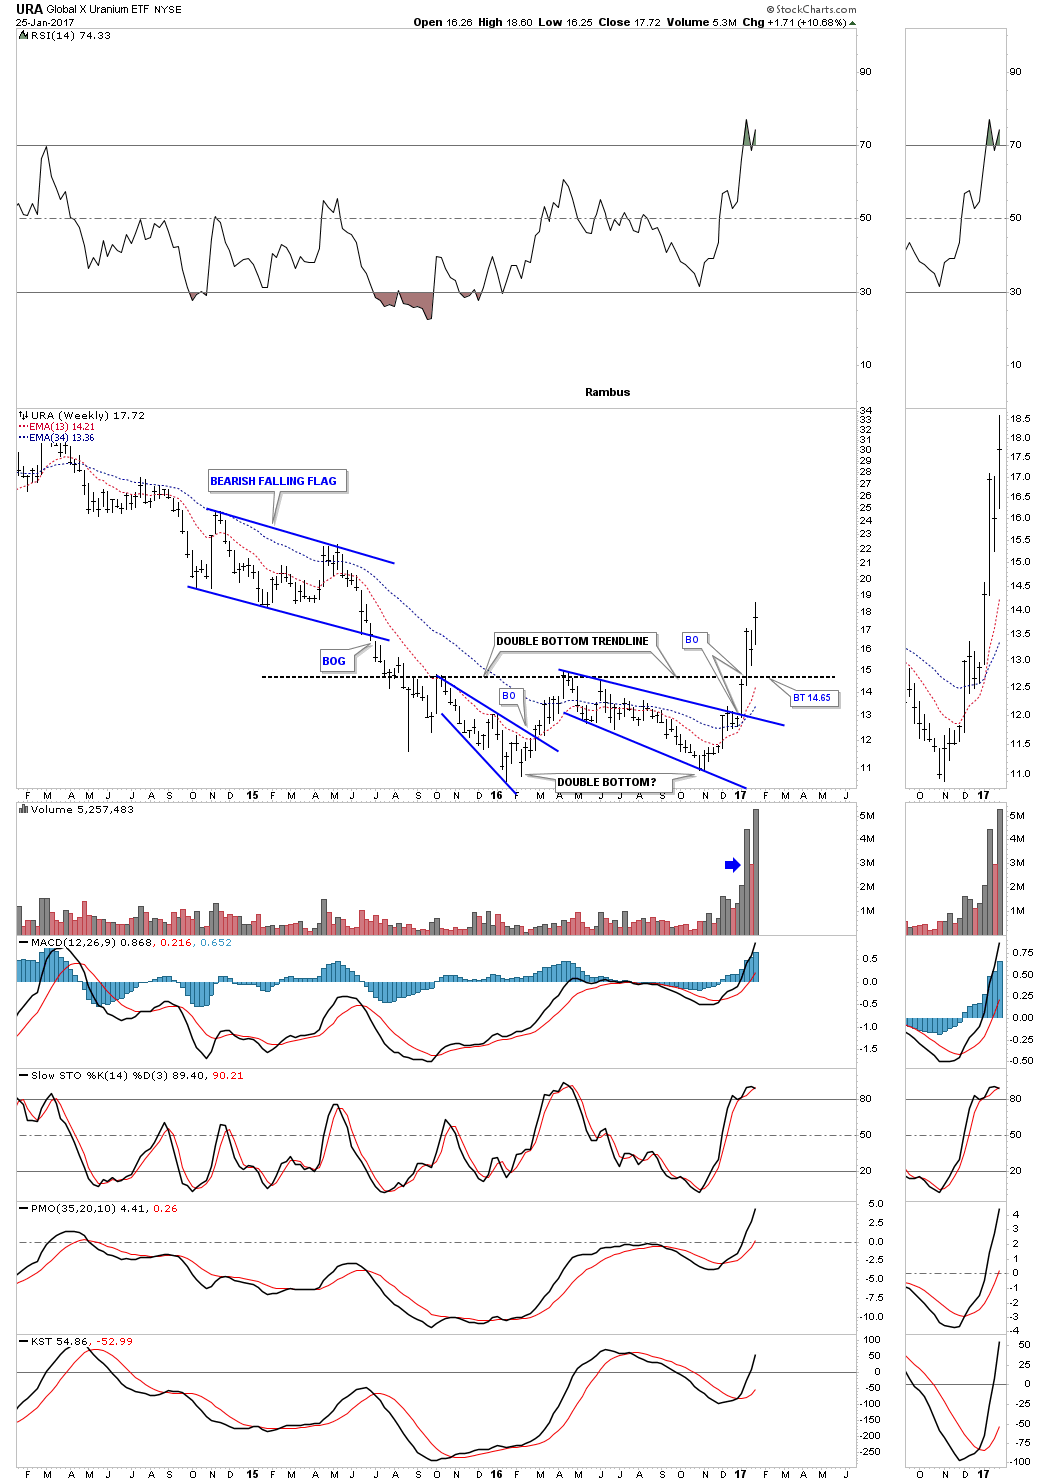
This last chart for tonight is a weekly look at the URA, uranium etf, which broke out above its double bottom trendline 3 weeks ago on heavy volume.
All these charts tonight show that something of a bullish nature is happening in the basic materials/commodities sectors, that has been a long time coming. These charts also bode well for the INDU which has a lot of these basic materials stocks in its makeup. So as long as the XLB, basic materials index, is making new all time highs then the INDU shouldn’t be to far behind. All the best…Rambus