Uranium part I revealed the ultimate bullish fundamentals of the uranium market, but also emphasized the importance of exercising patience. Ultimately bull market fundamentals exist, but the market doesn’t trade on fundamentals, at least in the short and intermediate term. It trades on liquidity, and for now the bid is not there. The sector is in the process of forming a bottom, but it would be unwise to go in whole hog with an entry position just because one can see a bullish eventual outcome. This past week proved that!
So before going any further analyzing the uranium sector I would like to review some investing concepts pertinent to establishing an investment position in such a volatile sector.
Volatility– One should not think of risk as the same as volatility. The two are not one and the same. Just because a stock moves up and down in large percentages does not make it risky. Most don’t understand this and think volatility is risk- it’s not. Volatility is actually the opposite side of the coin as liquidity. Illiquidity generates volatility. Since most think of volatility as risk it mentally blocks them to be able to use volatility as a tool to be used in their favor. Instead, volatility rattles them and often shakes them out of positions.
Using volatility to our advantage, we must be able to ride up and down through a trading range without getting rattled or shaken out and to be able to see it as an advantage for us. This skill set is particularly relevant in the uranium sector since they’re the most volatile stocks in the universe. The uranium sector, more than any other, requires one to be either a contrarian or be a victim.
Contrarianism– Such a misunderstood concept. How many investors love to spout the phrase “I am a contrarian” as if that somehow makes them a genius investor. More often than not it just means they are about to get run over by a truck. You can’t just be a contrarian just of the sake of it. Be one when it makes sense to be one. You must do your homework, you must asses the probabilities of the market being wrong. You can’t just be a dumb ass and think everyone is wrong because you are right.
The way to make the real money is to realize that price may be a liar. Price does not predict as well as everyone thinks. This is where doing your homework comes in since price often doesn’t tell you what you need to know. One should create his own investment thesis, if it is against the crowd, well then I guess that makes you a contrarian. If your trade is not priced into the market that’s where the value ultimately is if you are right. You make an asymmetric bet where the probability has been not been priced in and it’s the pricing in of those probabilities where all of the money is to be made.
Being a contrarian is such a challenge since being ahead of the trend often means being wrong for a while. However, one needs to be seasoned enough to understand the difference of being wrong and not being right-yet. One must develop a sense of how the world is changing. The average person is unable to understand change and instead just extrapolates the current trend.
Trade Sizing– A fundamental concept that separates the amateur with the seasoned investor. Without proper trade sizing one stacks the odds against oneself for an ultimate successful outcome. This is particularly applicable to the uranium sector due to its inherent volatility. Determining the correct size of a position is related to why I caution against making grandstanding bottom calls as it encourages a deep plunge into a sector where one really can’t know for sure if the bottom is in fact in. Better to take an initial position and look for bottoming action.
If a position is too large you will likely get knocked out, whereas if it is right sized you can ride the volatility and hang in there. You will be in a position to press your bet when conditions dictate. You must consider and match your time horizon with your investment thesis. This is particularly applicable with uranium as we know its not yet prime time, but it will be, it’s just a matter of time. The question is in how much time and when will the market begin pricing higher price in? If the thesis requires 5-7 years to run then we need to size our position for this time period. Stated differently your investment horizon must match your idea horizon
This uranium sector is a wile beast. We can use it to make huge returns, but we need to bring our best game to the fight. Equip yourself with the appropriate tools and we can harness the power of this sector.
The Cycle
The uranium sector can fly higher than you can imagine and fall further than one can predict. Due to the inherent volatility the way to make a fortune in the sector is to buy in the bottom of a cycle. The best way to do this is to wait for a bust. We have now seen such bust as was described in part I so we know that we are now in the buy zone. It’s just now a function of refining the entry point.
Uranium- The incredible metal.
Uranium is a super concentrated metal. It is so dense that a one gallon milk carton filled with uranium would weigh 150 pounds. 13 of those milk cartons of uranium produces the same amount of energy as 80,000 barrels of oil. It’s relatively plentiful, with 40 times more of it in the earth’s crust than silver. In a future powered by electricity uranium is an indispensable metal.
All markets are cyclical… So it helps to know where you are in the cycle-Plunger
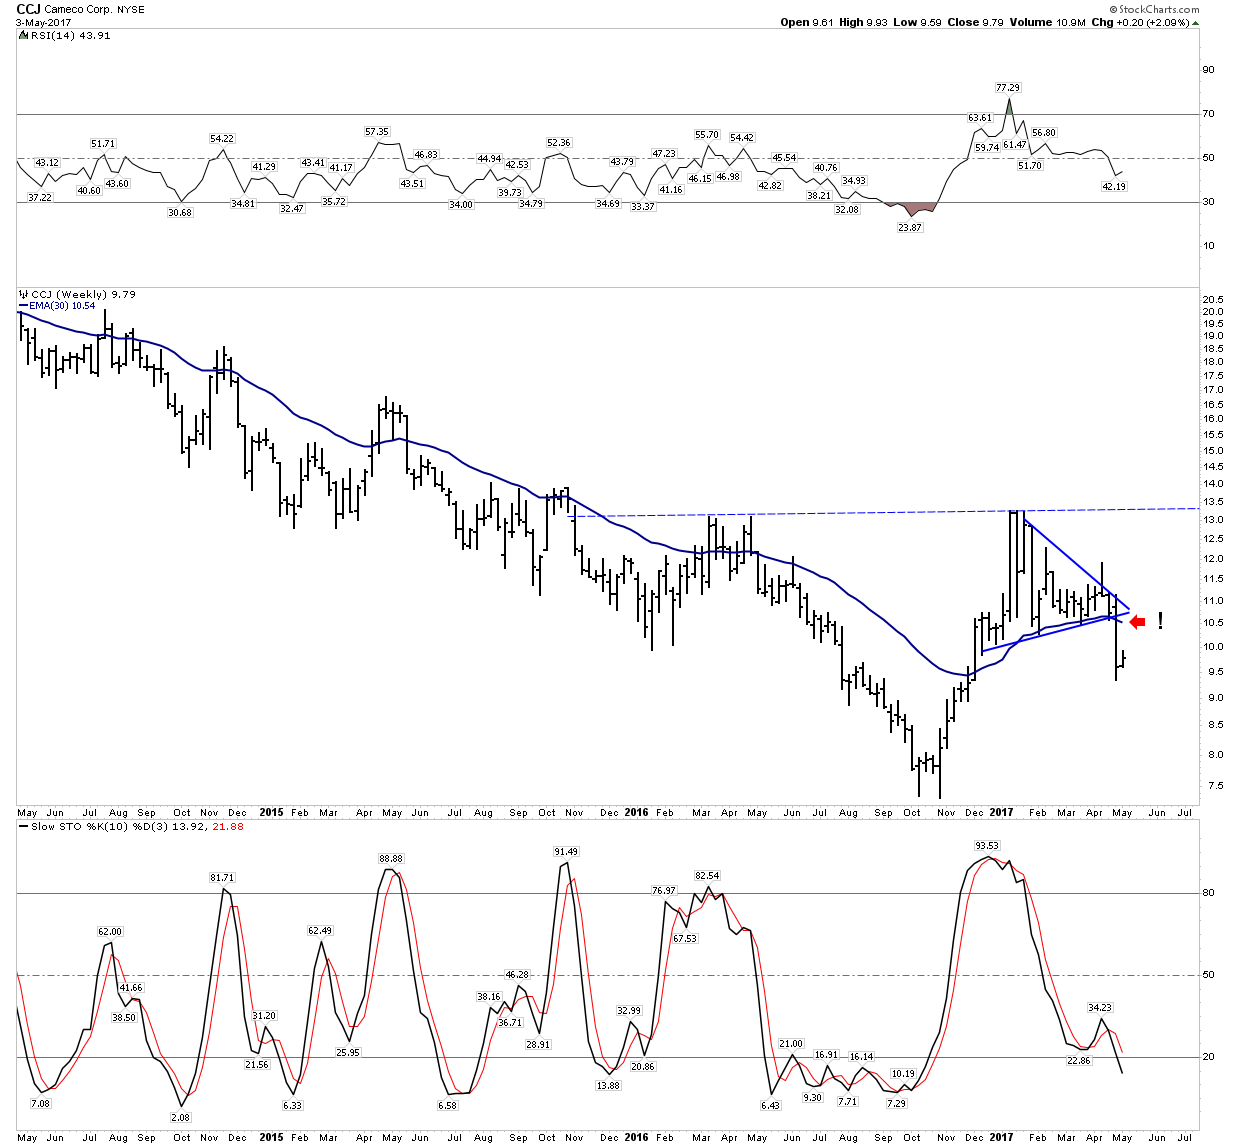
I spend a lot of time thinking about how price fits into the big picture. It is why I have expanded Robert Rhea’s psychological phases of markets into a Chartology model. I find it’s an essential element in my tool box which gives insight into where a market is in its cycle. Applying this skill set towards uranium is somewhat problematic since its such a small sector and there are only limited data samples. So I am going to use Cameco as a proxy for the industry in my analysis. Cameco produces 20% of all industry production and is a company which must ultimately survive on its own as it’s not subsidized by a national government. Production from Kazakhstan however, is somewhat artificial as initial exploration and development occurred under the Soviet model where cost was not a prime consideration. Much of the development would not have occurred using a profit and loss discipline. So I think an analysis of the price action of Cameco offers us the best proxy of industry performance.
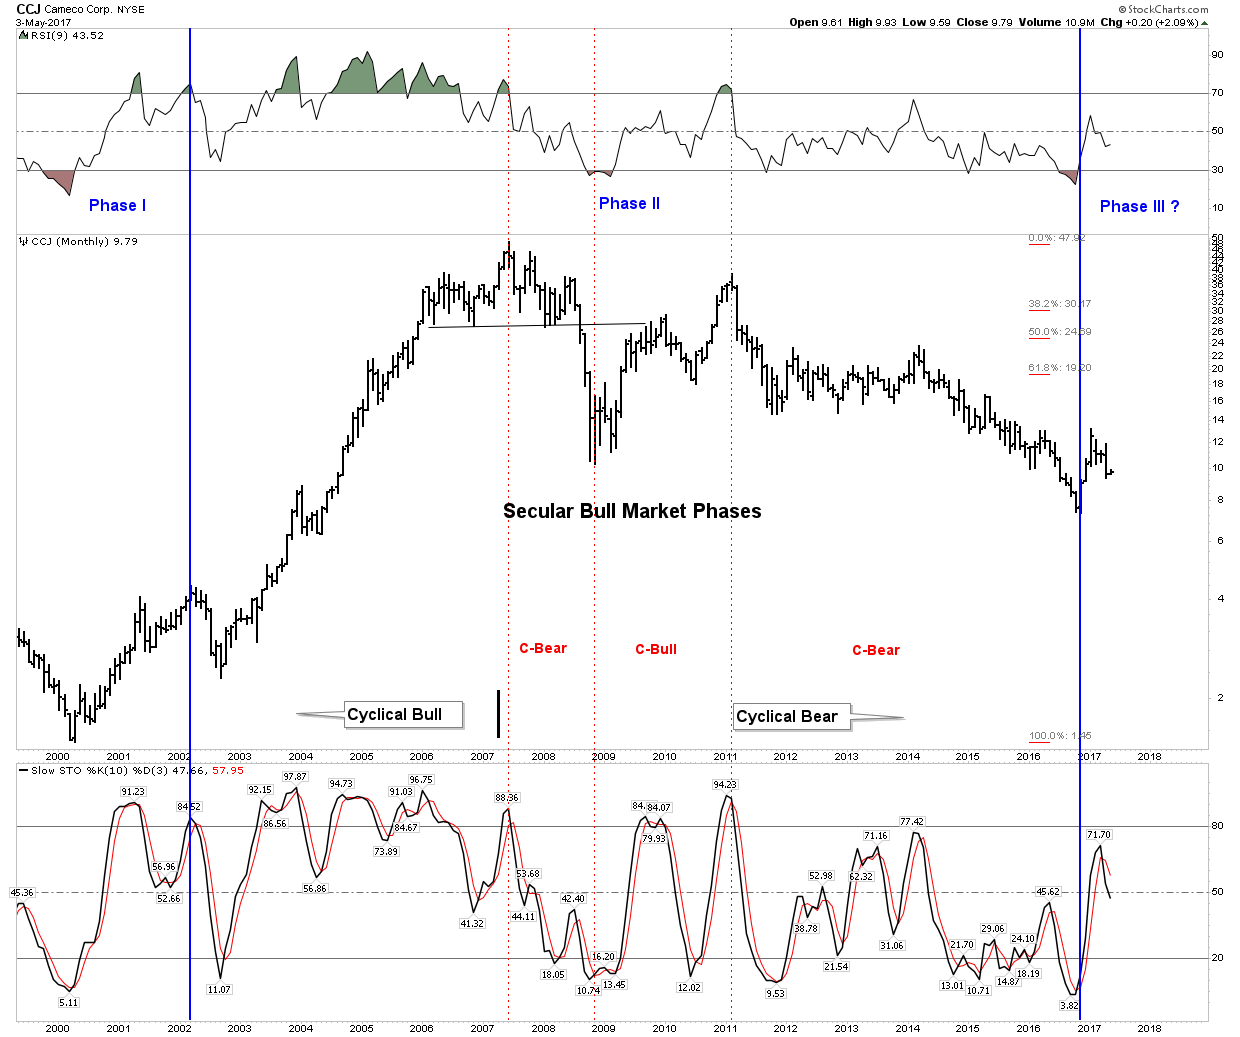
Uranium Stocks Secular Bull Phases
As Rambus often says nowhere else in the world are you going to get the following insight and analysis. It’s unique and not to be found anywhere else. IMO it’s the principle benefit of what this site delivers. In order to identify the cycles of the uranium market I will adapt some major assumptions which as of yet are unproven. My chief assumption is that we saw a major bear market bottom in late 2016. Later on I will show you the model and analysis which leads me to this tentative conclusion. In Part I we saw the long duration bull markets that have occurred in the uranium price. It is my premise that we are currently in the third secular bull market in uranium and it began in the year 2000. Phase I, the accumulation phase, lasted from 2000 to 2002. Phase II, the mark-up phase, lasted from 2002 to 2007. In phase II Cameco went from under $3 to $48 and whenever sectors have such huge gains it typically requires prolonged periods to consolidate those gains. This consolidation period appears to have taken 10 years in this sector. This is similar to the rise in oil from 1972-1980, undergoing a rise from $2 to $40 requiring a consolidation lasting 24 years before it could break out of its consolidation trading range.

A long term secular bull market typically has several cyclical bull and bear markets within it. Since its top in 2007 CCJ has been in a long term 10 year consolidation of its massive move from 2000-2007. This consolidation has consisted of 2 cyclical bear markets and one cyclical bull market. Strung together this retraced 85% of its move from its 2000 low. A brutal retracement, but recall these are the most volatile stocks in the universe remember? Using this model what lies ahead still is phase III, the blow off or mania phase. Typically in Phase III price breaks through the previous top of phase II and accelerates from there. Capital is drawn into the sector and valuations go to previously unimagined levels. Recall NASDAQ in 2000, or oil in 2008.
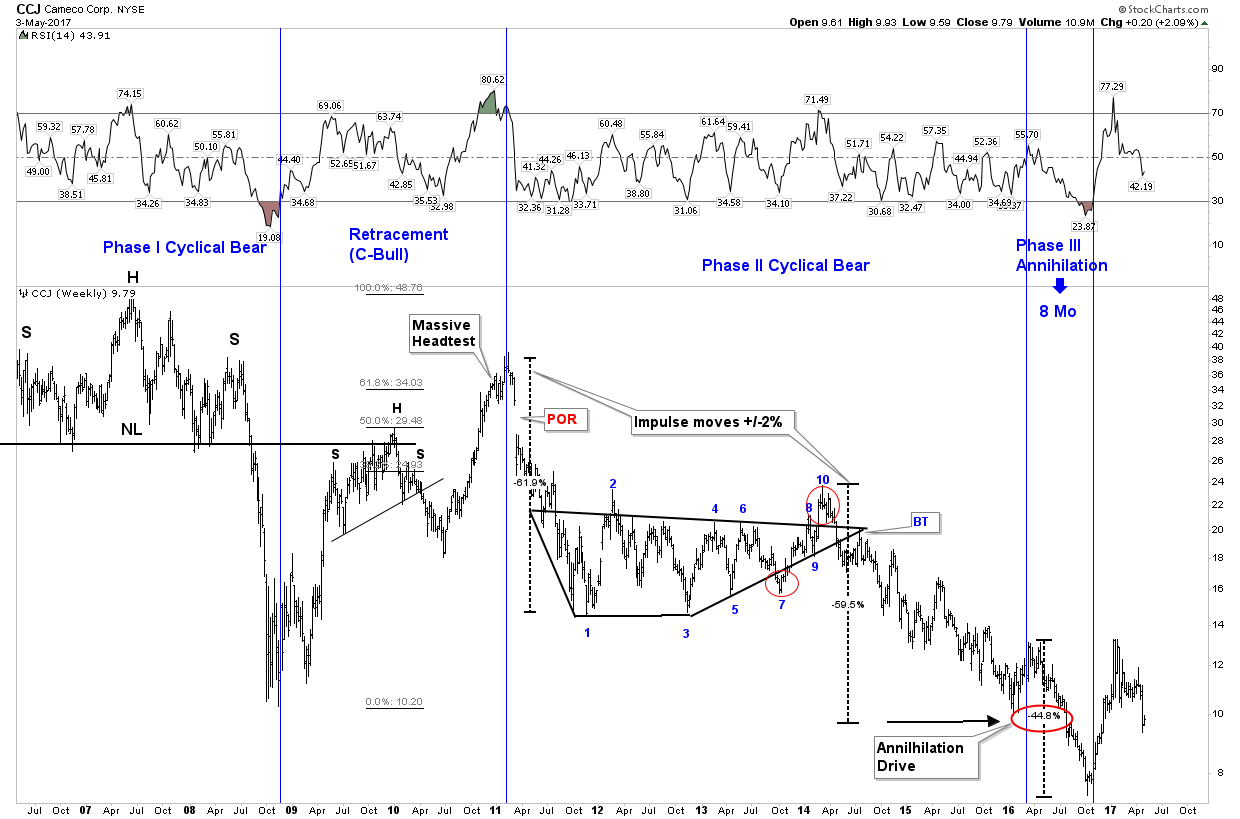
Phase II Consolidation (takes form as Cyclical Bear & Bull markets from 2007-2016)
The chart below zooms in on the 10 year consolidation of the massive 2000-2007 move. Here we have 3 clear phases of a bear market. Phase I (Distribution Phase) includes the crash of 2008, but in retrospect the crash was just a temporary diversion of the distribution process. This bear phase actually included a cyclical bull market within it. This all sounds contradictory, however one can see that despite price rocketing upward for 2 years it was really all part of a distribution phase… or phase I. Shares were distributed from informed forward looking investors who understood market cycles to the suckers all lathered up through positive price action.

Cyclical Bear Phase II- This began in early 2011 in what I call a head test or bull trap. Price often spikes pulling in the last bulls prior to a major decline. Note the point of recognition (POR) came early in phase II. POR’s always come in phase II and was particularly violent due to Fukashima. But note that last bar before the gap down occurred before Fukashima. It occurred on 7 March 2011, whereas the earthquake was on 11 March 2011, so the downtrend was already asserting itself, Fukashima just added a big push. As we saw in the gold market in 2013 following the Goldman raid markets typically enter a consolidation after a phase II POR crash. We see this in the 10 point diamond consolidation that lasted 3 years.
Mr. Bear gets devious.
In typical fashion before doing a slice down through the APEX of the diamond Mr Bear delivered a bull trap in the form of a false breakout to the upside of the diamond. After the breakdown we then see a backtest and then price resumed its bear market decline. Having spent 3 years in a bear market consolidation and then sucking in latent bulls in its bull trap it was now fueled up to resume a relentless 2-year decline. This decline was in fact a measured move impulse coming out of its diamond consolidation. Note the impulse moves entering and exiting the diamond are virtually equal, a vicious 59.5% decline.
Cyclical Bear Phase III- Annihilation
The separation between phases is observed with a counter trend move. Here we see in Jan 2016 a 7 week BMR which relieved downward selling pressure. Now recharged Mr. Bear pulled out all the stops and applied the thumb screws. That’s right, the dreaded capitulation of phase III… the annihilation. This is where severe bear markets end. Non-stop selling crescendos into an annihilation drive. All hope is lost for a turn, liquidity is removed and comical selling asserts itself. Its a pretty ugly affair. We see this in the depicted 8 month annihilation drive where Cameco having already dropped 73% from its highs went into a 44.8% crash. Simply brutal.
A completed Bear Cycle
The above analysis is the main reason I believe the bottom of October 2016 was THE bottom. The price action since October up until today doesn’t convince me that we are in a bull market, however its the fullness of the process leading into the October price level which speaks the most to me. We simply saw enough to recognize the worse is likely behind us. Certainly we could double back and retest that bottom, as painful as that would be, but if we have sized our positions corectly we can survive that process.
It is not my intent to mark up the entire uranium sector and provide recommendations. I regard it more important in the early stages to focus on the process instead, that’s why we have covered the ground we have. Once the bull asserts itself we will get larger gains from companies moving projects into production. Discovery companies will delight, but it’s the producers that will deliver the big gains. Therefore that’s my focus and US based companies may be the biggest performers due to the wild card factor.
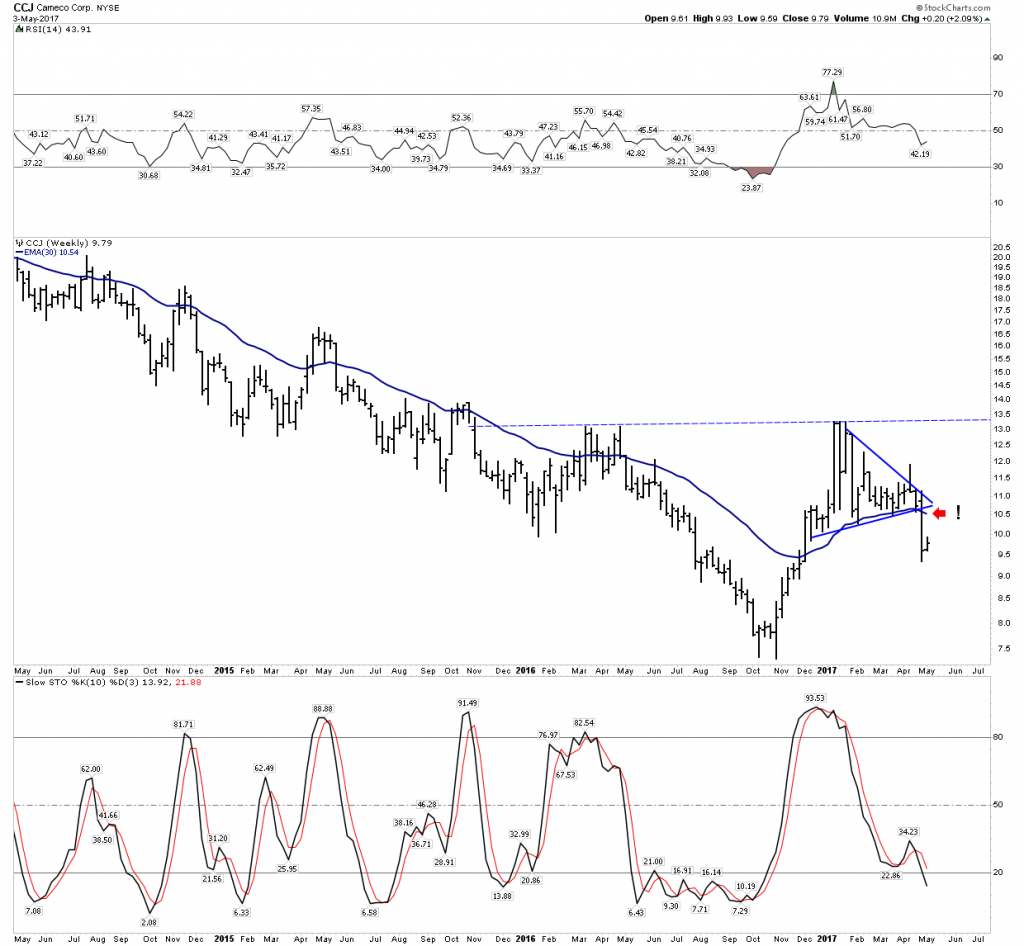
Cameco
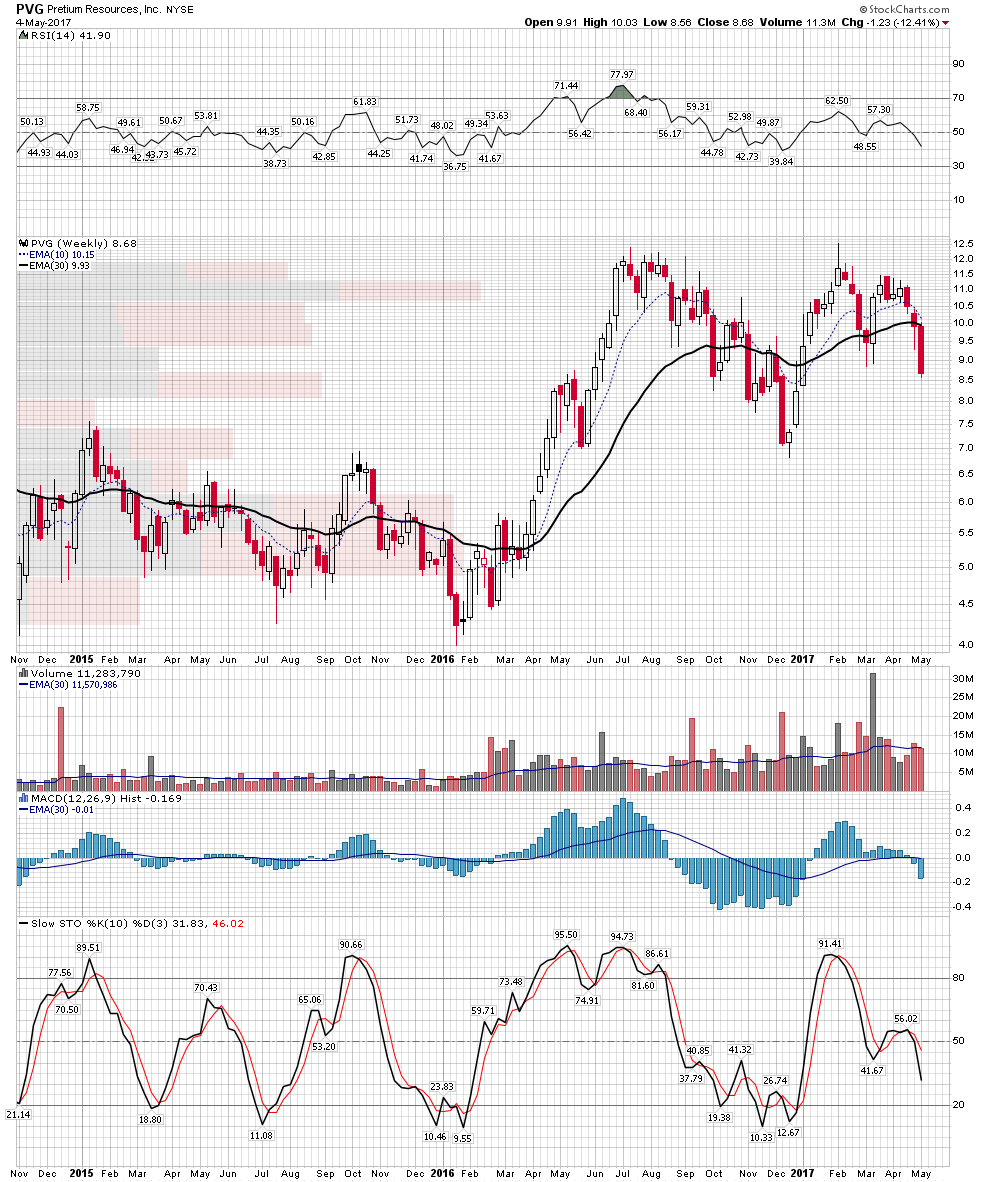
It’s the Big Dog. 20% of the world’s production with 3 of the world’s top mines. Unbelievable grade in a safe jurisdiction. Will no longer do long term contracts at existing prices. If you are in Uranium this should be your core holding. Looks to still be in a bottoming process. Note the 30 W EMA is now tilting down. Give it some time.
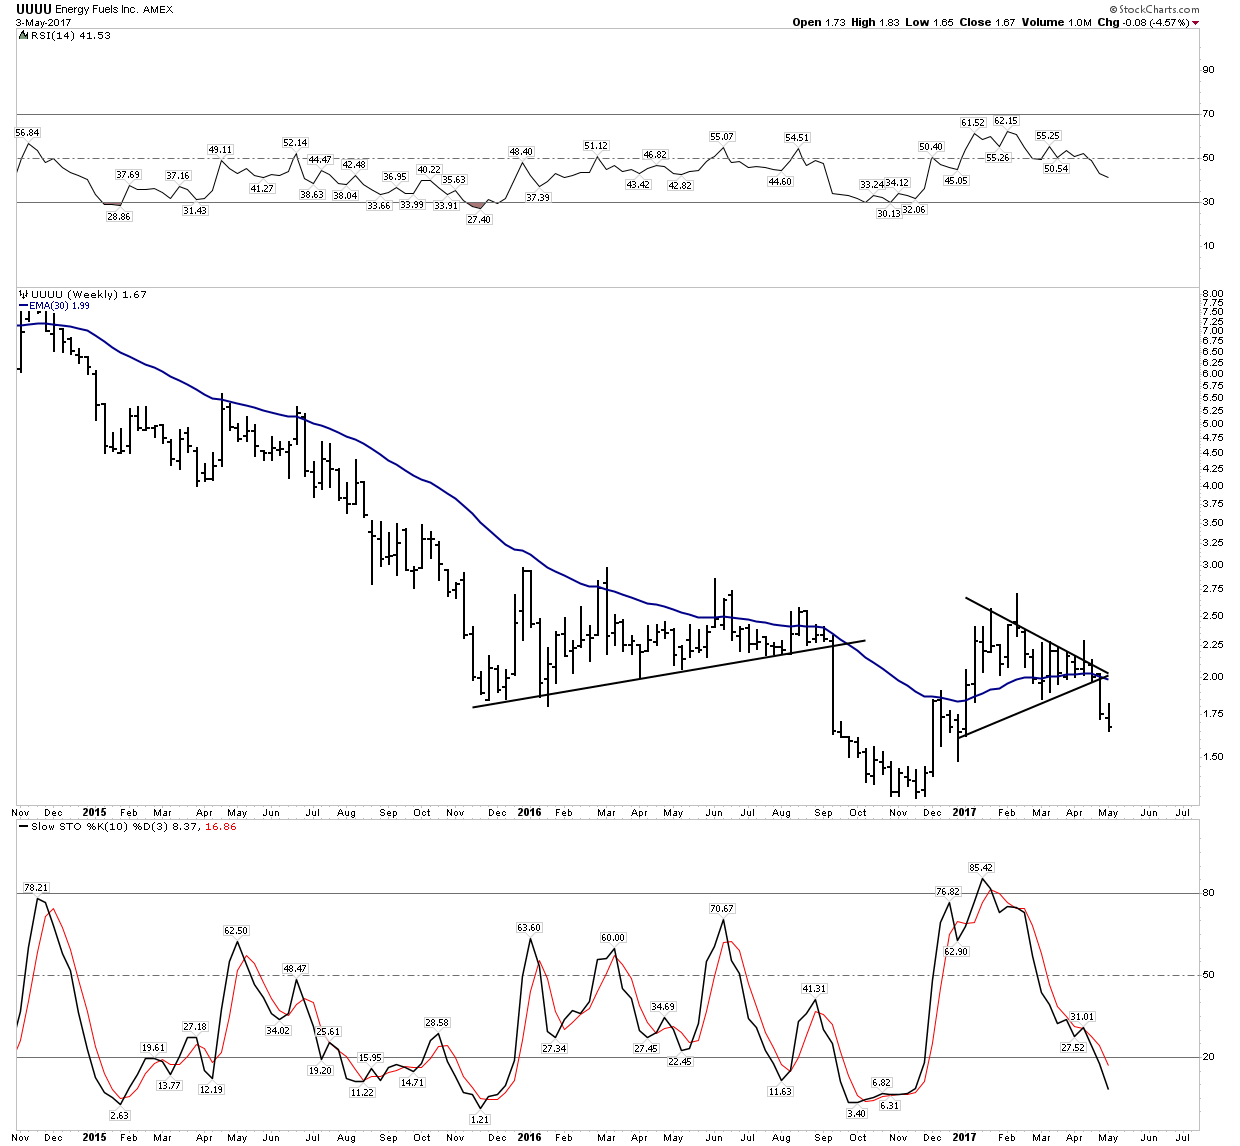
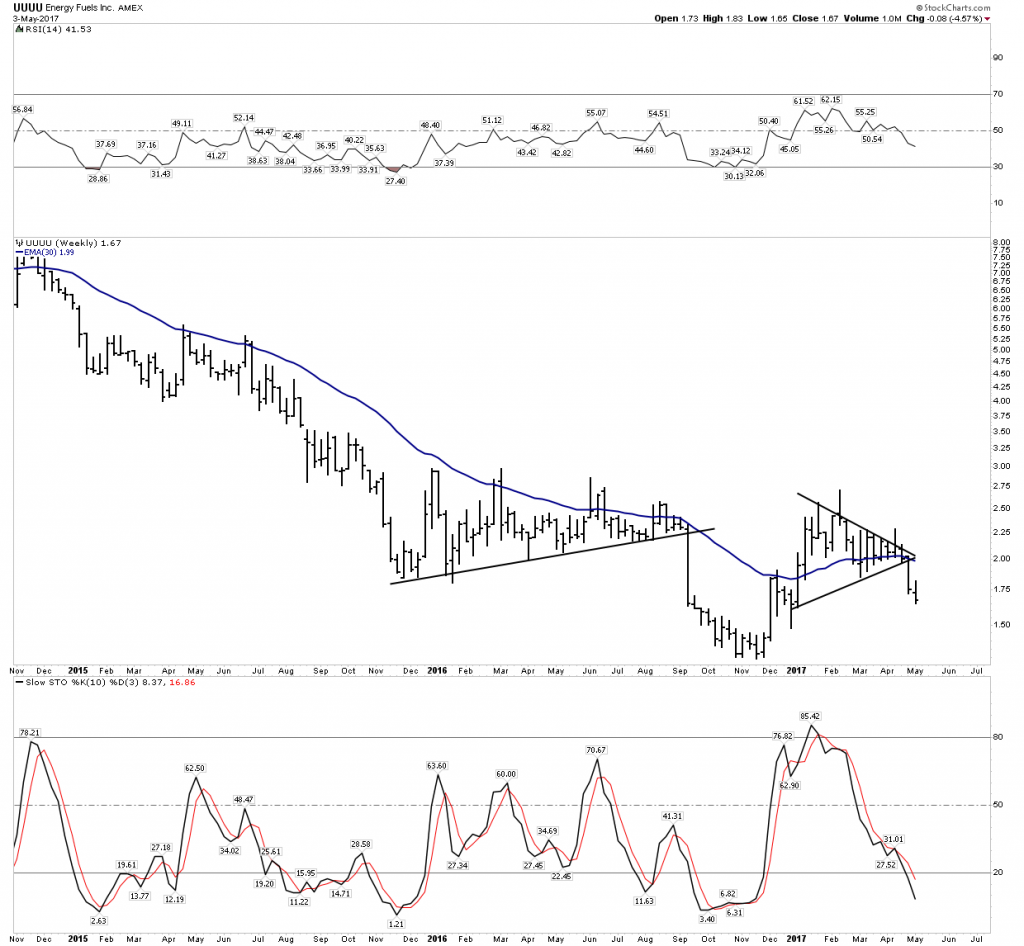
Energy Fuels
After CCJ this is my preferred company. US Based production with permits in place. Able to ramp production the most and the fastest of all the companies. This is the spec play to own IMO. But look at the power dive its been in over the past 8 years…Gosh. Appears to be attempting a bottom but the 30 W EMA is rolling over and stochastics are still plunging. Keep watching it and nibble a little down the road. Management tends to deliver surprises with financings when they run out of cash.
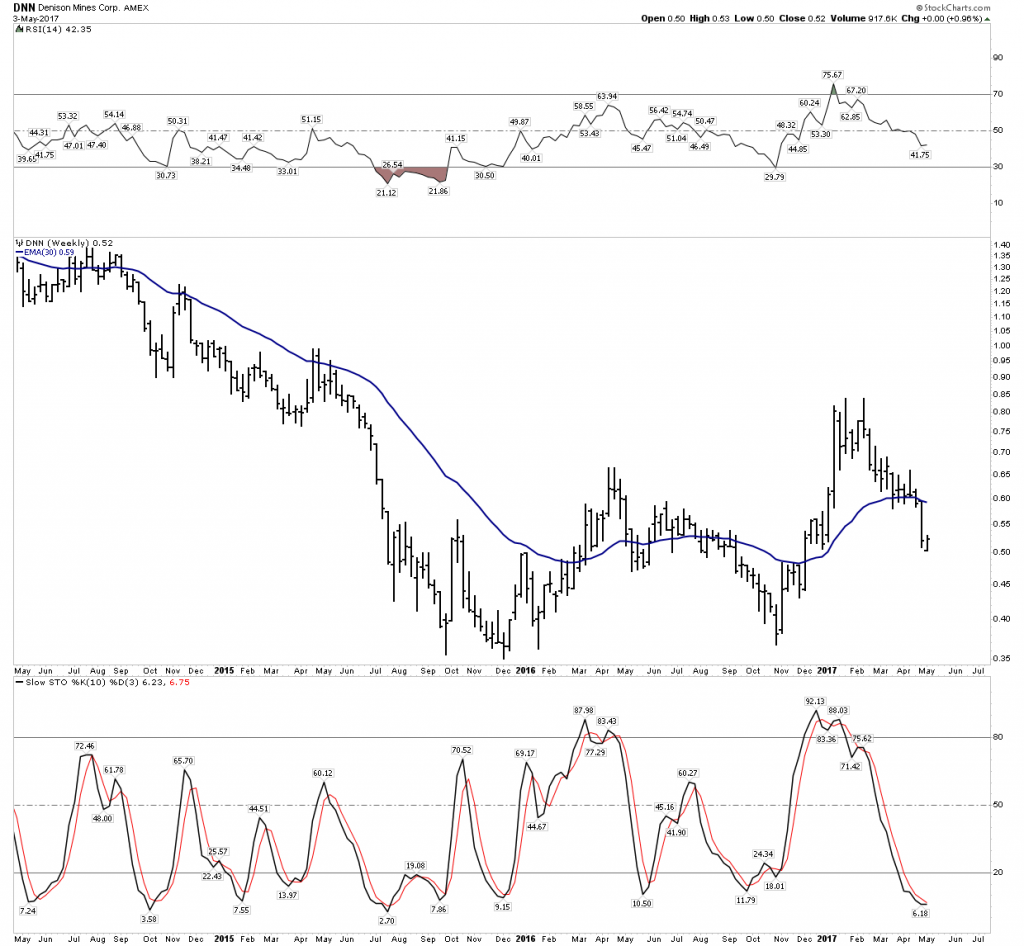
Dennison
Its been a dog of the sector. A resource royalty family owns and controls it through the Lundeen family. Rick Rule refuses to get too excited as he told me there is not a rush to own it. Chart wise, maybe we have a double bottom in the making. Keep an eye on it.
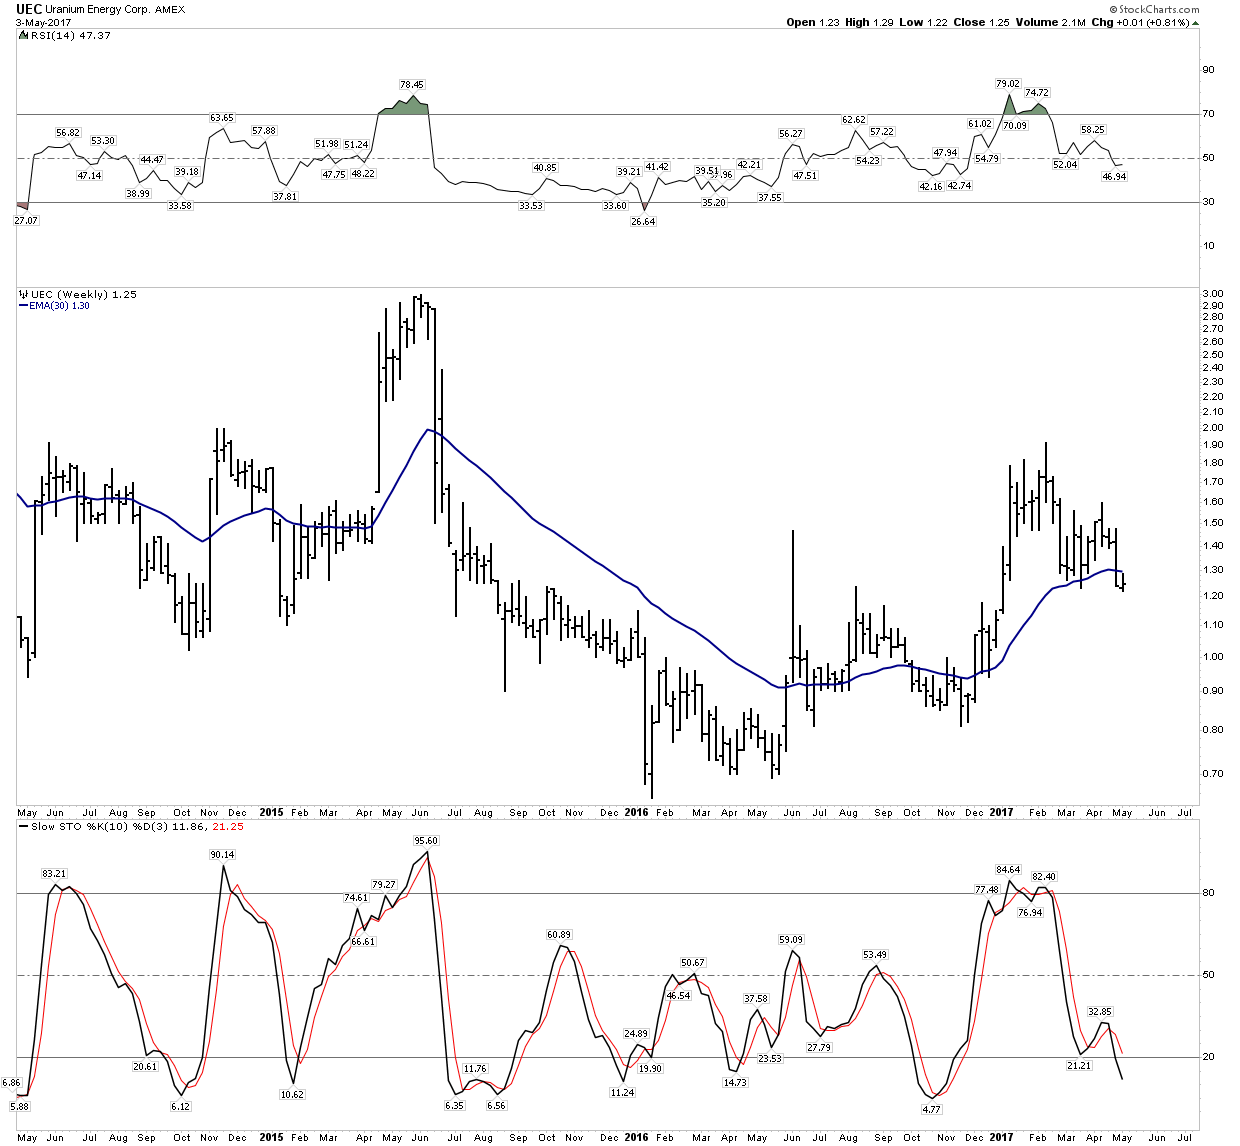
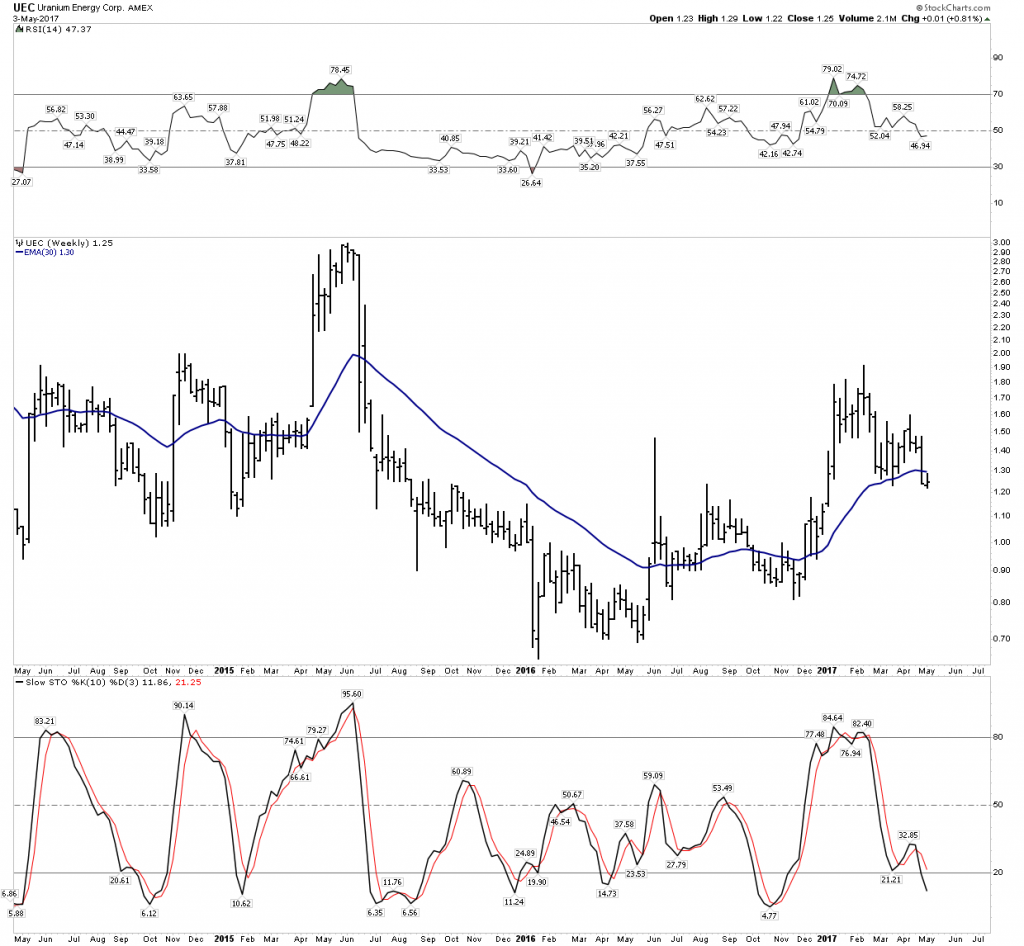
Uranium Energy Corp.
Amir’s little US based Uranium play. ISR production, with a thin balance sheet. Fortunately for them they pulled off a decent financing during the pop. But they desperately need a higher uranium price to make it work. They are in a battle with the clock. Tic Tic Tic.
But if you want a US Based super leveraged play you have it all here. Amir is a very well connected capable operator. Don’t ever sell him short. Like the song says, he’s a smooth operator.
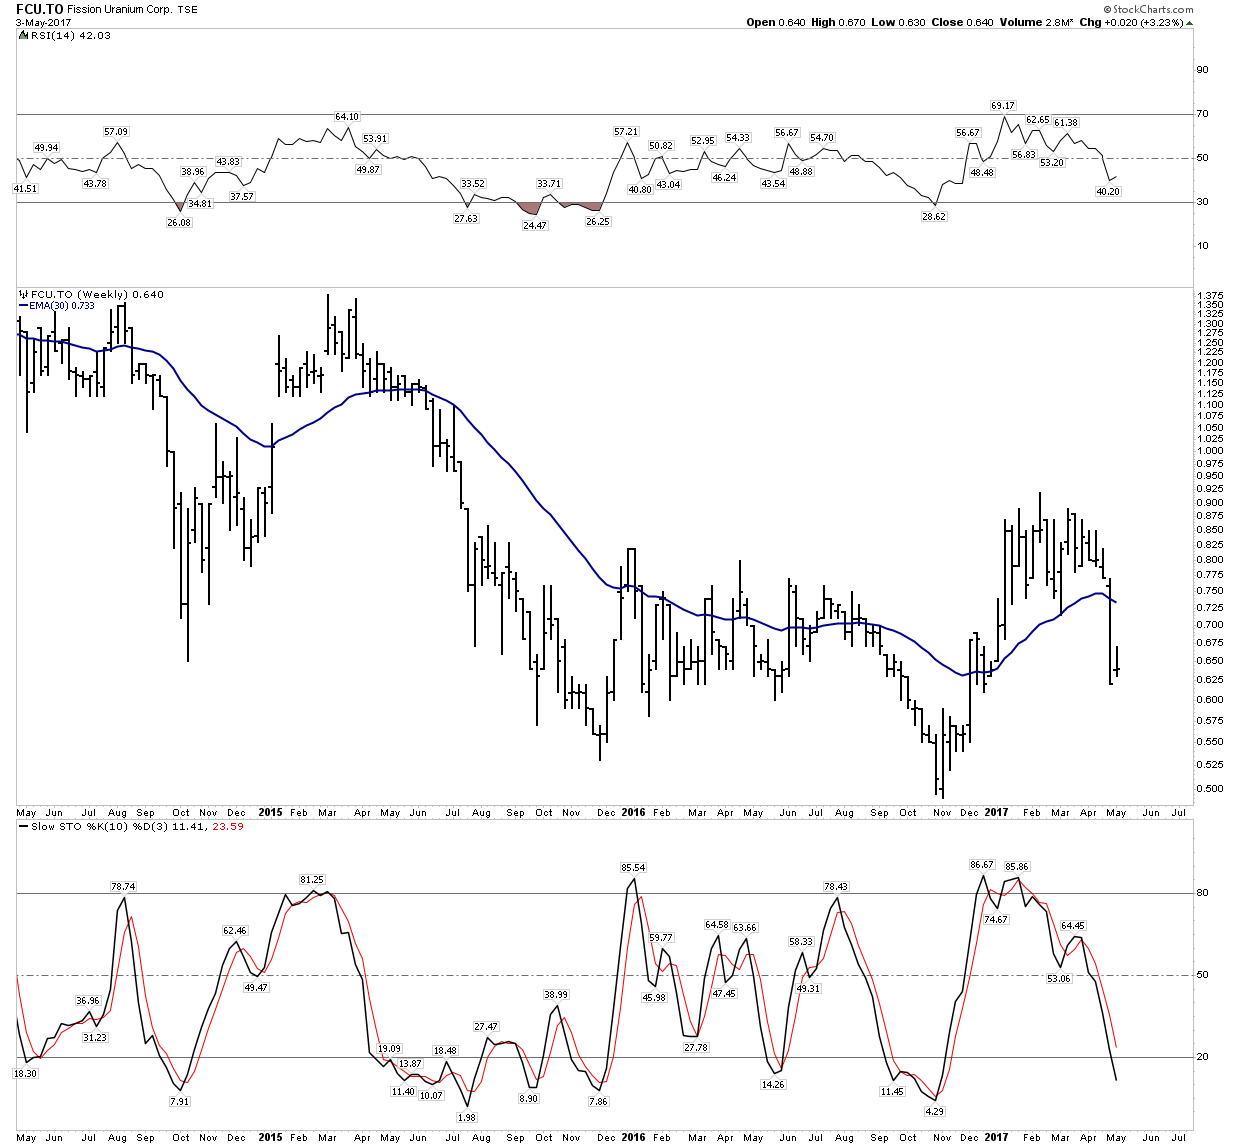
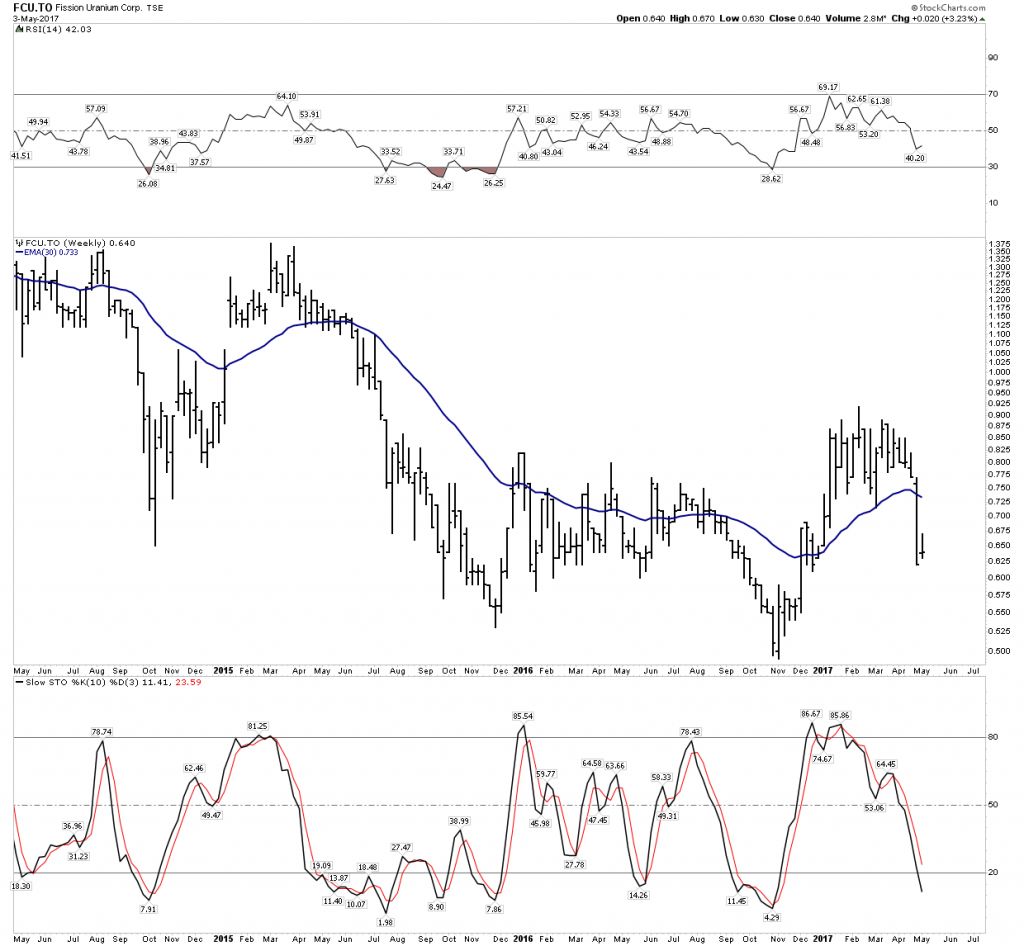
Fission
Yesterday’s darling. Just seems like yesterday this was the go-to explorer. Things have cooled down as this Athabaskan play is not as high grade as once thought. But it could be bought out at some point. Like the others more bottoming action with a 30 W EMA that’s rolling over.
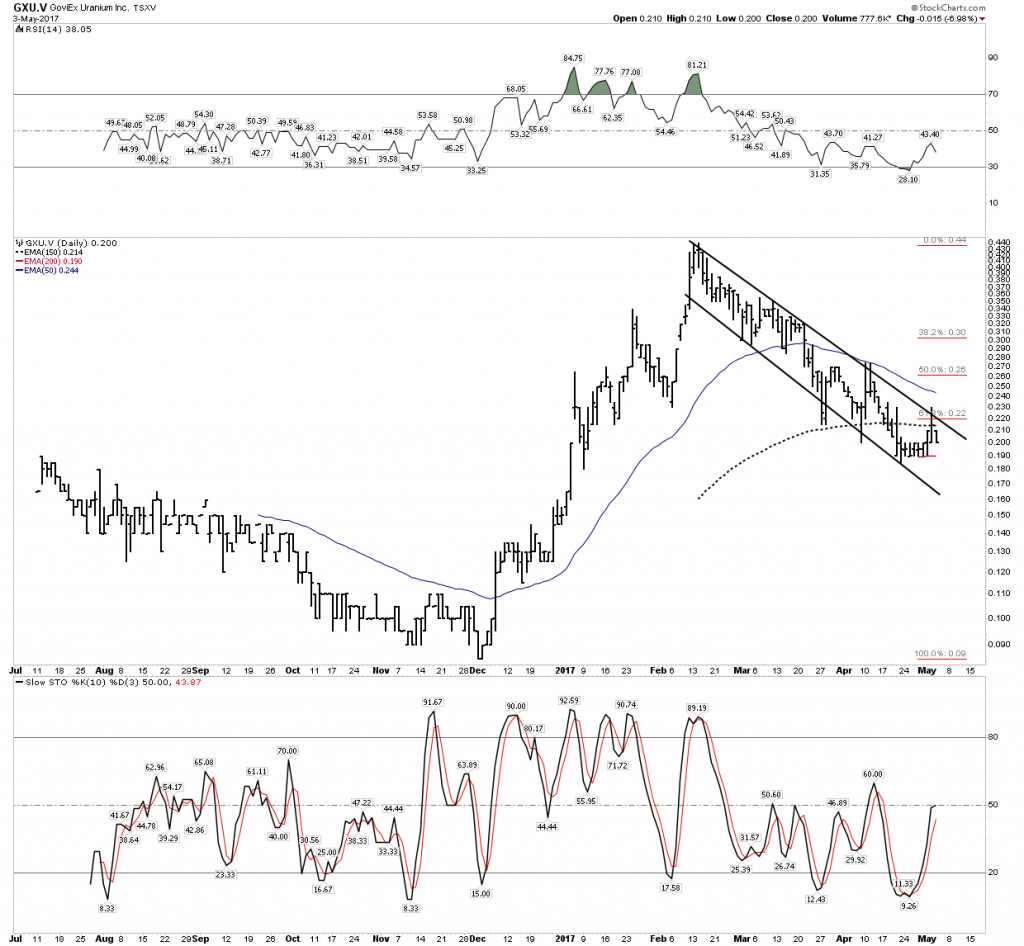
GoviEx Uranium
Can you say Bull Flag? That’s what it looks like we have here. This is Robert Freidland’s little project that he is training his son on. I have met the kid and I thought he was a mini-me arrogant jerk. But that’s what one would expect if you were Freidlands son right? But that doesn’t mean you can’t make a fortune with this company. Ausie based seems to have now finished up its much needed correction.
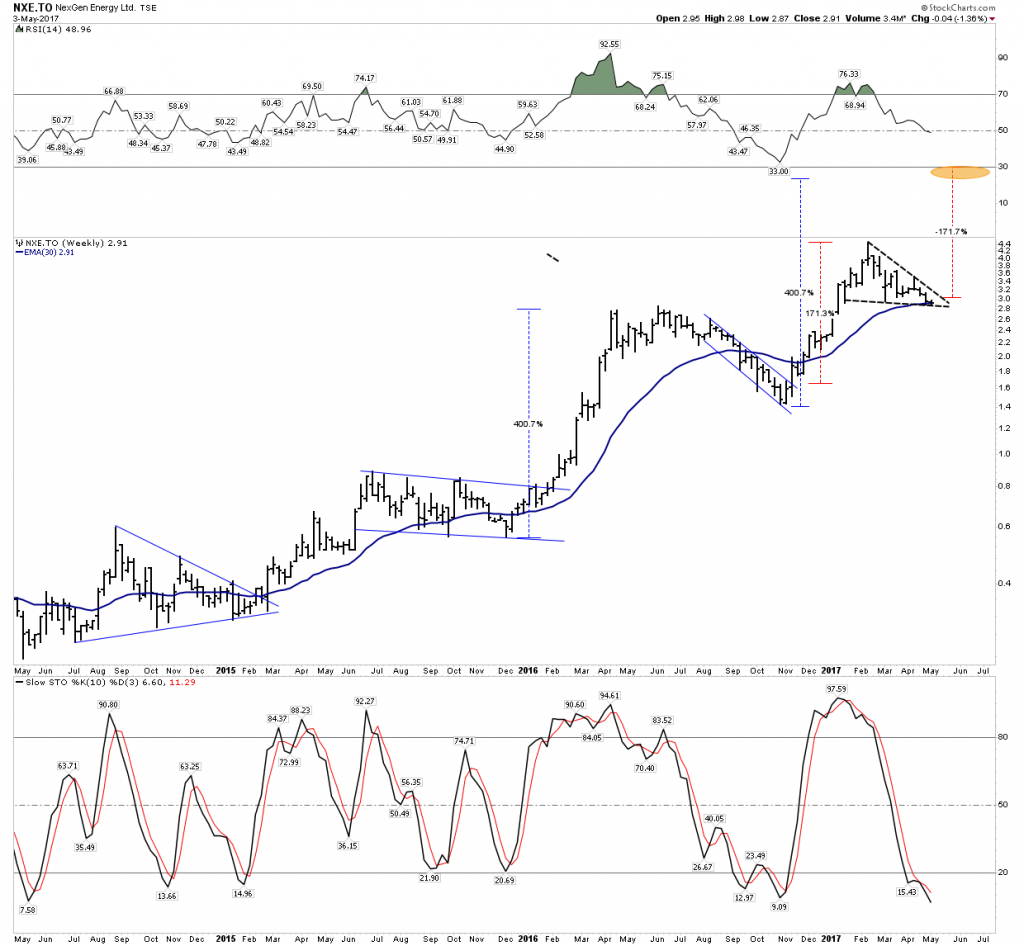
NexGen Energy
This is currently the go-to discovery play. High grade, and it will be a mine. It’s obviously marching up the ladder of chartology consolidation patterns. Looks ready now to impulse up into its next. Might want to start buying this one right here.
Conclusion
I have discussed the tools to approach this sector. Think about time horizon, position sizing and bottoming action. It does not serve us well to say the bottom is in let’s go whole hog. But having said that I do think we are in a bottoming process. We don’t know how long it will last as there is a certain amount of game theory going on between utilities and producers. Utilities don’t want to believe what suppliers are telling them. Secondary supply is dwindling, while there is still a supply overhang. Will the market slowly discount the positive future fundamentals or will it wake up to the future reality all at once and have utilities all respond to new purchases at the same time? Could it develop into a buyers panic? That’s the game!
It appears the broad sector is in Weinstein stage I. It has not entered stage II. The big bet is when that moment will come.