Friday Night Charts…OIL SIGNALING DEFLATION ?

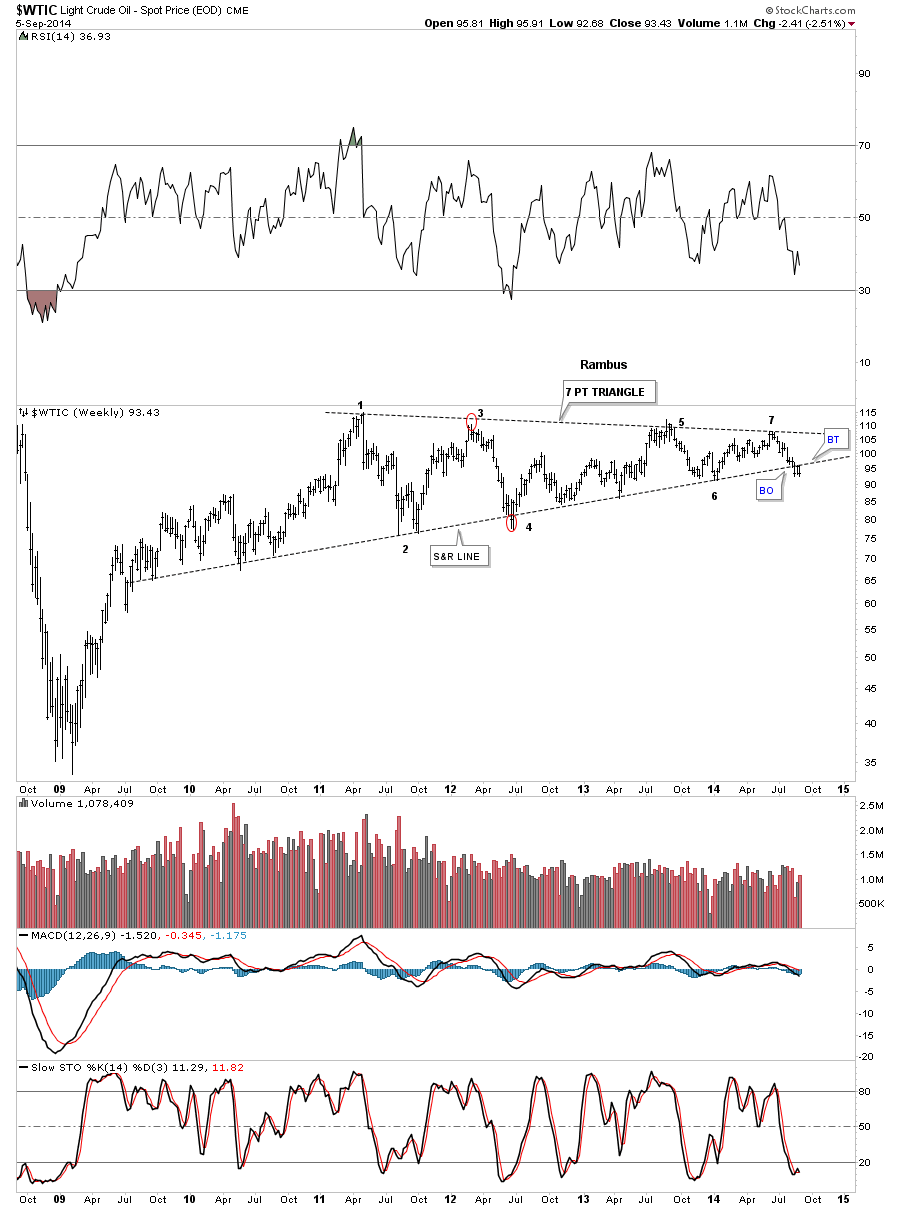
Tonight I would like to show you a few Oil charts as its been fairly volatile lately. There are several big patterns in play that have been forming for many years. This first chart is a long term weekly look that shows several potential patterns forming. On this chart below I’m showing the bottom rail as a five year support and resistance line. Notice how many times that bottom rail has been hit over the last 5 years. Three weeks ago Oil broke below that bottom S&R line and has been in the process of backtesting from below. So far it has held resistance. I can also make a case for a big 7 point triangle reversal pattern as shown by the numbers.
oil 222

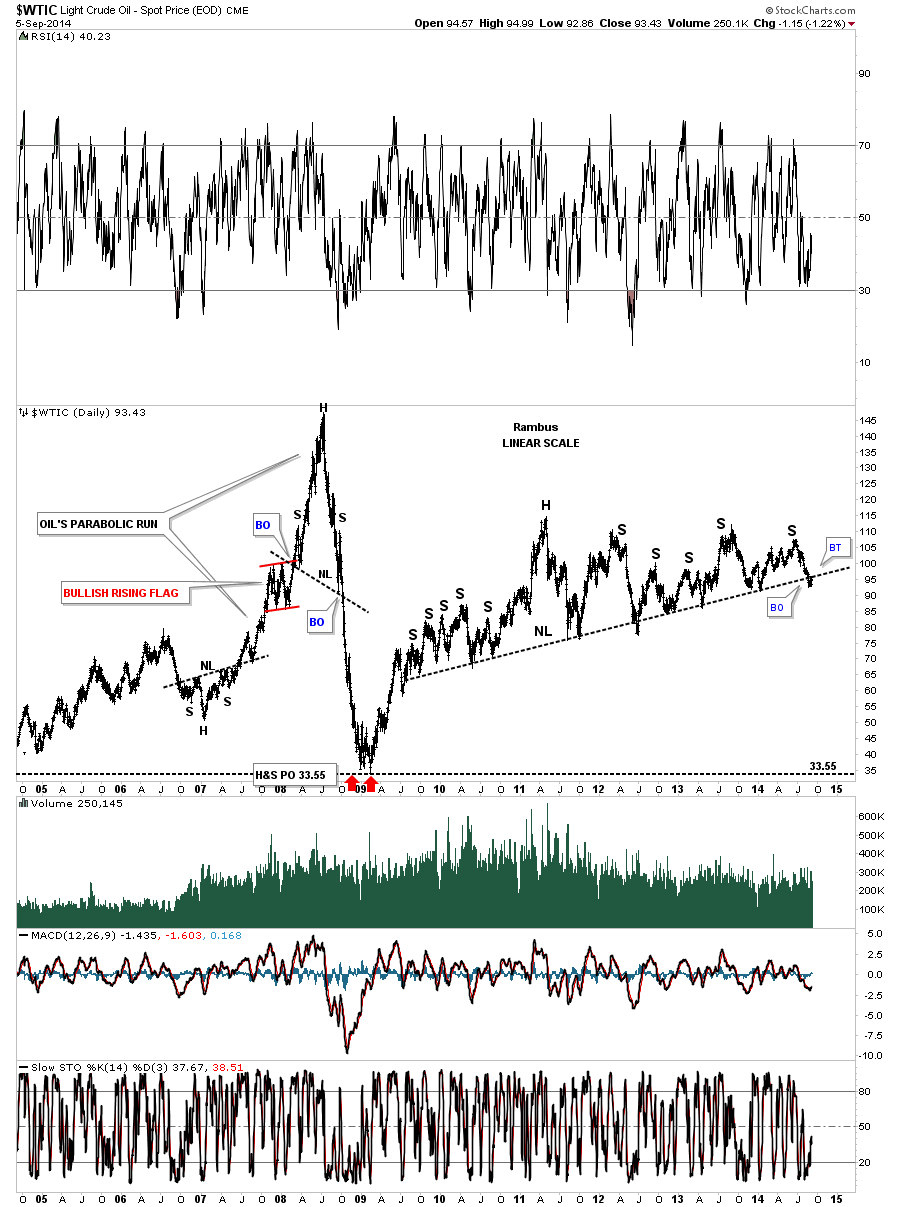
This next chart is similar to the one above but goes back further in time that shows Oil’s parabolic run, the crash and the potential massive unbalanced H&S top. This chart is a good example of what can happen after a stock goes parabolic.
oil parabolic

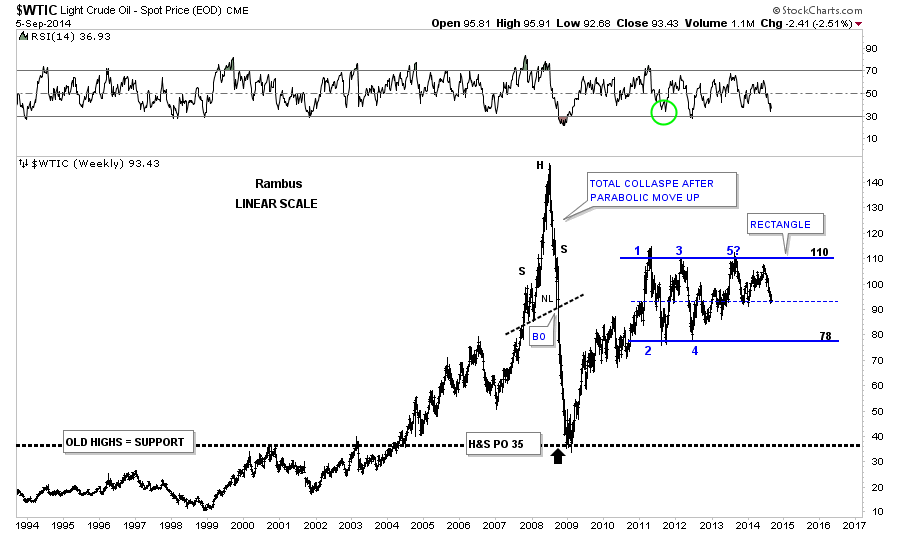
Below is another long term look at Oil that goes back over 20 years that shows another possible pattern that has been forming since 2011 the blue rectangle. I’ve taken the liberty to draw in the horizontal top and bottom rails that really shows where support and resistance lies. Sometimes on big patterns like this I’ll give the area of support and resistance a little more  leeway because of the distance between the reversal points. Here again you can see the parabolic rally and the parabolic decline that found support at the previous all time highs at 35. The 35 area reversed its role from what had been resistance for the history of oil to support during the crash.
oil blue rectangle

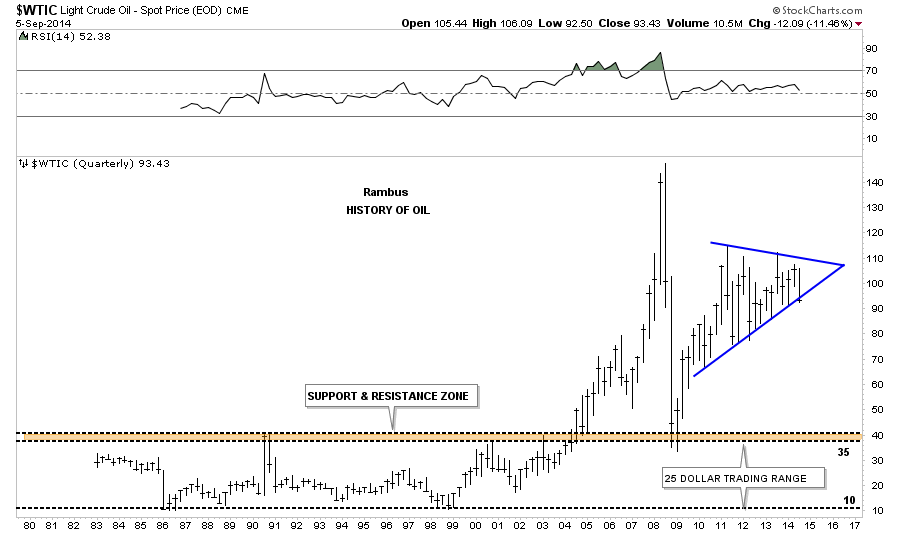
This last chart for Oil shows the entire history for this most important commodity. I’ll let the chart speak for itself.
gg history

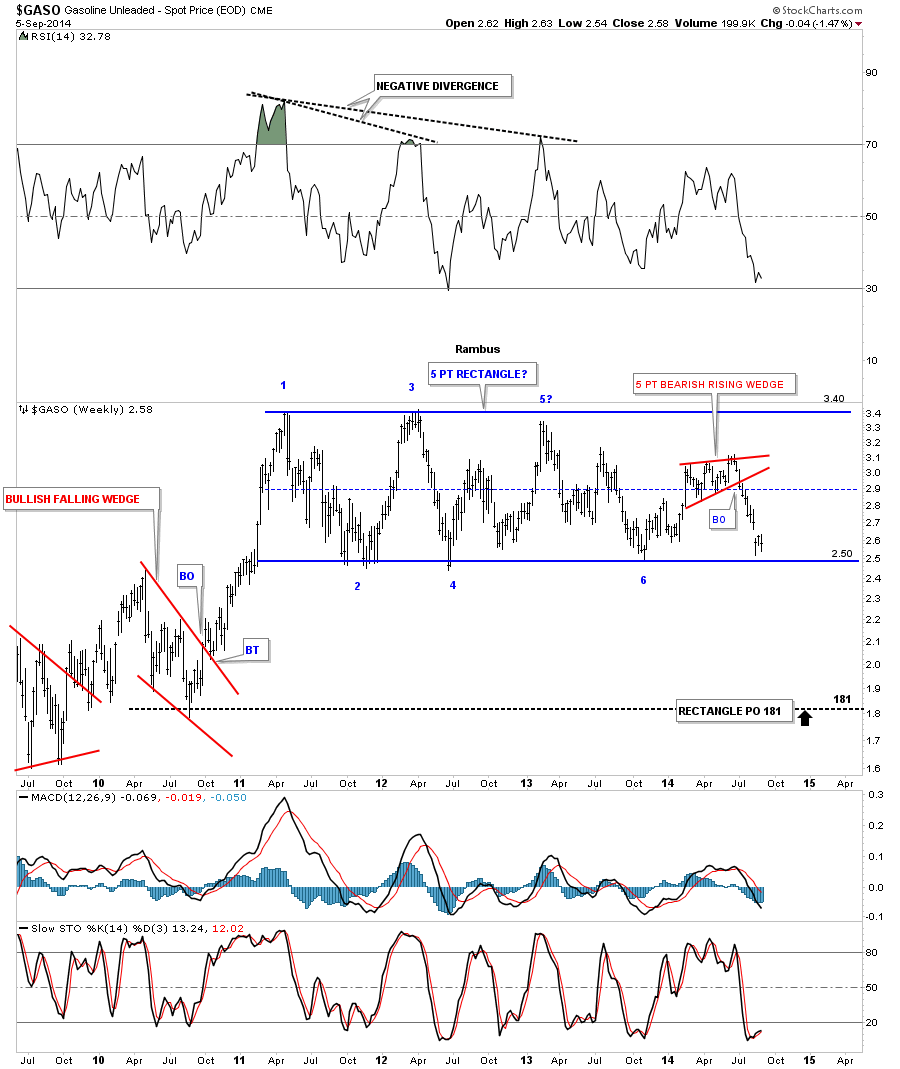
There is one more important chart I would like to show you tonight that is the GASO, gasoline chart. Like so many of the other commodities 2011 marked an important high. GASO has been chopping out a horizontal trading range and is now trading back at the bottom area of the blue rectangle.
GASO

It would be hard to imagine gasoline trading down to the 1.80 area if the blue rectangle breaks down. The same goes for the Oil  that would have a price objective down around the 78 area. With the US dollar showing some important strength and breaking out of a multi year base maybe these price objective are realistic. Until something alters these long term charts I have to put myself in the deflation camp and see how things play out over the next several years. Time always tells the story. All the best…Rambus
US Dollar and Yen Update…

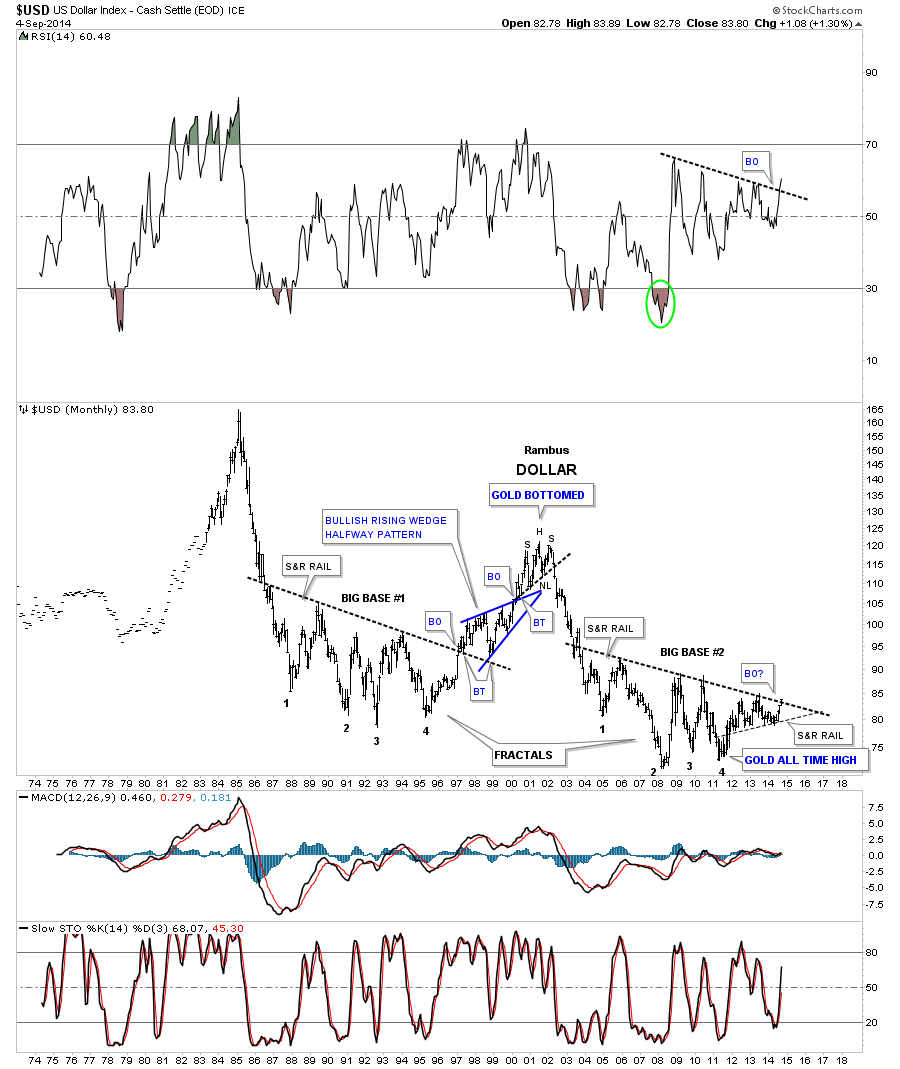
Tonight is a good time to look at some long term charts for the US Dollar and the Japanese Yen. I’ve been waiting for this day for more than a year now when I first created this long term US dollar chart. Some of our long term members will recall this monthly fractal chart that I labeled as having a Big Base #1 and Big Base #2 which are fractals as shown by the numbers on each base. At the time I thought we were ready to breakout above the almost 14 year S&R rail but as you can see the US dollar needed one more small move lower to finish off the big base #2. The breakout doesn’t look very impressive on this bar chart but it is happening.

us dollar big 1 bar

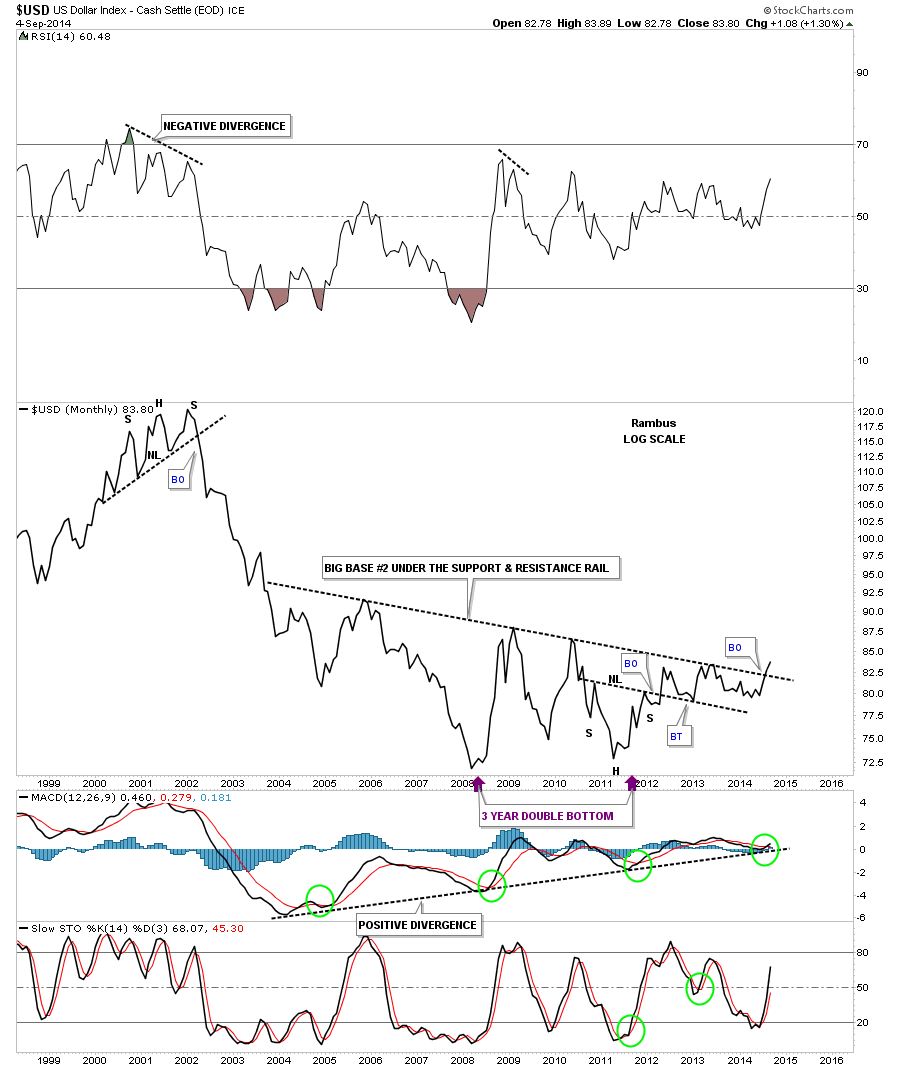
I have shown you many times that a line chart can often times gives you a quicker signal than a bar chart. Below is a monthly line chart that shows Big base #2 with the breakout in progress. Keep in mind this is a monthly line chart so the breakout won’t be complete unless the US Dollar can close the month of September above the big S&R line. It’s a good start to the month.

dollar big base #2

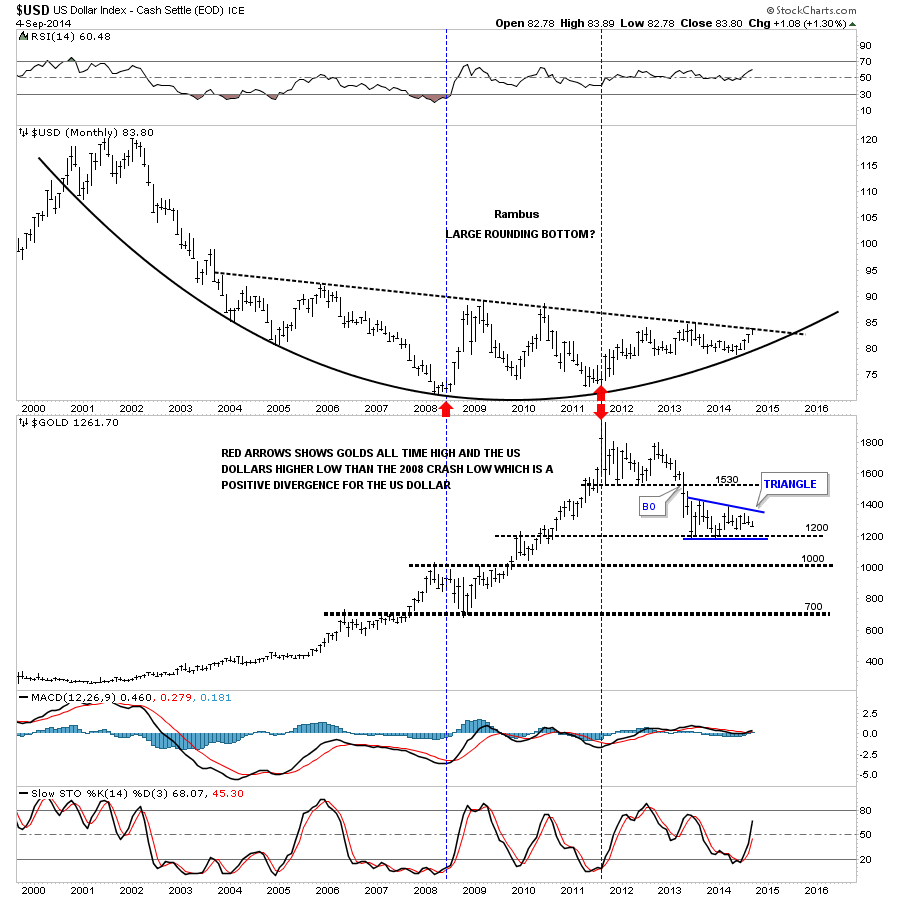
This last long term chart is a combo chart that has the US dollar on top and gold on the bottom. The main point of this chart was to show you the positive divergence the US dollar had vs gold. The red single arrow in 2008 shows how the US dollar was bottoming and gold was in its 2008 crash mode. Note how gold rallied all the way up to it’s bull market high in September of 2011 while the US dollar actually put in a small higher low vs the 2008 low. That’s pretty incredible when you think about it. Gold rallied from roughly 700 to 1920 while the US dollar actually made a higher low during that same time period, double red arrows. It’s easy to lose track of these big monthly charts as it takes a long time for them to come to fruition sometimes but the big picture is most critical to grasp.

aa dollar combo ca

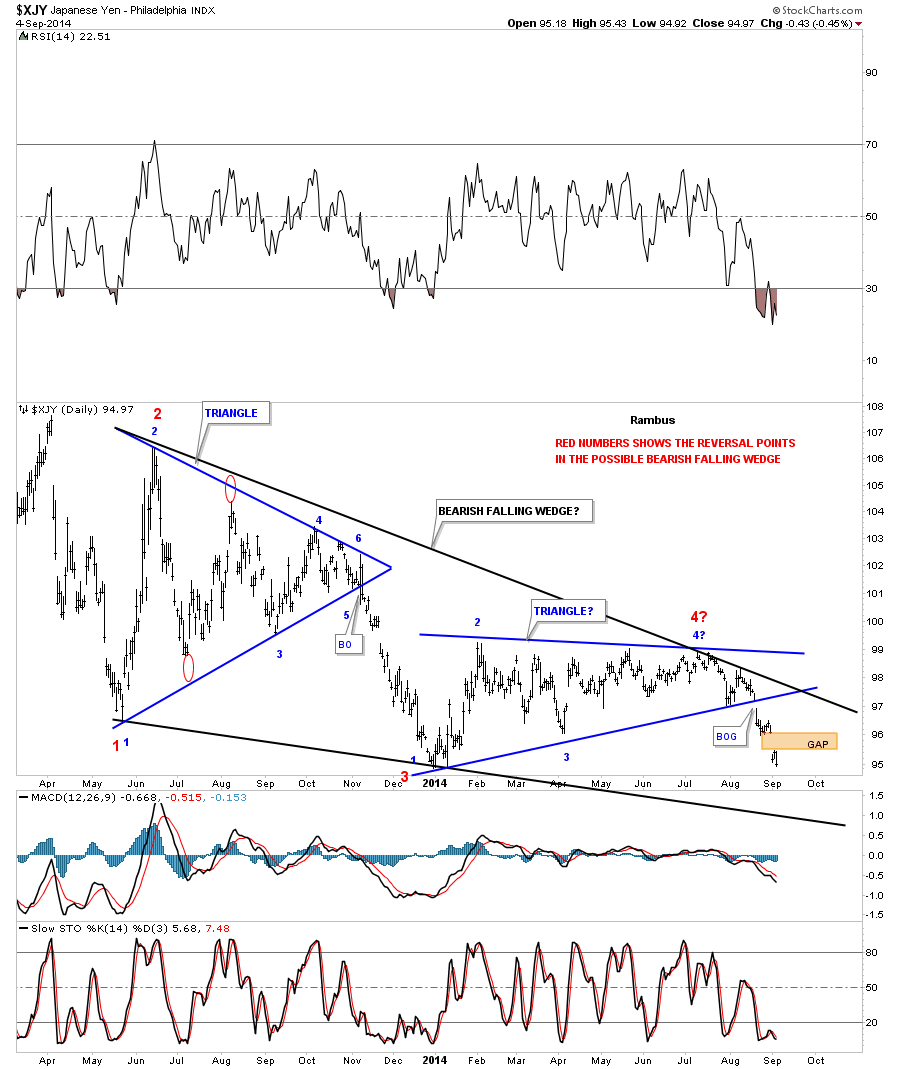
Below is a daily chart for the yen that I showed you a week or two ago and how it broke out of the second blue triangle that is making up the bigger black falling wedge.  After the breakout I thought we might get a backtest to the underside of the blue triangle but it’s beginning to look like that might not be the case now. Please note the brown shaded gap area that appeared this week. I think that gap is going to play a big role in the long term move for the yen which I’ll show you in a minute.

YEN DAILY GAP

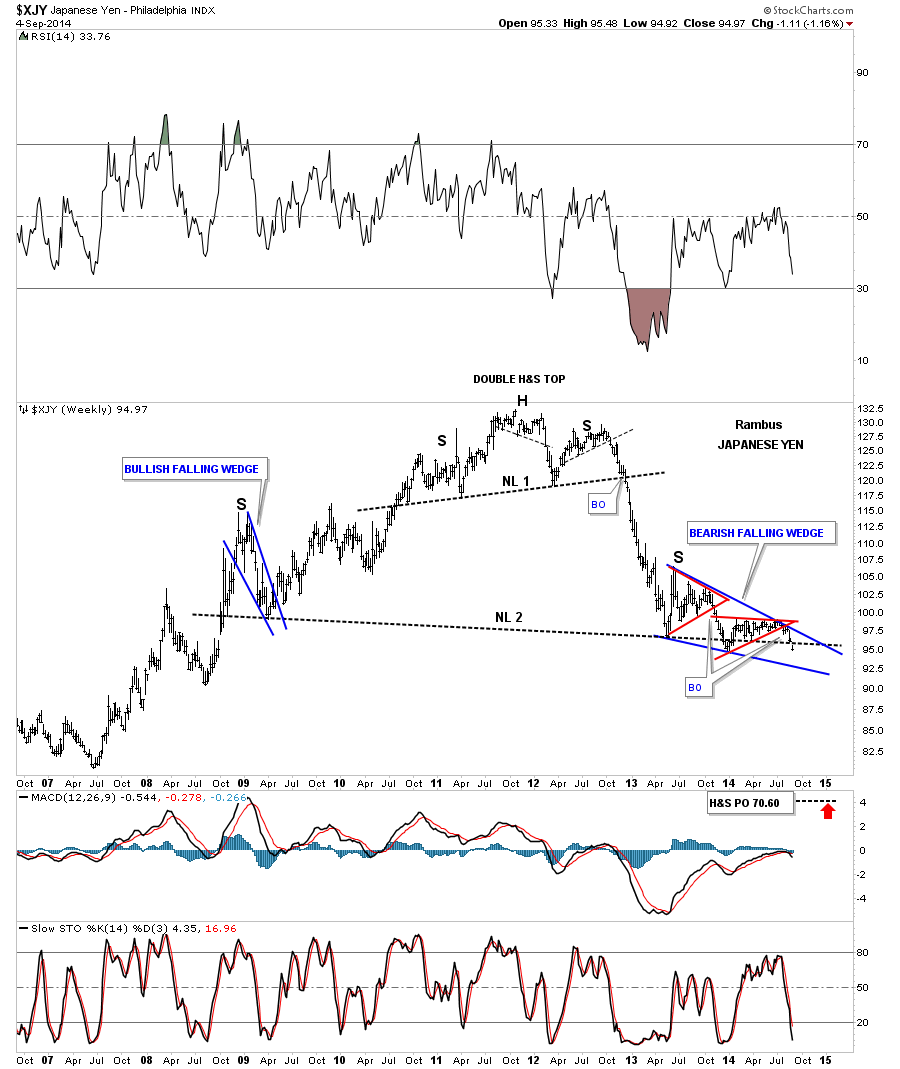
Below is a long term weekly chart that shows the two triangles that are making up the bigger bearish falling wedge which is the right shoulder of the massive H&S topping pattern. Note the last bar on the right hand side of the chart which shows the price action is now trading below the neckline.yen weekly falling wedge

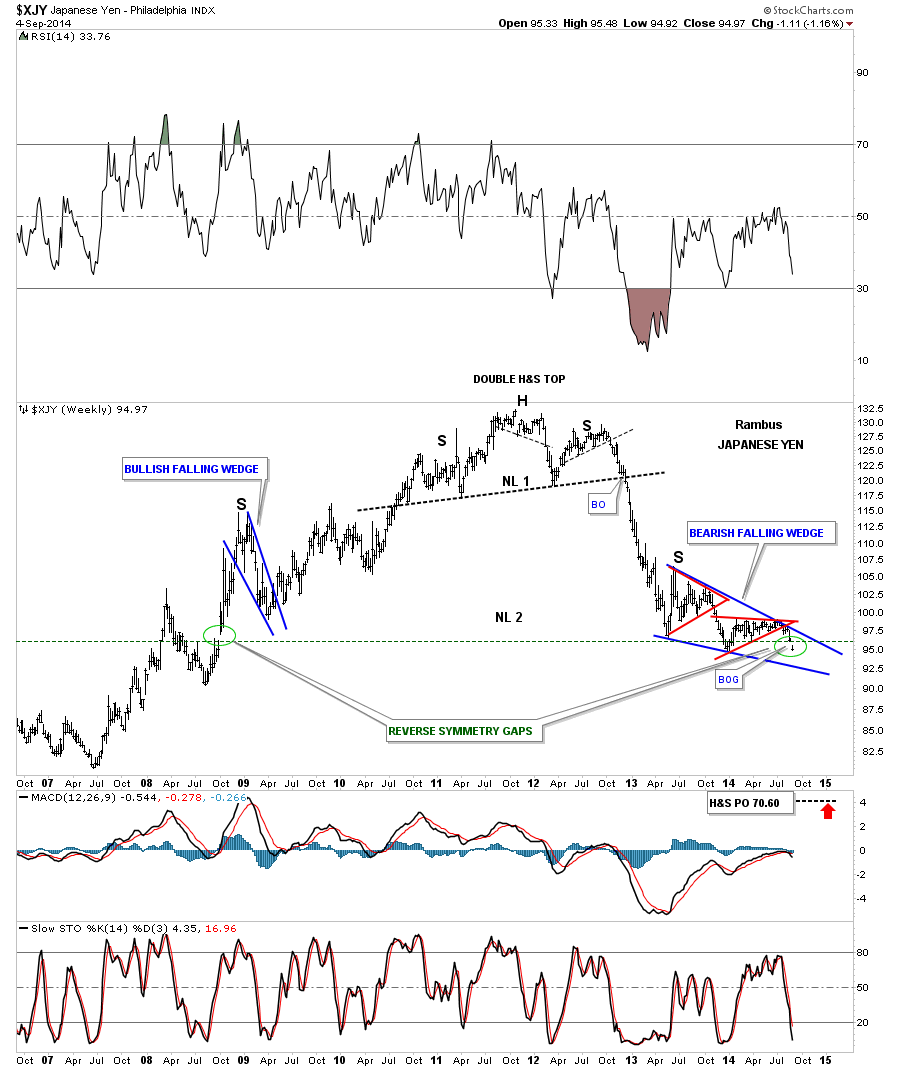
I’m going to show you the exact same chart only this time I’m going to leave the neckline off so you can see more easily the brown shaded breakout gap that is telling us that neckline is hot and that the breakout process is now in progress, green circle. These kind of days don’t come around very often but when we see the US dollar up close to a point and the yen breaking below a multi year H&S neckline, one has to take notice. The implications of today’s price action, in these two important currencies, will have a perfound affect on many markets going forward. Throw the euro in the mix, which looks worse than the yen, and that tells us something big is brewing that we’ll see happening over the coming months. It will be interesting to say the least.

PS: Note the reverse symmetry gap on the left side of the chart. It still blows me away when I see things like this.

ABCD REVERSE SYMMEETRY GAPS