This content is for Yearly and Monthly members only.
Subscribe
Subscribe
Already a member? Log in here

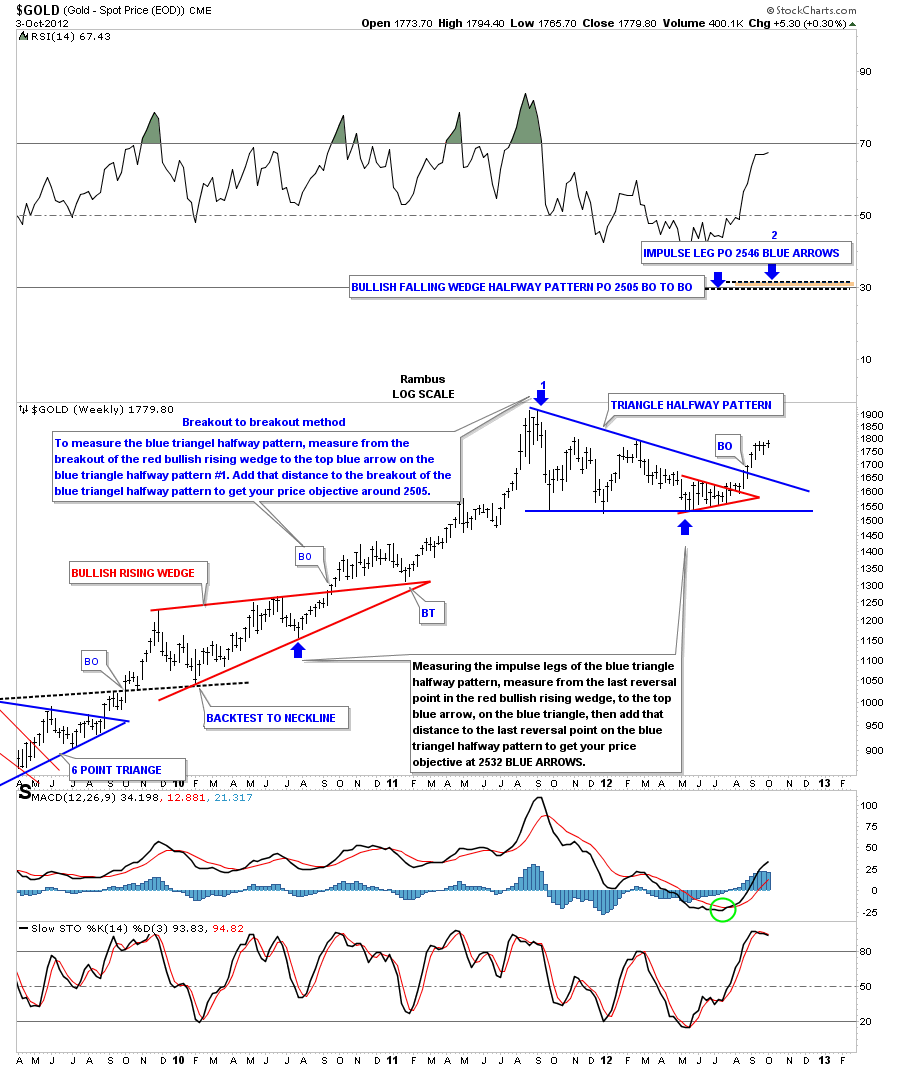
Tonight I want to show you my long term price objective for this next impulse leg higher for gold.This would be of the intermediate term variety. There are two ways I measure for price objectives. The first one is what I call the breakout to breakout method. To get your price objective you have to have two confirmed consolidation patterns in which to make your measurements. With this method I measure from the breakout of the lower consolidation pattern to the top of the current consolidation pattern. In this case the blue arrow with the #1 above it. I use the Fibonacci tool to measure the distance. Then you take that measurement from the breakout of the red bullish rising wedge to the top blue arrow with the #1 above and add that distance to the breakout of the blue triangle, our current consolidation pattern. This method gives us a price objective up to 2505 on the chart below.
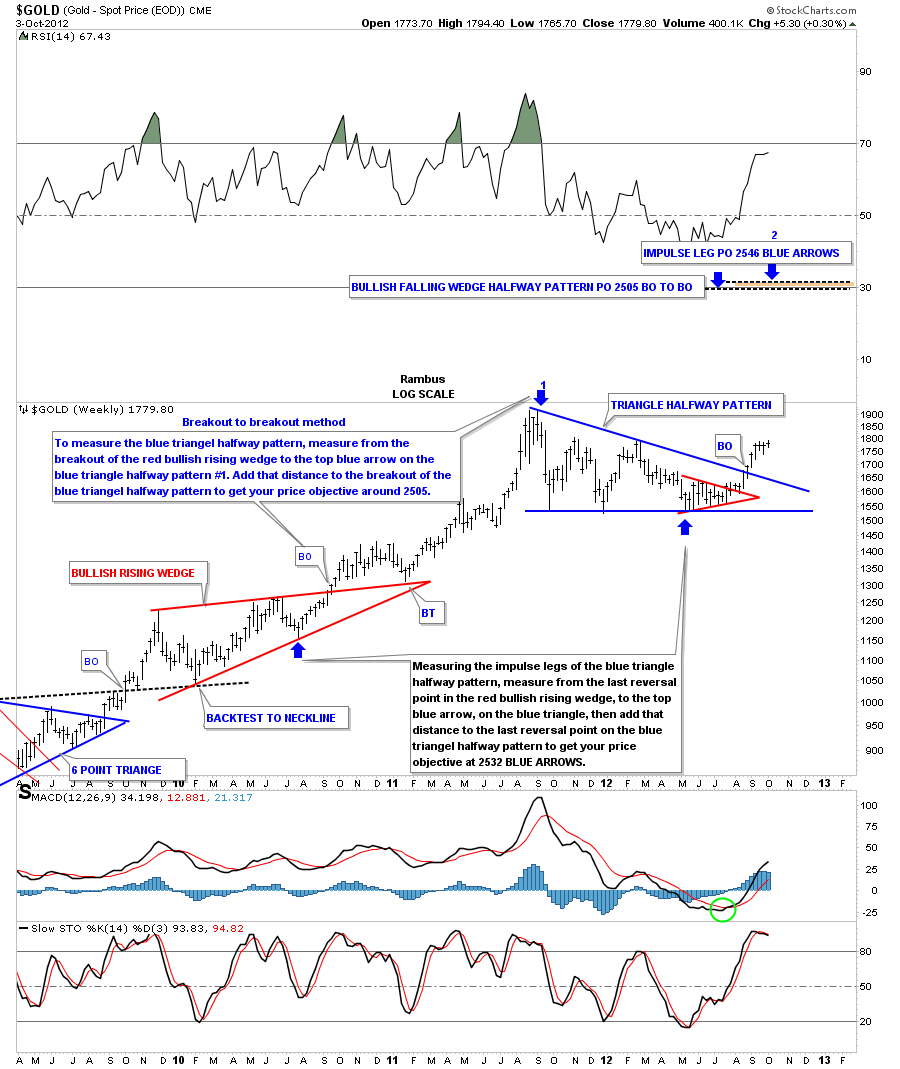
Sticking with the same chart above lets look at another way to measure for a price objective. This method measures each impulse leg starting with the lower consolidation pattern, in this case the red bullish rising wedge. I always take the last reversal point in the lower consolidation pattern to start the measurement for the impulse leg, blue arrow. The impulse leg we are measuring starts with the blue arrow at the last reversal point in the red bullish rising wedge to the blue arrow with the number 1 above it. That is an impulse leg. Next, you take that measurement and add it to the last reversal point in the higher consolidation pattern, blue arrow. This method has a price objective up to 2546 for impulse leg #2. As you can see on the chart below that leaves our current blue triangle showing as a halfway pattern forming halfway between the two impulse legs number one and two. The brown shaded area, at the very top of the chart, shows how close these two completely different ways to measure a price objective come out very close together. Note this only a guide as sometimes a stock may go higher or not as high and sometimes they hit the price objective dead on the money. When we get up to the 2500 area I’ll be looking for some exhaustion and some type of reversal pattern such as a double top or H&S top to complete the impulse leg.
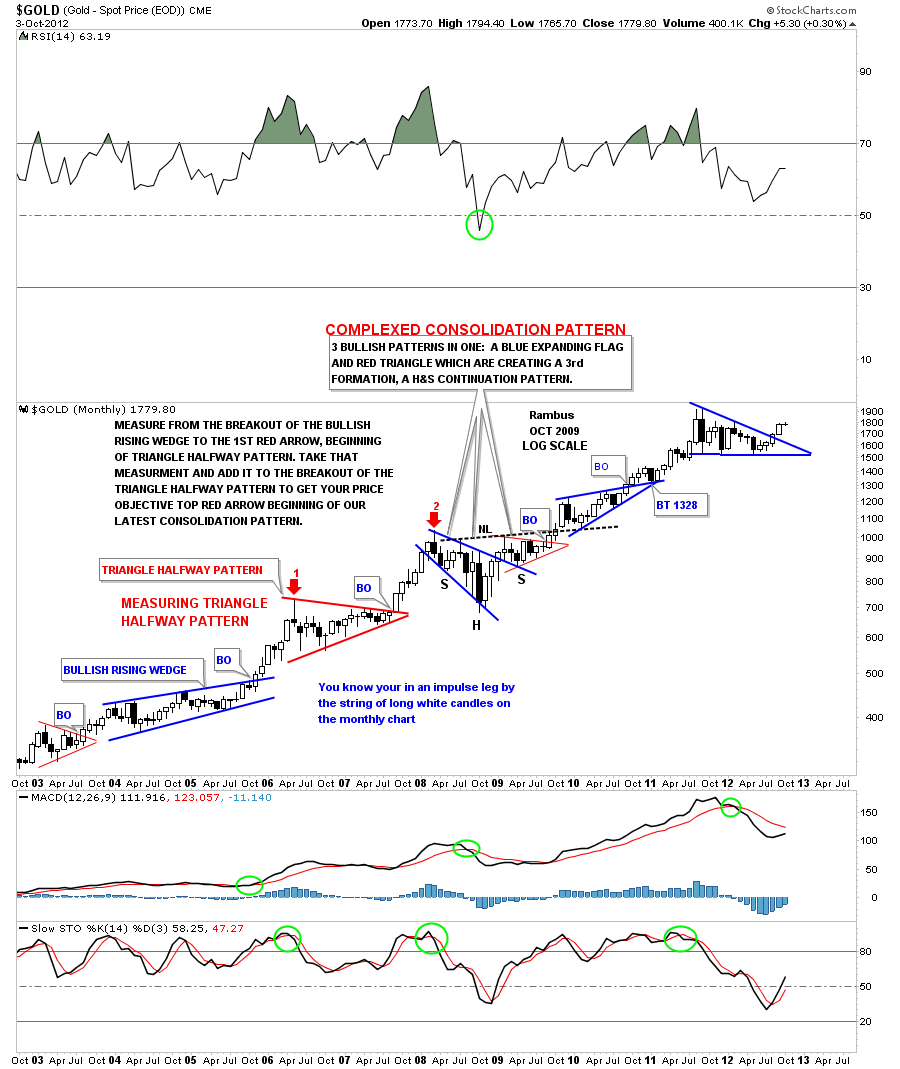
Below is a monthly chart for gold that goes back to 2003. Note the blue bullish rising wedge that formed in 2004 and 2005. I used the breakout to breakout method to nail the price objective for the 2008 high that came in just before the big crash started. The red triangle is your halfway pattern. Just measure from the breakout from the bullish rising wedge to the top of the red triangle halfway pattern, red arrow number one. Take that measurement and add it to the breakout of the red triangle to get your price objective red arrow number two. Note all the white candles for each impulse legs for number one and number two, red arrows.
Once gold breaks out to new all time highs we will have a road map to help guide us through some of the smaller corrections that will show up along the way. If we are in a true impulse leg higher the corrections will be short and sweet but will be painful when your living through them similar to what we’ve been experiencing over the last three weeks. The higher gold goes the harder it will be to stay on the bull as each pullback will affect you emotionally until you can’t take it any longer. You will come up with many good excuses to sell along the way. That’s just the way markets work. If it was easy everybody would be filthy rich which we know that can’t happen in the markets. Only a small percentage of investors become filthy rich. All the best…Rambus
EDITOR’S NOTE :
Rambus Chartology is Primarily a Goldbug TA Site where you can watch Rambus follow the markets on a daily basis and learn a great deal of Hands on Chartology from Rambus Tutorials and Question and Answeres .
Most Members are Staunch Goldbugs who have seen Rambus in action from the 2007 to 2008 period at www.goldtent.org and now Here at Rambus Chartology since early 2012 .
To review his Work and incredible calls from the 2007-2008 period click on the top right sidebar in the “Wizard of Rambus” ….”What If !!” Post
To Follow Rambus Unique Unbiased Chart Work and participate in a Chartology Form with questions and answeres and learn the Art and Science and Mindset of a Pro Trader please Join us by subscribing monthly for $29.99 at
www.rambus1.com
We have many subscribers from all over the world who are glad they did as they enjoy the many daily updates and commentaries provided at this exciting new site
As you will see Rambus (Dave) has prepared us for this difficult period by being one of the only ones to see and warn about this incredibly debilitating PM smackdown as early as Jan 2 2012 …click on the” HUI Diamond in the Rough” Post in the “Wizard of Rambus” top right
More Recently Rambus called a Bottom in HUI in this post…and has subscribers on board for a Powerful Run to the Upside
http://rambus1.com/?p=5651
What is he seeing Now ?
You will find Rambus to be a calm humble down home country tutor with an incredible repitoir of all the TA based protocols tempered with his own one of a kind style…simply put…He wants to keep his subscribers on the right side of these crazy volitile and downright dangerous markets
See you at the Rambus Chartology
…………………….
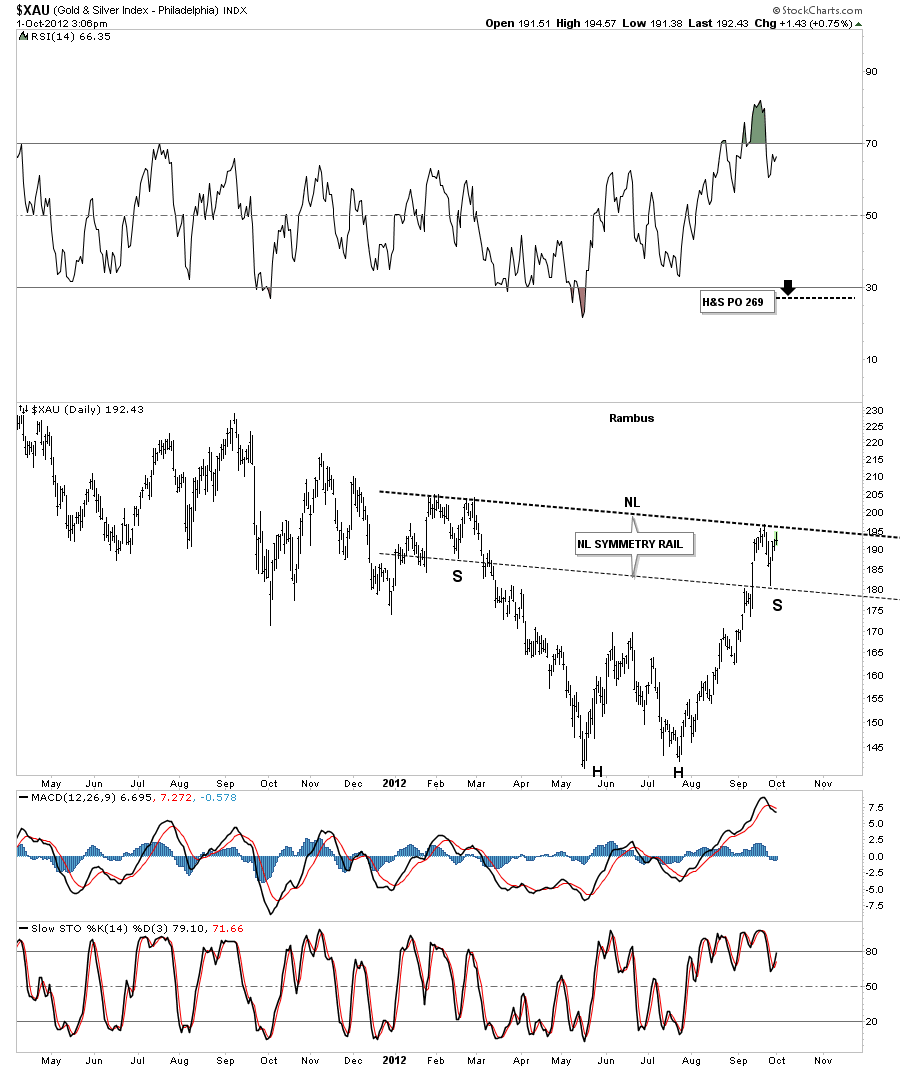
The XAU has one of the cleanest charts of the precious metals stock indexes in that the double bottom was very symmetrical, both bottoms were very close to the same low. It also had very nice reverse symmetry in this last rally off the second bottom. That brings us up to speed on the reason for this post. On the chart below I’ve drawn in a possible inverse H&S bottom with the head portion being the double bottom. I’ve also added a neckline symmetry rail that so far nailed the low for the possible right shoulder. I have shown you before how I use a neckline symmetry rail to look for an area that might form the bottom of the right shoulder. Sometimes they can hit dead on the money like this XAU chart and sometimes the low for the bottom of the right shoulder may be higher or lower. It just gives us a rough estimate, if one is looking for a H&S pattern, to look for some symmetry to the left shoulder. What I’ll be watching very close is how we interact with the neckline which will give us some important clues if I’m right about the potential game changer. This will show up in the other precious metals stock indexes as well.
EDITOR’S NOTE :
Rambus Chartology is Primarily a Goldbug TA Site where you can watch Rambus follow the markets on a daily basis and learn a great deal of Hands on Chartology from Rambus Tutorials and Question and Answeres .
Most Members are Staunch Goldbugs who have seen Rambus in action from the 2007 to 2008 period at www.goldtent.org and now Here at Rambus Chartology since early 2012 .
To review his Work and incredible calls from the 2007-2008 period click on the top right sidebar in the “Wizard of Rambus” ….”What If !!” Post
To Follow Rambus Unique Unbiased Chart Work and participate in a Chartology Form with questions and answeres and learn the Art and Science and Mindset of a Pro Trader please Join us by subscribing monthly for $29.99 at
www.rambus1.com
We have many subscribers from all over the world who are glad they did as they enjoy the many daily updates and commentaries provided at this exciting new site
As you will see Rambus (Dave) has prepared us for this difficult period by being one of the only ones to see and warn about this incredibly debilitating PM smackdown as early as Jan 2 2012 …click on the” HUI Diamond in the Rough” Post in the “Wizard of Rambus” top right
More Recently Rambus called a Bottom in HUI in this post…and has subscribers on board for a Powerful Run to the Upside
http://rambus1.com/?p=5651
What is he seeing Now ?
You will find Rambus to be a calm humble down home country tutor with an incredible repitoir of all the TA based protocols tempered with his own one of a kind style…simply put…He wants to keep his subscribers on the right side of these crazy volitile and downright dangerous markets
See you at the Rambus Chartology
In this weekend report I want to show you the chartology of gold focusing in on the last year of trading that takes in the all time high made last year about this time at 1920. After the all time high was made it only took alittle over a month for gold to correct almost 400 points down to the 1535 area. That correction was about as violent as they come. Alot of times when you see a panic decline like that it can mark the low for the consolidation area that tends to form if the bull market is still intact. On the chart below you can see that is exactly what happened. That panic low has held for close to a year now with two more touches, one in December of 2011 and one last touch in May of this year points three and five.
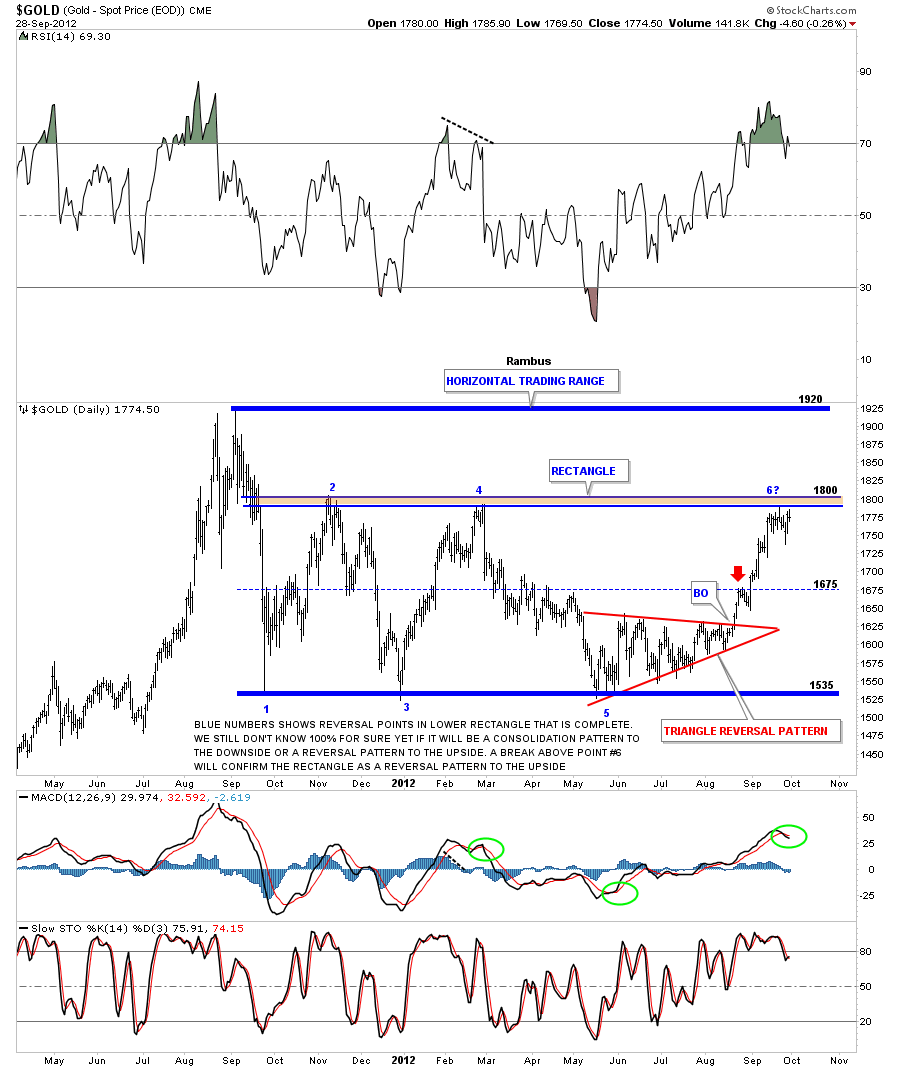
On the chart above you can see the big horizontal trading range that gold has produce since it’s bull market high at 1920. There are several possible chart patterns that could play out as this one year consolidation area matures. On the lower 2/3’s of the chart I have marked the number of reversal points on the rectangle from one to 6?. That rectangle is a completed pattern and gold is now trading at the top rail at roughly 1800, point 6? This is the most important area for gold right now as it has completed the 5th reversal point that puts this consolidation area in the reversal pattern category. Because the rectangle has formed below the all time high we have to see some type of reversal pattern to reverse the trend from down to up. The odd numbered 5 point rectangle fits the bill. Gold has to take out the 1800 top rail to confirm the rectangle as a reversal pattern. Until that happens gold is still working within the confines of the big rectangle.
The next chart focuses in on some of the internal makeup of the rectangle that has been building for close to a year now. The last pattern that was built, within the rectangle, was the blue triangle reversal pattern that strongly suggested, at the time, that gold would move up to test the top rail of the rectangle, which it has done. Again you can see how important the top rail of the rectangle is at 1800. Gold has been chopping around just below the all important trendline for close to two weeks now.
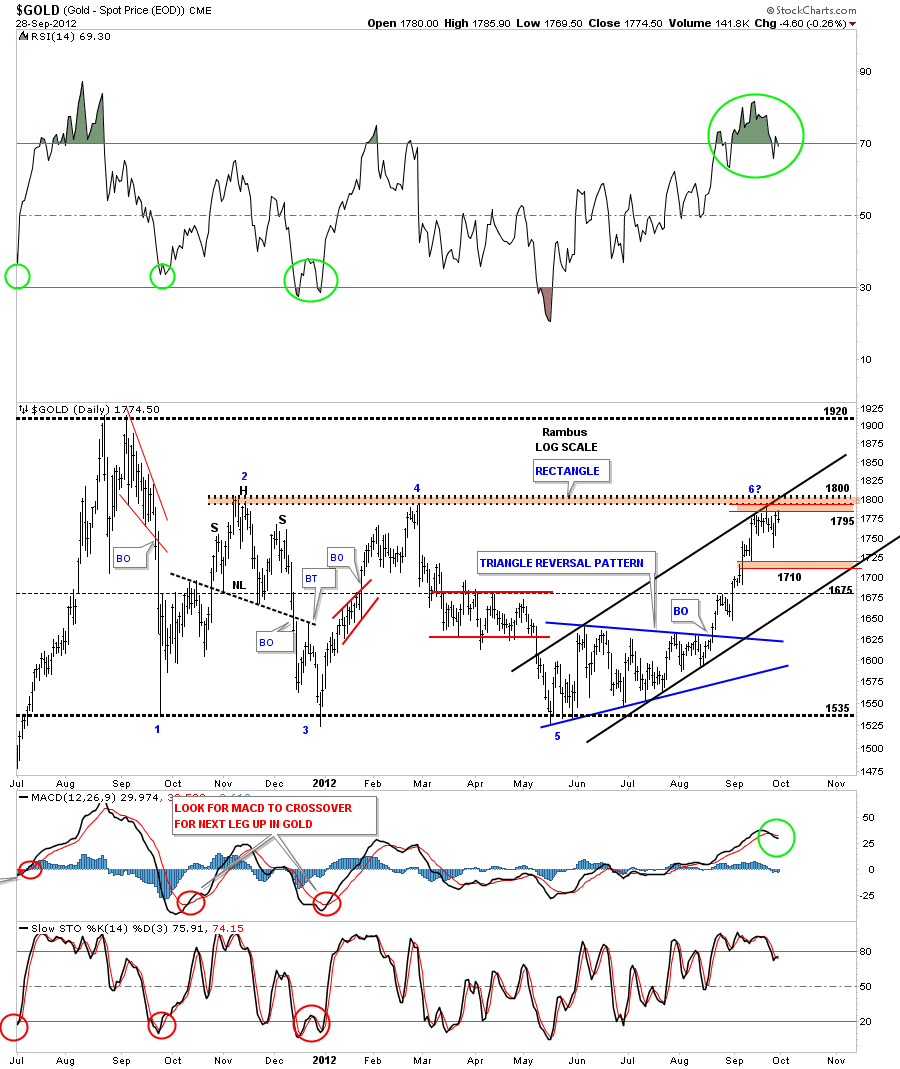
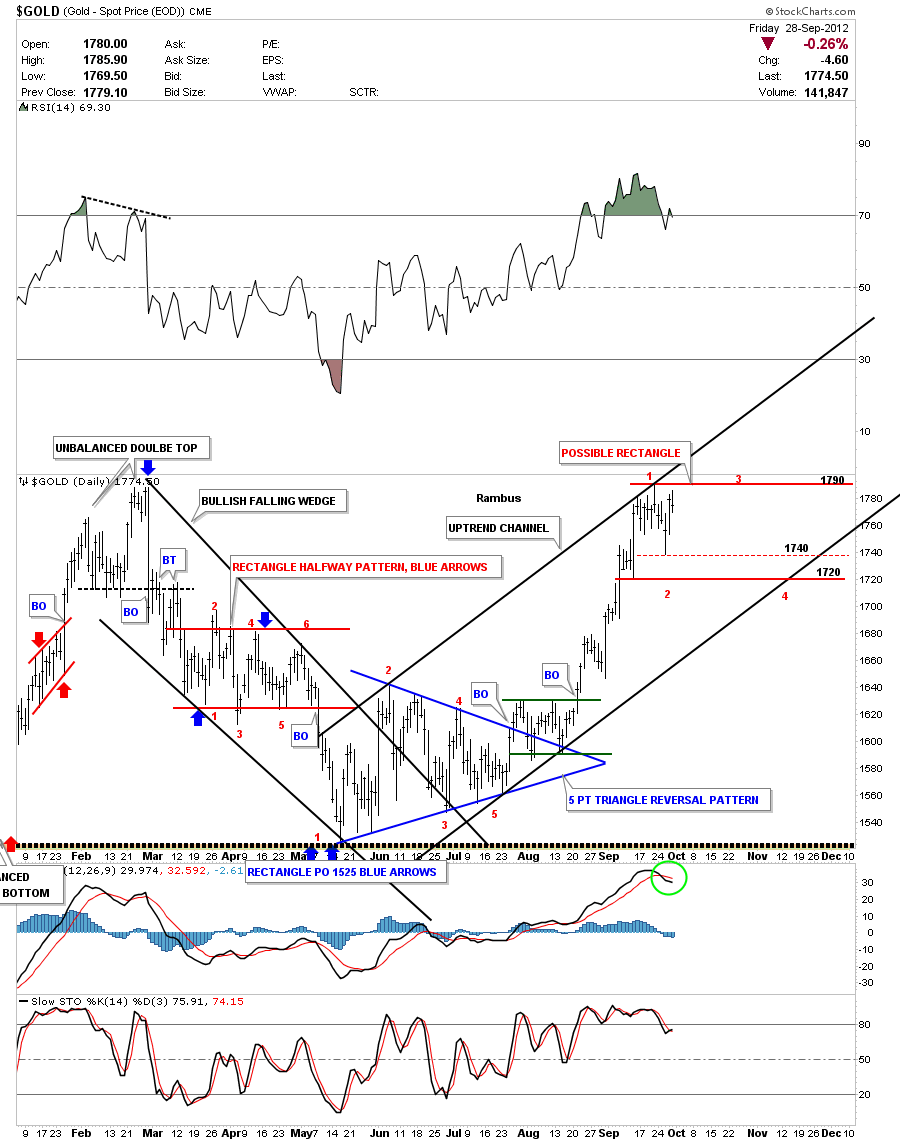
Lets now look at the last nine months of price action within the big rectangle that shows the previous leg down and our current leg up. The last decline took on the formation of a bullish falling wedge with a red rectangle that formed as a halfway pattern to the downside. From that low at 1535 gold then went on to form that all important 5 point blue triangle reversal pattern to the upside. As you can see on the chart below the last rally was very strong when it reached the top of the rectangle at 1800 or so. That put the RSI indicator, at the top of the chart, in overbought territory. What I would like to see and would be good for gold is to work off some of the overbought condition by trading sideways just below the the all important 1800 area. Its still way too early to know if this is what will happen but I’ve marked a possible trading range, red horizontal trendlines, that could allow gold to chop around for another month and work off some of the overbought condition that would be very healthy and not hurt the overall bullish look of the chart.
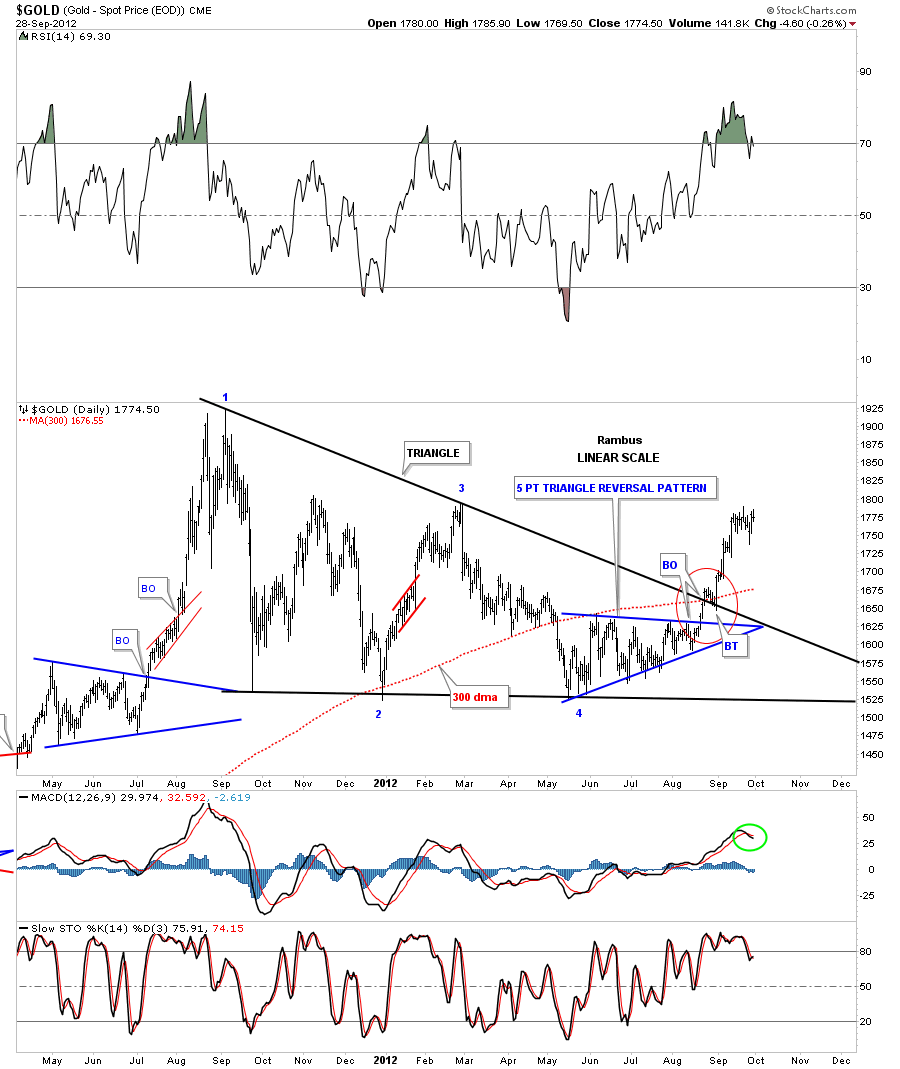
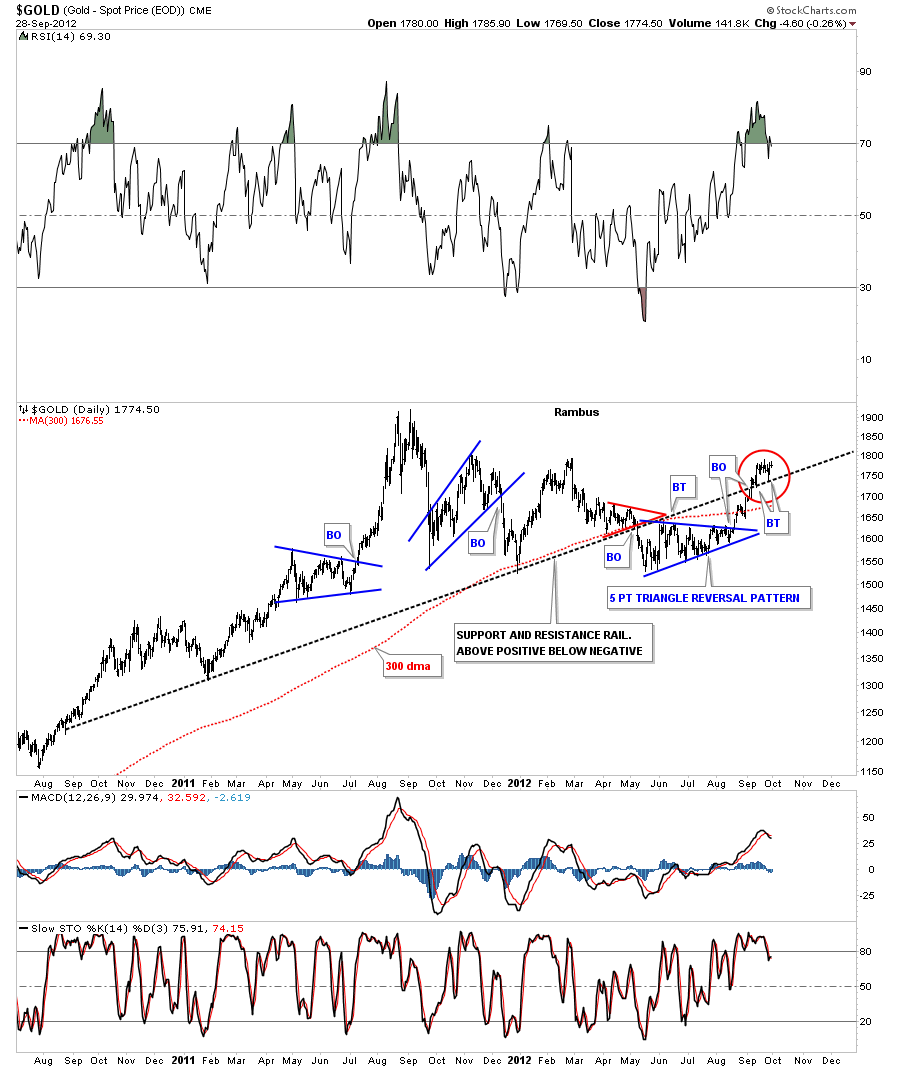
What I’ve shown you so far had been the horizontal trading range gold has been in since the 1920 high made last year. There is another possible important chart pattern that is in play also and that is the big black triangle consolidation pattern on the chart below. The red circle shows the breakout and backtest to the top rail of the triangle and the 300 dma which was most important. As you can see the most recent price action is now trading just below the all important 1800 area that is the top rail of the rectangle that I showed you on the charts above. So, anyway you look at it 1800 is still the most important number to keep your eyes on.
There was an important development for gold that has a support and resistance rail that stretches all the way back to August of 2010. The simplest way to view support and resistance rails like this is, when the price action is trading above, things are positive and when below, is negative. As you can see on the chart below this S&R rail has reversed its role from support and then when gold broke below it it acted as resistance. The blue five point triangle reversal pattern gave gold enough energy to break back above that important support and resistance rail. The red circle shows gold breaking back above the S&R rail with two small backtest from the topside. As long as gold can trade above that S&R rail it will remain positive.
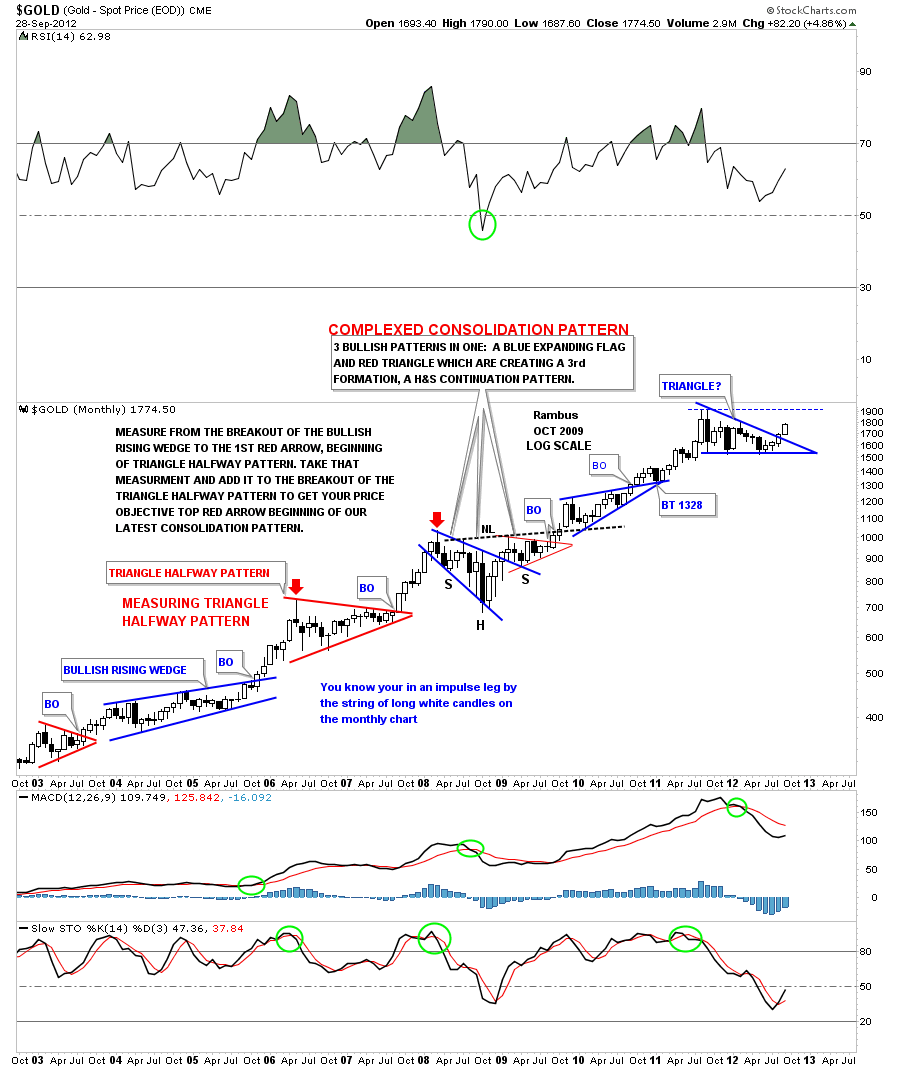
This last chart for gold is a long term look using candlesticks. When gold has a positive month you will see a white candle and when it has a negative month you will see a black candle. When you start a new impulse leg up you will see a string of white candles. That helps me confirm the move is impulsive in nature. As you can see on the chart below we have four white candles in a row right now. So gold is off to a good start if it can string together a few more white candles before we see a black one.
Gold has had a strong rally after breaking out from the 5 point triangle reversal pattern back in late August. The price has now risen to the top of the horizontal resistance rail, of the rectangle, at 1800. When you see 1800 taken out to the upside you will know gold is strong and the next point of resistance will be the all time high at 1920. Gold could very easily chop around for several weeks to a month before the actual breakout occurs to relive some of the overbought condition. That would not hurt the overall bullish situation gold is now in. All the best…Rambus
………………..
EDITOR’S NOTE :
Rambus Chartology is Primarily a Goldbug TA Site where you can watch Rambus follow the markets on a daily basis and learn a great deal of Hands on Chartology from Rambus Tutorials and Question and Answeres .
Most Members are Staunch Goldbugs who have seen Rambus in action from the 2007 to 2008 period at www.goldtent.org and now Here at Rambus Chartology since early 2012 .
To review his Work and incredible calls from the 2007-2008 period click on the top right sidebar in the “Wizard of Rambus” ….”What If !!” Post
To Follow Rambus Unique Unbiased Chart Work and participate in a Chartology Form with questions and answeres and learn the Art and Science and Mindset of a Pro Trader please Join us by subscribing monthly for $29.99 at
www.rambus1.com
We have many subscribers from all over the world who are glad they did as they enjoy the many daily updates and commentaries provided at this exciting new site
As you will see Rambus (Dave) has prepared us for this difficult period by being one of the only ones to see and warn about this incredibly debilitating PM smackdown as early as Jan 2 2012 …click on the” HUI Diamond in the Rough” Post in the “Wizard of Rambus” top right
More Recently Rambus called a Bottom in HUI in this post…and has subscribers on board for a Powerful Run to the Upside
http://rambus1.com/?p=5651
What is he seeing Now ?
You will find Rambus to be a calm humble down home country tutor with an incredible repitoir of all the TA based protocols tempered with his own one of a kind style…simply put…He wants to keep his subscribers on the right side of these crazy volitile and downright dangerous markets
See you at the Rambus Chartology
…………………….