This content is for Yearly and Monthly members only.
Subscribe
Subscribe
Already a member? Log in here

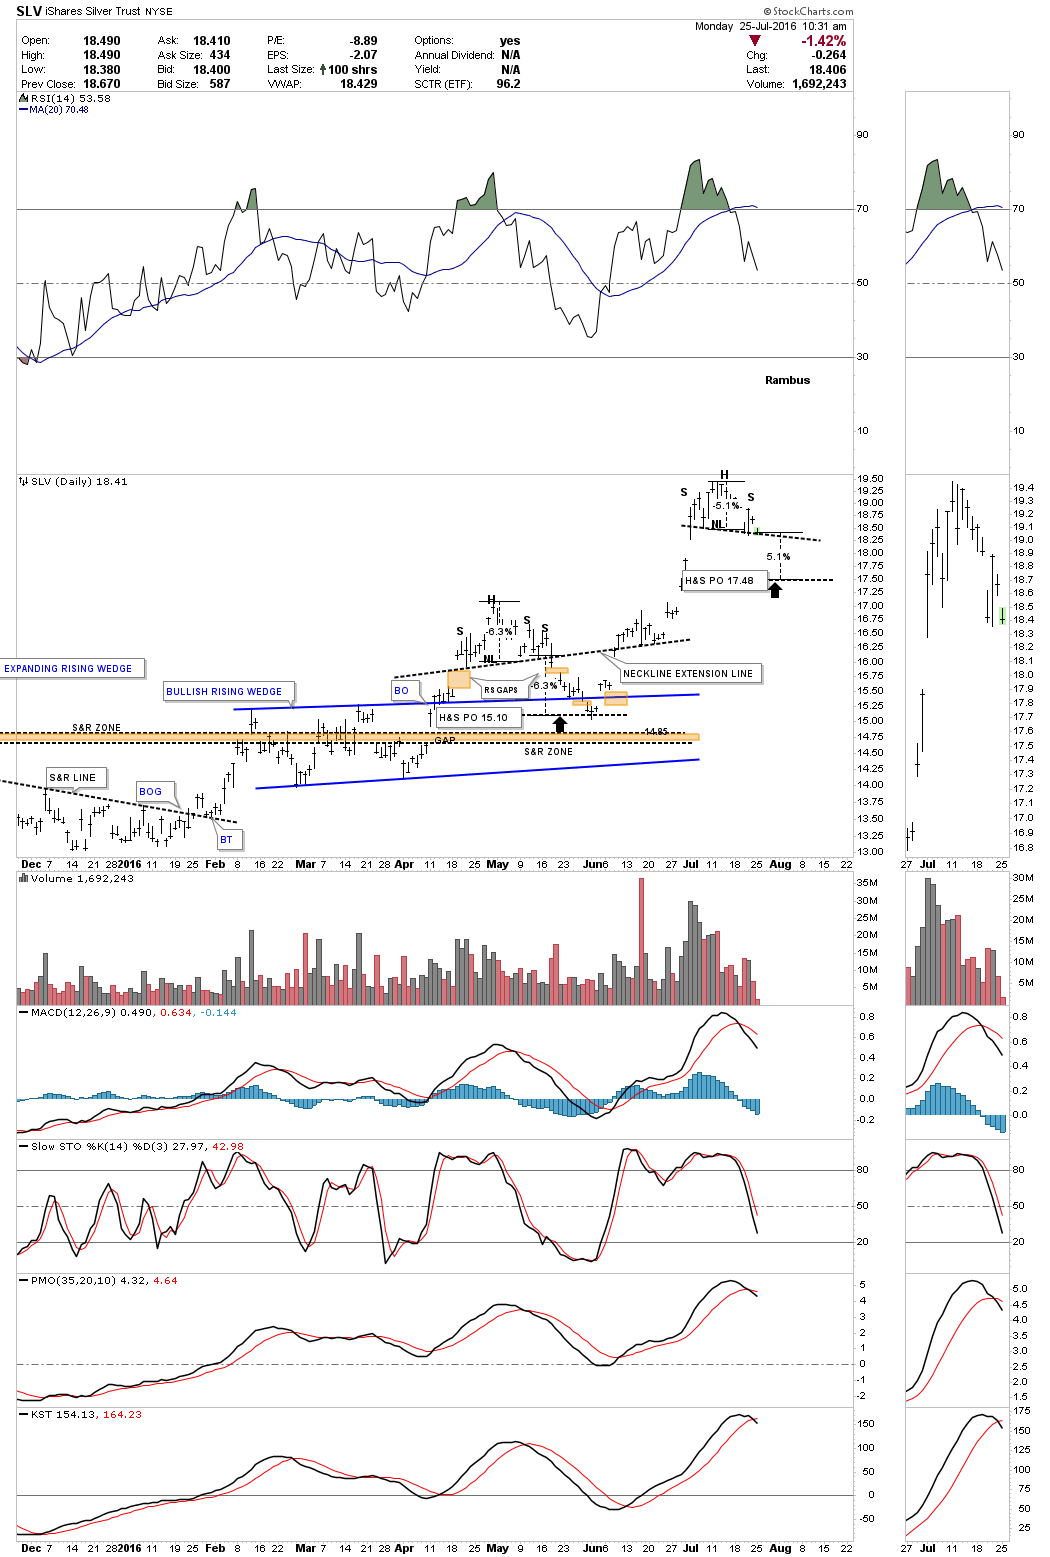
It looks like SLV is forming a small H&S top similar to the one it formed back in May of this year. The minimum price objective for this H&S would be a measured move down to 17.48.
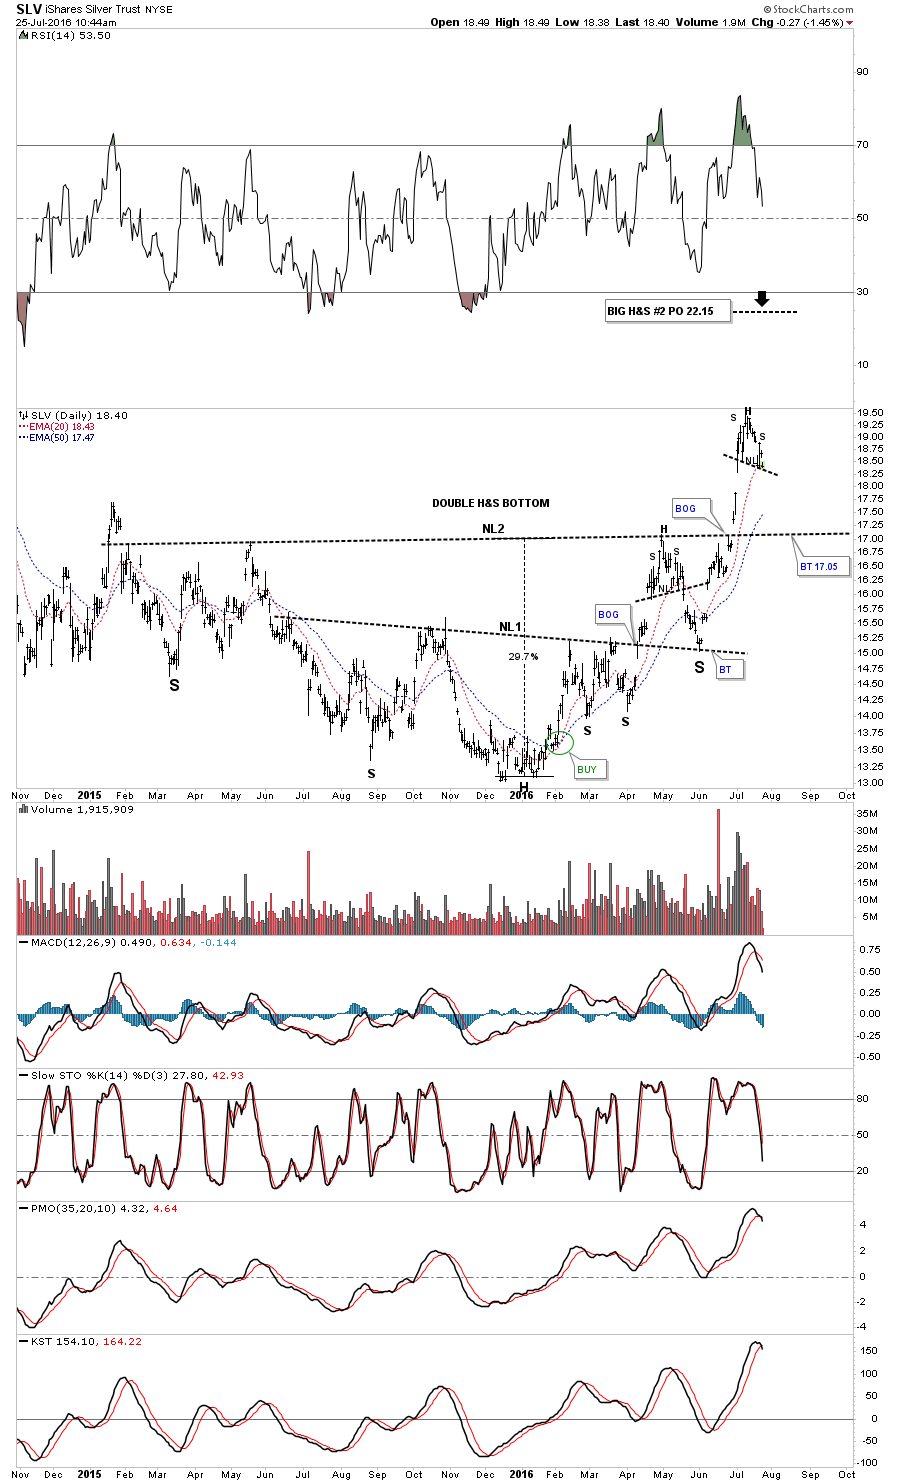
The long term daily chart for SLV shows the big double H&S bottom. Note the small H&S top that formed at the May high which led to the backtest to neckline #1. A backtest to neckline #2 would come in around the 17.05 area. This is where one needs to decide if they want to play the swings or hold on for the intermediate to longer term ride with a portion of your trading capital. SLV has a well defined breakout point and price objective if one chooses to try a short position. Just don’t get greedy.
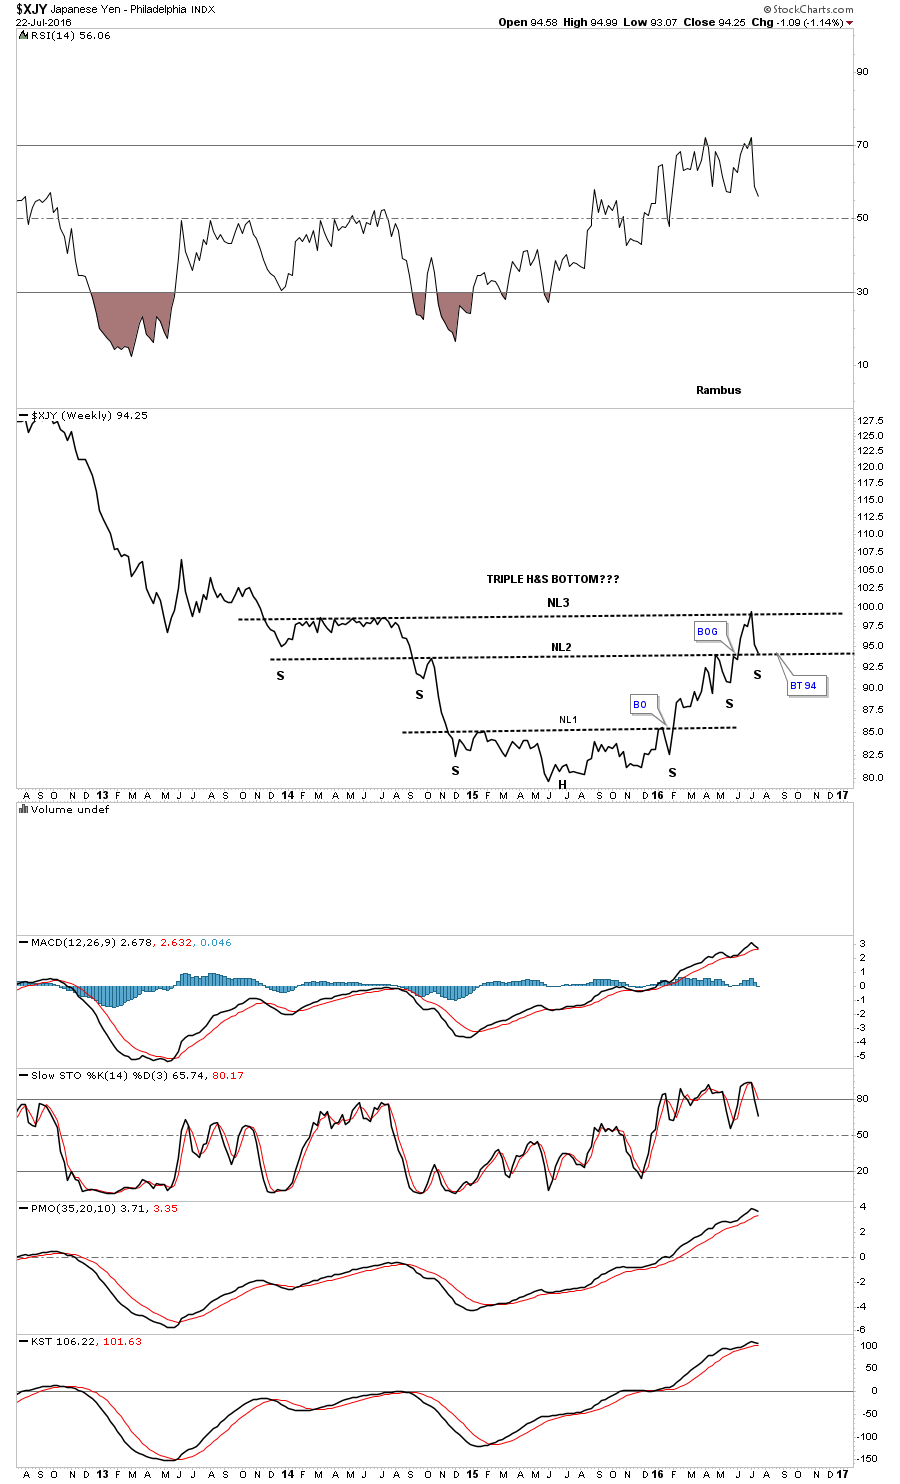
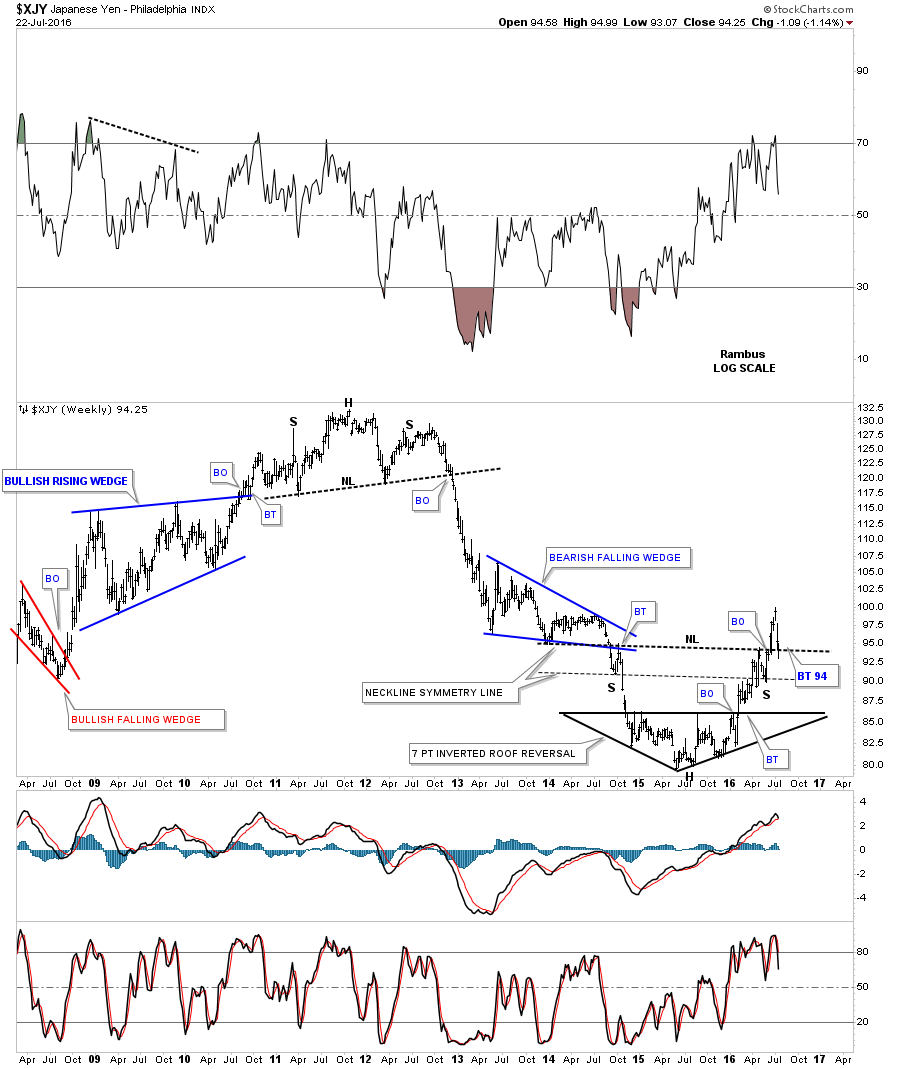
This week the Japanese Yen backtested neckline #2 of a possible triple H&S bottom at the 94 area. Below is a weekly line chart which shows the price action closed right on the neckline. To say this weeks backtest was critical is an understatement. How the yen goes so does gold for the most part.
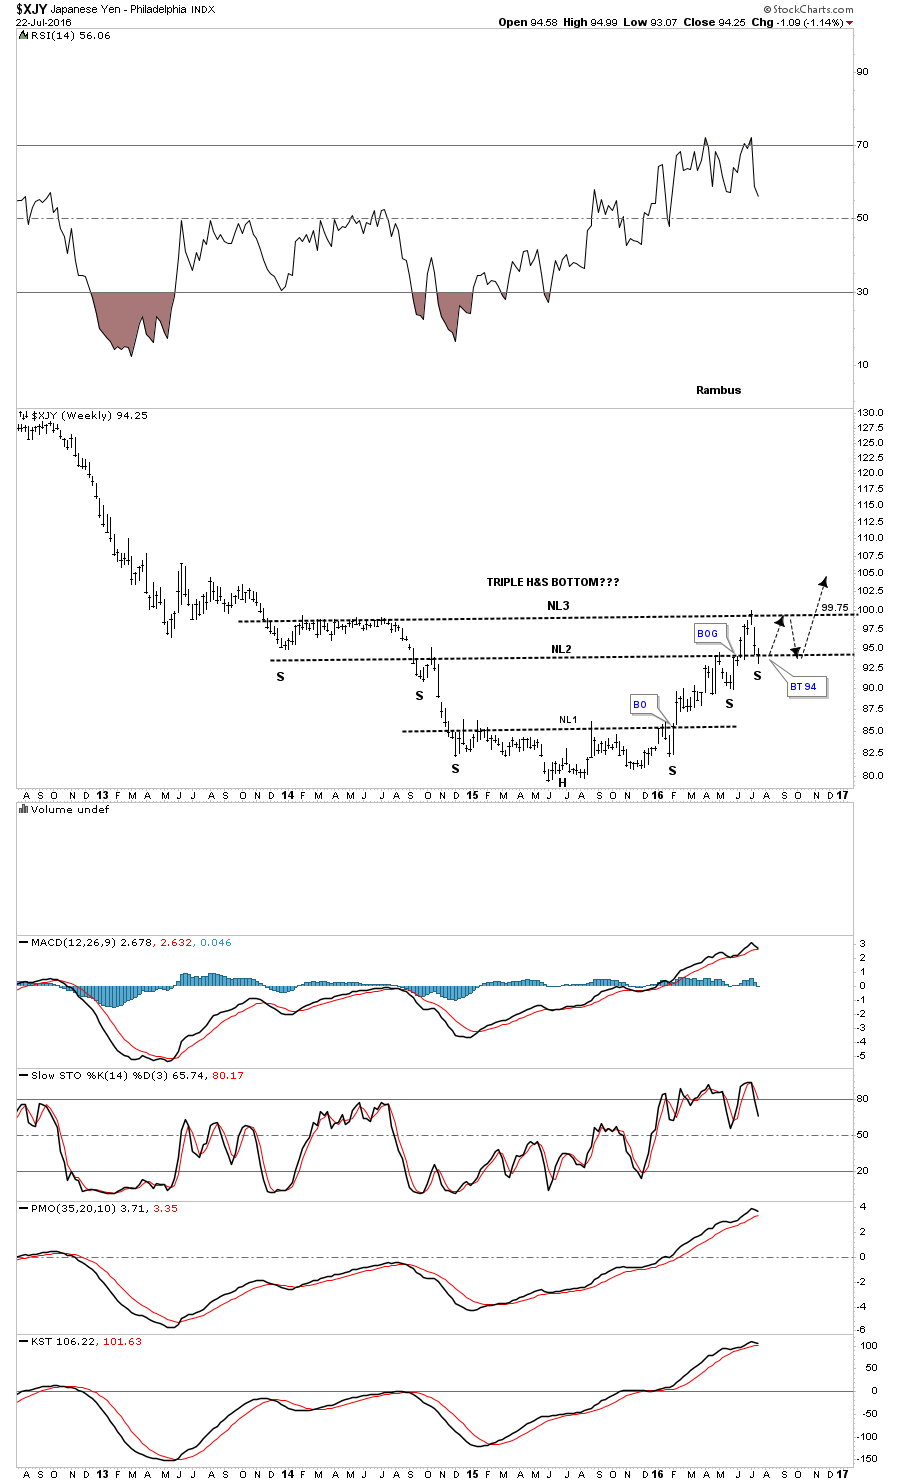
Below is the exact same chart as the one above except it’s a bar chart that shows the subtle differences. The reason this backtest is so important, is because if neckline #2 holds support then the low for the third right shoulder will have formed. Reverse symmetry suggests we could see a ping pong move between neckline #2 and neckline #3 as shown by the black arrows, before we see a resolution to this 2 1/2 year pattern. The yen has made a series of higher highs and higher lows since the head was put in place a year ago.
This next long term weekly chart shows a pretty symmetrical H&S bottom as shown by the neckline symmetry line which shows the low for the left and right shoulders. The backtest this week was a little sloppy but so far the neckline is holding support.
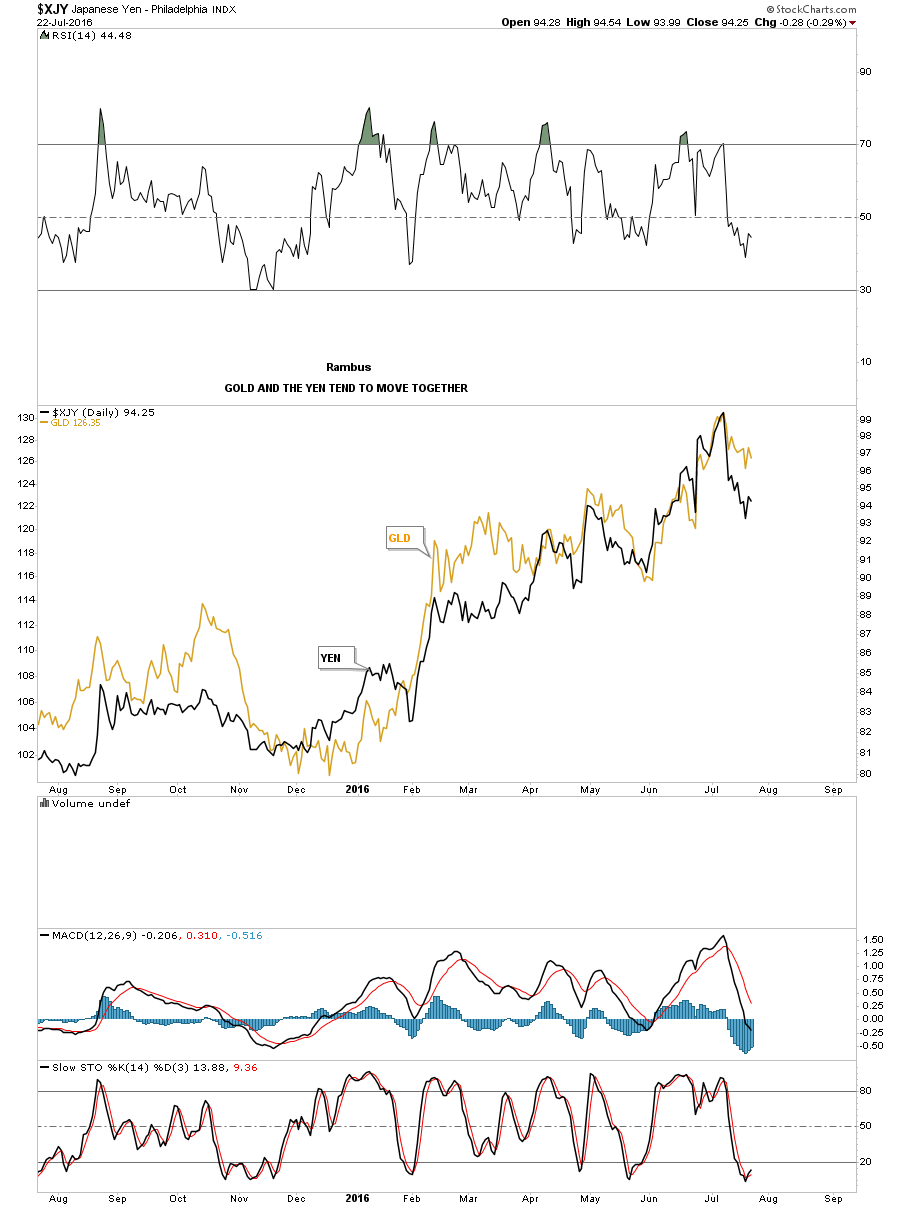
This next chart I overlaid gold on top of the daily line chart for the yen which shows why this currency is so important for gold. Sometimes one can be a bit stronger or weaker than the other but they tend to move together so you can see why the 94 area on the charts above is so important. If the backtest to the neckline holds support then there is a good chance that gold will also be finding support. It looks like next week is shaping up to be another very important week in the precious metals complex. Have a great weekend. All the best…Rambus
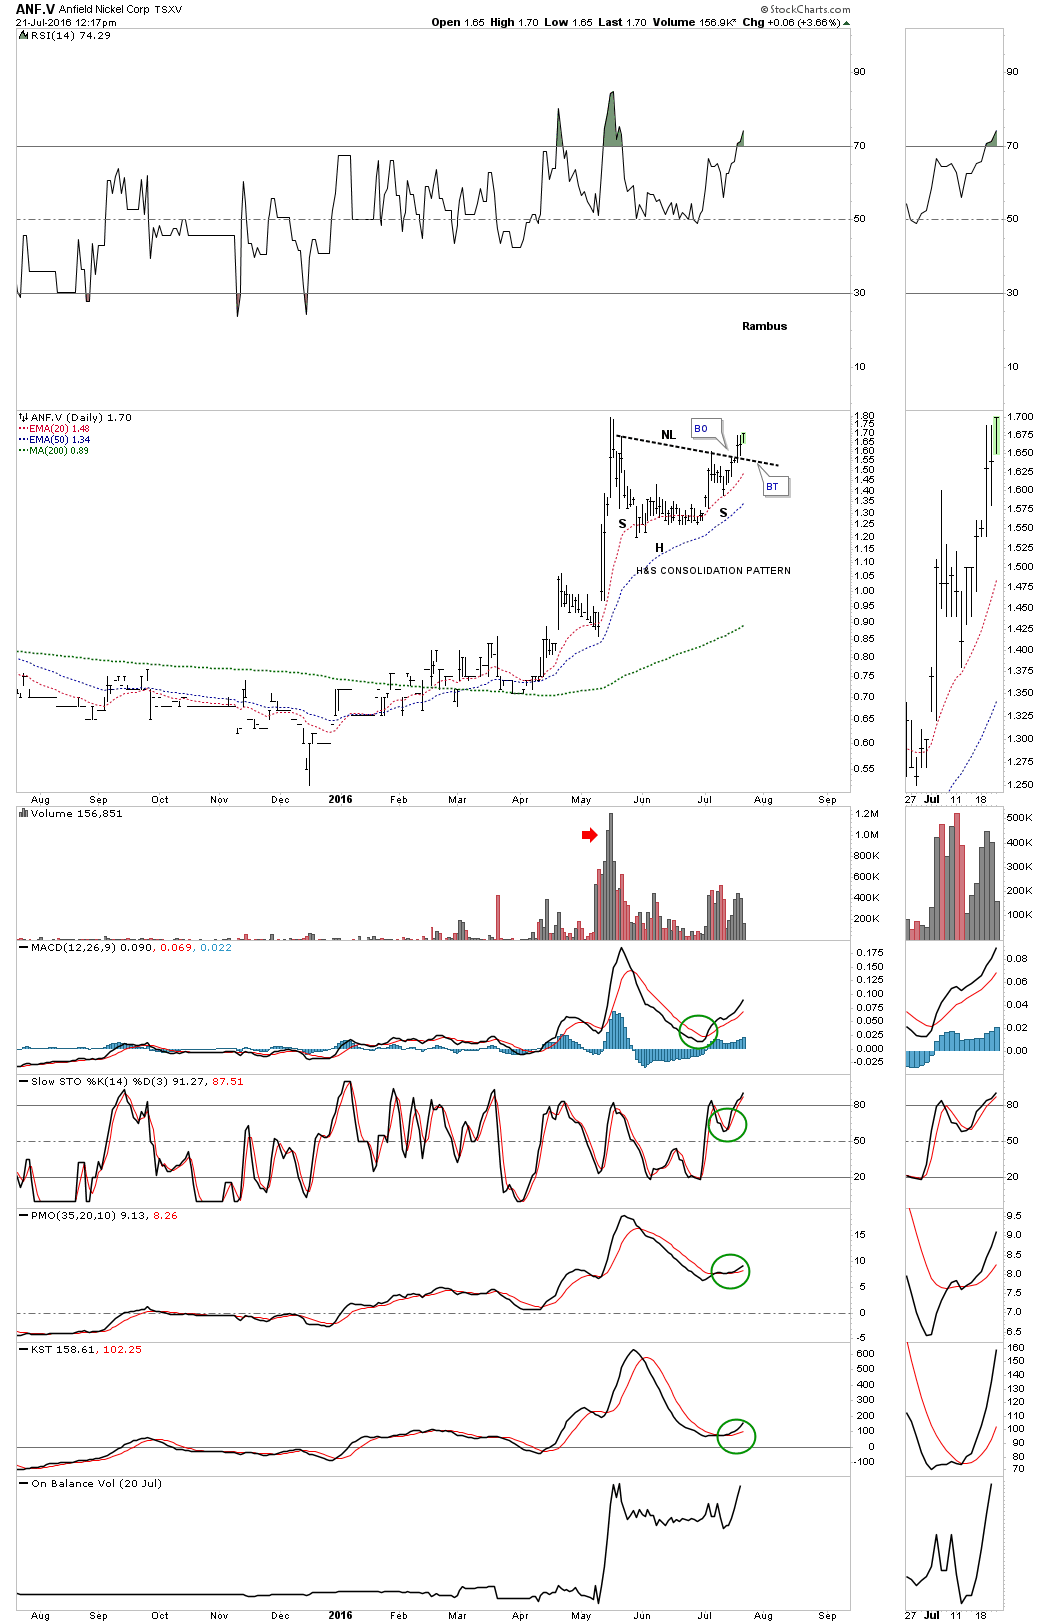
Tuesday of this week ANF.V broke out of H&S consolidation pattern where I took an initial position and bought 3000 shares. The daily chart shows the breakout and backtest holding.
The monthly chart really puts everything in perspective for this stock. The H&S consolidation pattern on the daily chart above is just part of a much bigger inverse H&S bottom on the monthly chart below. You can see the beautiful H&S top which ended the bull market. Big patterns lead to big moves. The H&S bottom is 2 1/2 years in the making with the price action testing the neckline presently. That big H&S bottom is actually bigger than the H&S top and has a price objective up to the old high around the 6.40 area. I’m going to put an order in to buy another 3000 shares at 1.83 which is just above the neckline, on the breakout.
