This chart shows the juniors have been outperforming the the big caps this week. This is a good sign. Right now this ratio is trying to put in a higher low and could be forming a right shoulder of an inverse H&S bottom.
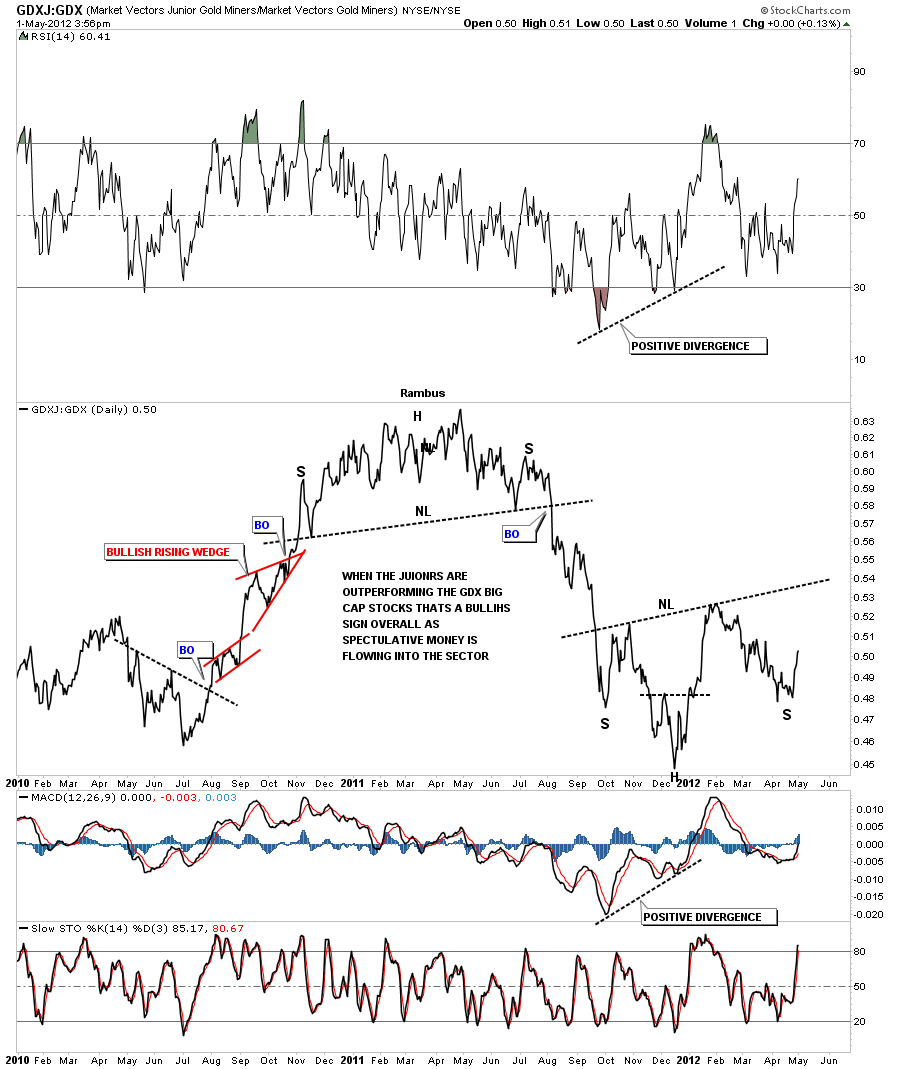

This chart shows the juniors have been outperforming the the big caps this week. This is a good sign. Right now this ratio is trying to put in a higher low and could be forming a right shoulder of an inverse H&S bottom.
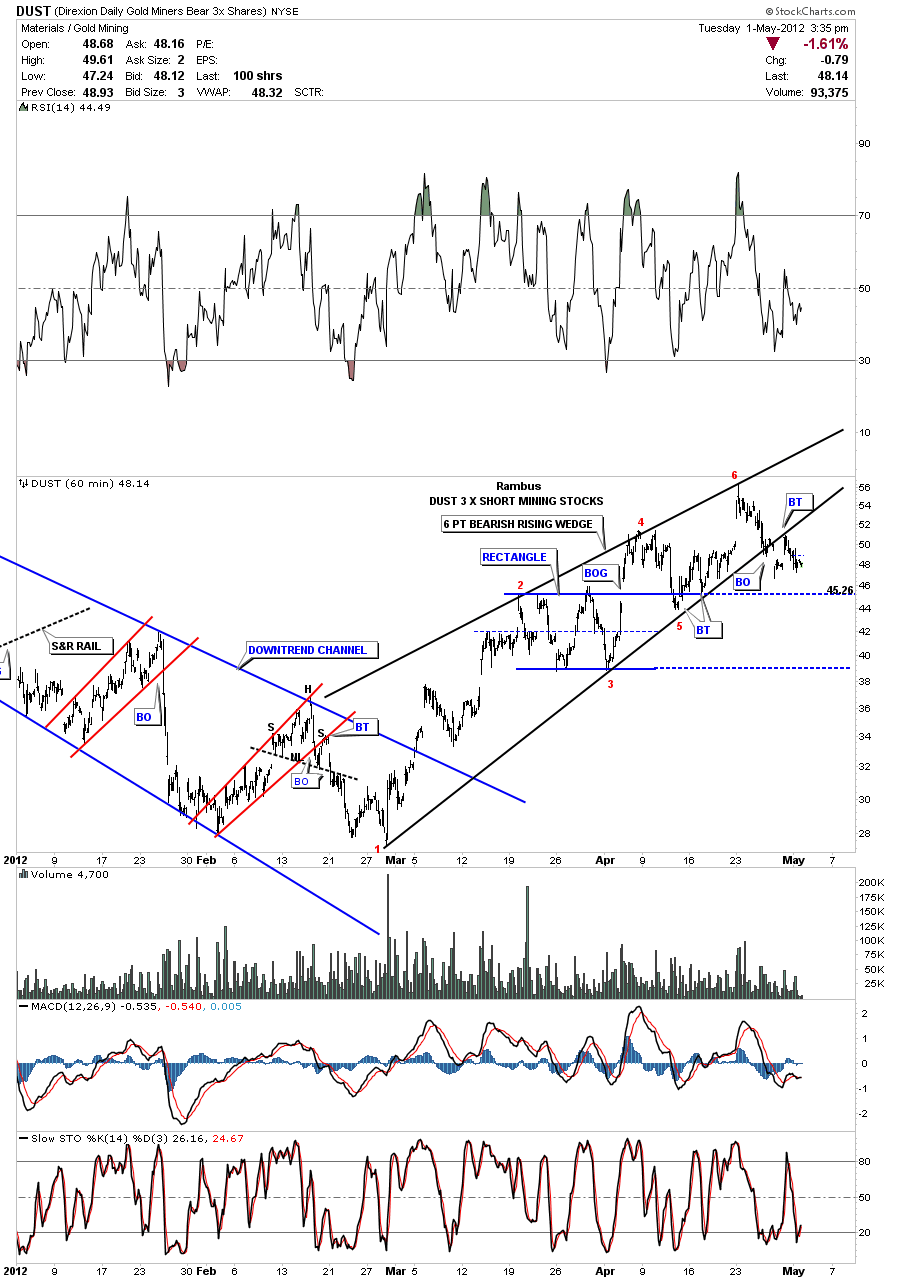
We are stopped out of DUST at 47.59. There is a bearish rising wedge that broke out last Friday. We had the backtest yesterday and today we are starting to move alittle lower. I’m going to take the money from the DUST trade and buy NUGT at the market today. NUGT is a 3 X long etf for the gold miners. I’m starting to see a few signs that some of the smaller PM stocks are trying to put in a little bottom in here.They have also been outperforming the big caps which is what I want to see. We still have some serious overhead resistance on the PM indexes but for right now I’m going to take each stock on its own merit and if it looks good I’ll recommend it. It might be just a short term trade or it may turn into something longer term. We’ll just take it one step at a time. I’ll have more tomorrow.
DUST 60 minute chart showing the bearish rising wedge with breakout and backtest.
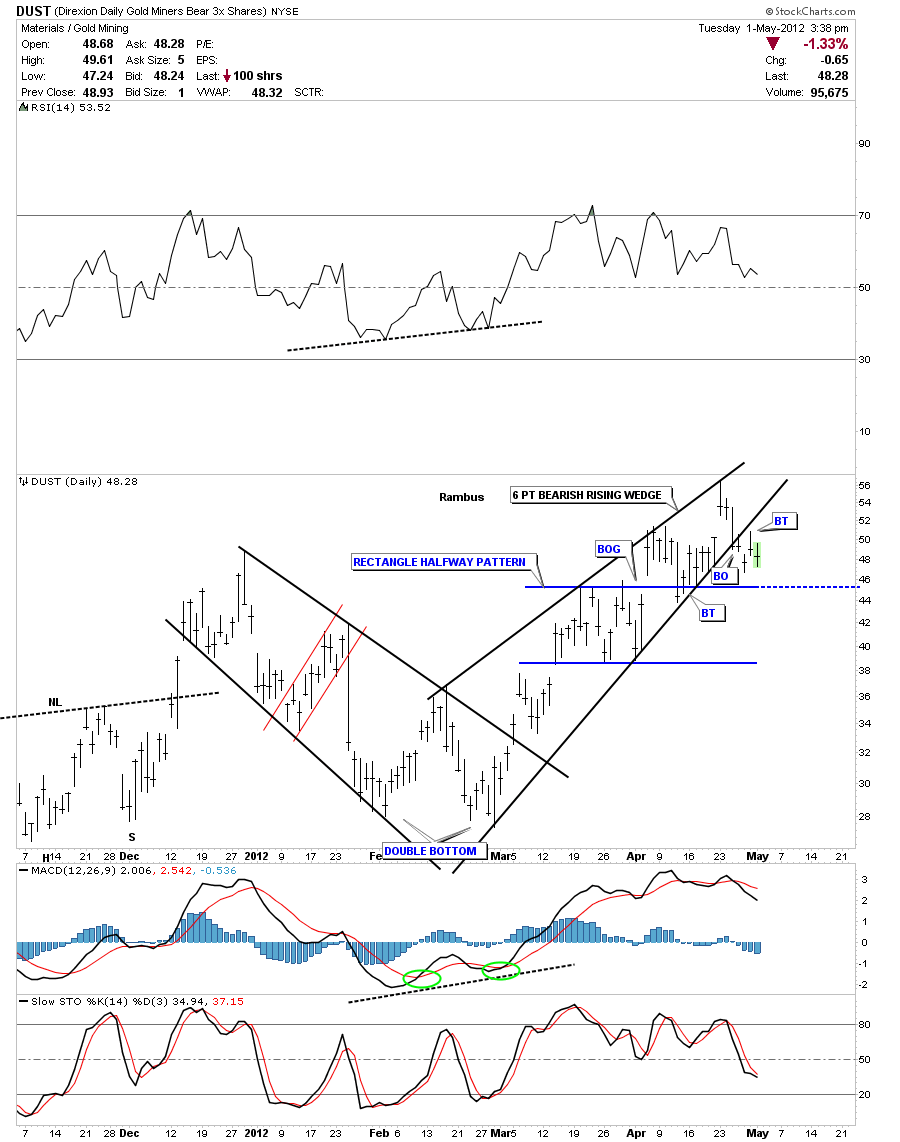
DUST daily look shows the bearish rising wedge. A move below the top rail of rectangle, around the 45 area, will confirm the new downtrend.
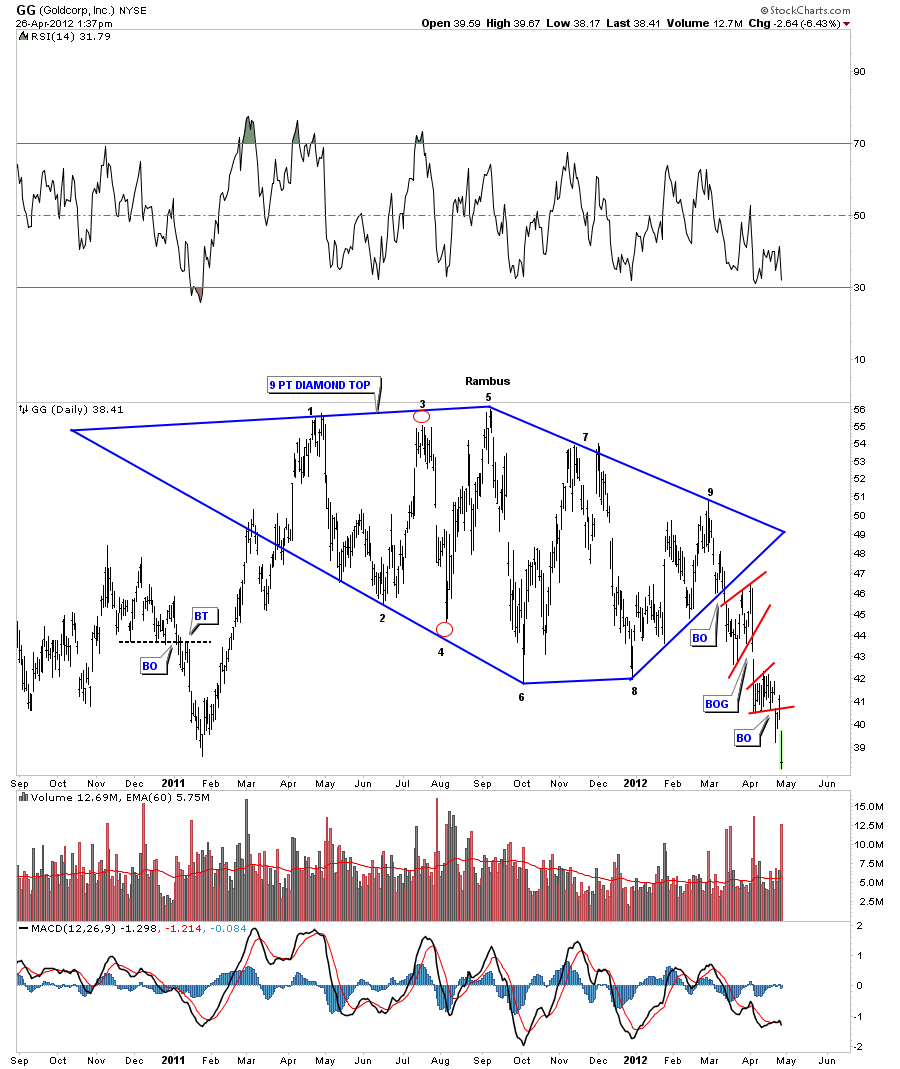
Goldcorp is a big part of the HUI so it stands to reason that the chart patterns may look similar. Like the HUI, GG also has a diamond top pattern that is leading the HUI down at the moment.
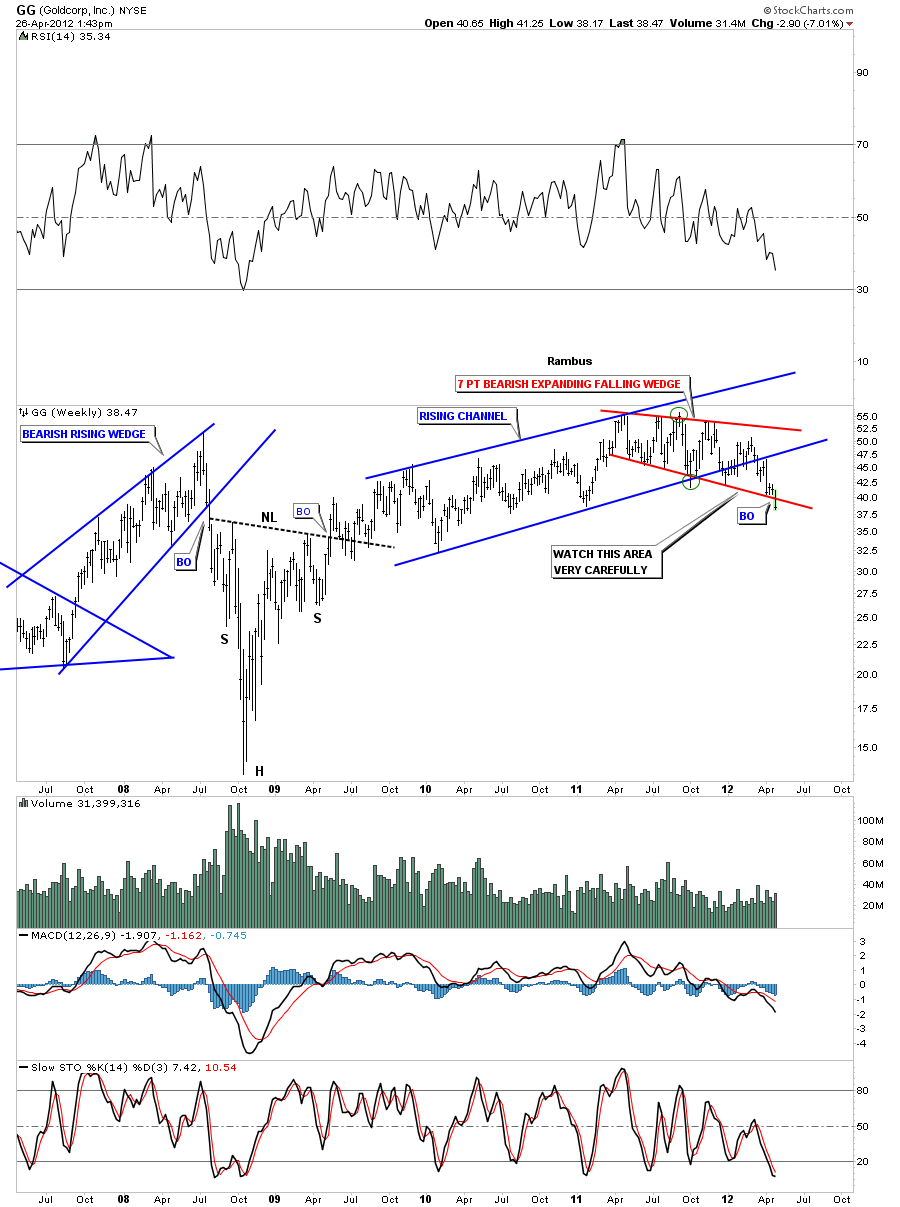
There is another bearish pattern on the weekly look that is a red 7 point bearish expanding falling wedge reversal pattern that is breaking down today. There is also a blue rising channel that held the price in check for almost 18 months or so that broke the bottom blue rail about 2 months ago. If we were in an uptrend these important rails should not have been violated. The fact that they are is not a healthy sign for the long term view of the big cap precious metals stocks.
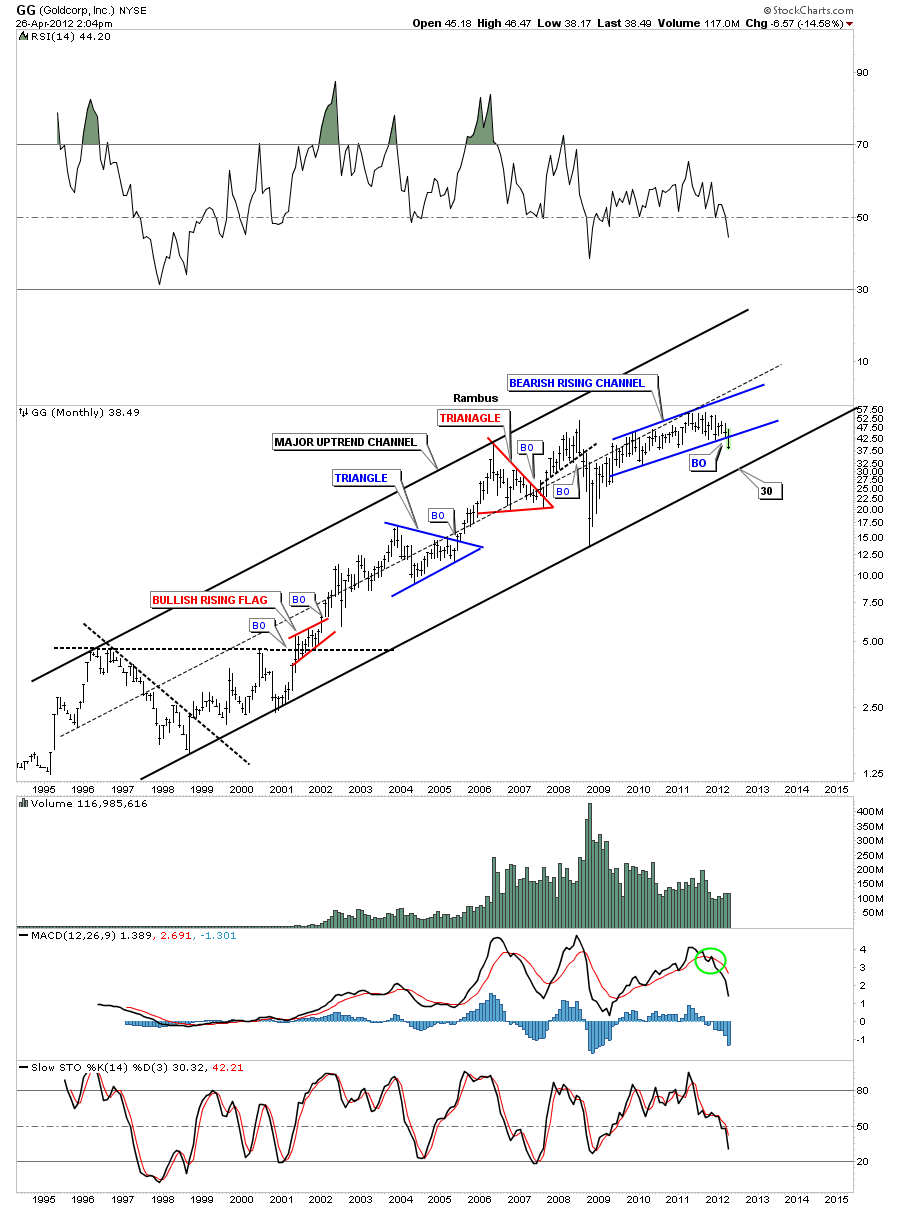
The monthly chart shows the big uptrend channel that has been in place since the late 1990’s. The bottom rail of the major uptrend channel comes in around the 30 area. As you can see the very big picture doesn’t look quite as ominous as the shorter time frames. Eight more points lower on this stock will have a negative impact on the HUI if indeed it does trade down to the bottom rail. Its been a rough month for GG as its down over 14%. The bottom rail would be a good low risk entry point if one has the cash on hand to take the trade.