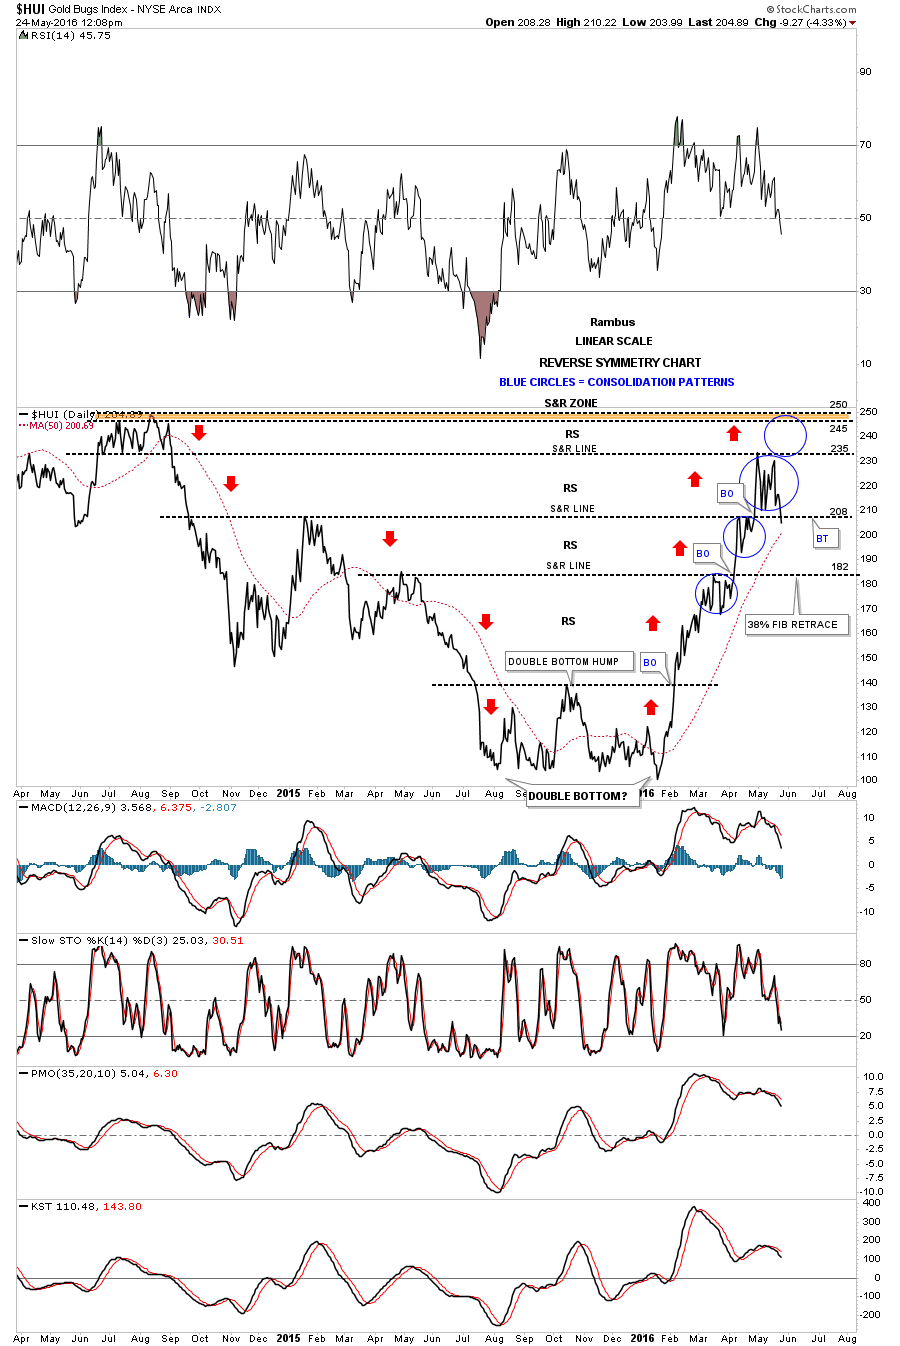
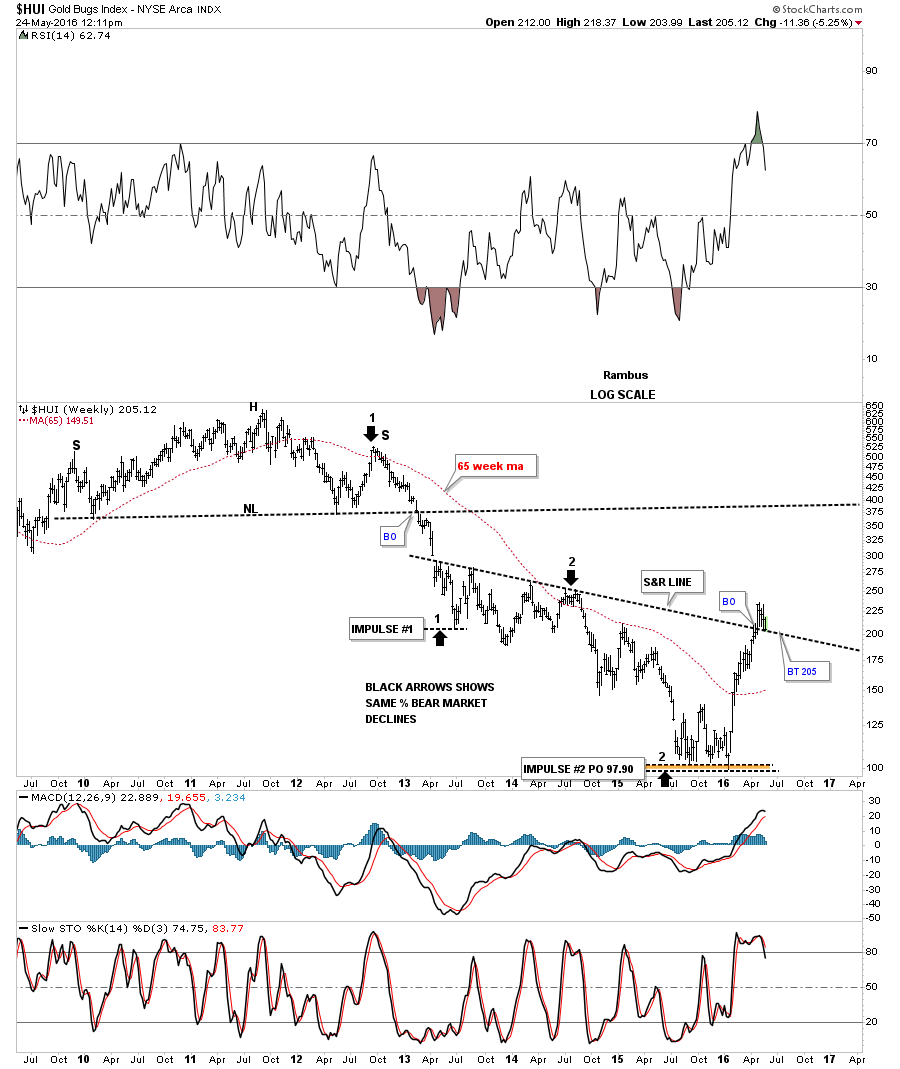
We’ll be leaving for home sometime tomorrow afternoon so I won’t be able to do a Wednesday Report. By the movements in the markets, today is actually a better day to do a Wednesday Report.
There are several times a year when the markets gives you an important inflection point. Today I believe we just witnessed one in regards to the PM complex, the US dollar and the stock markets. Even though the US dollar didn’t have an extremely big up day it did show its hand by breaking out of a downtrend channel while the PM complex had a tougher day breaking down from a small topping pattern we looked at earlier today. Also the stock markets had a very good day to the upside with some completing small double bottoms or falling wedges.
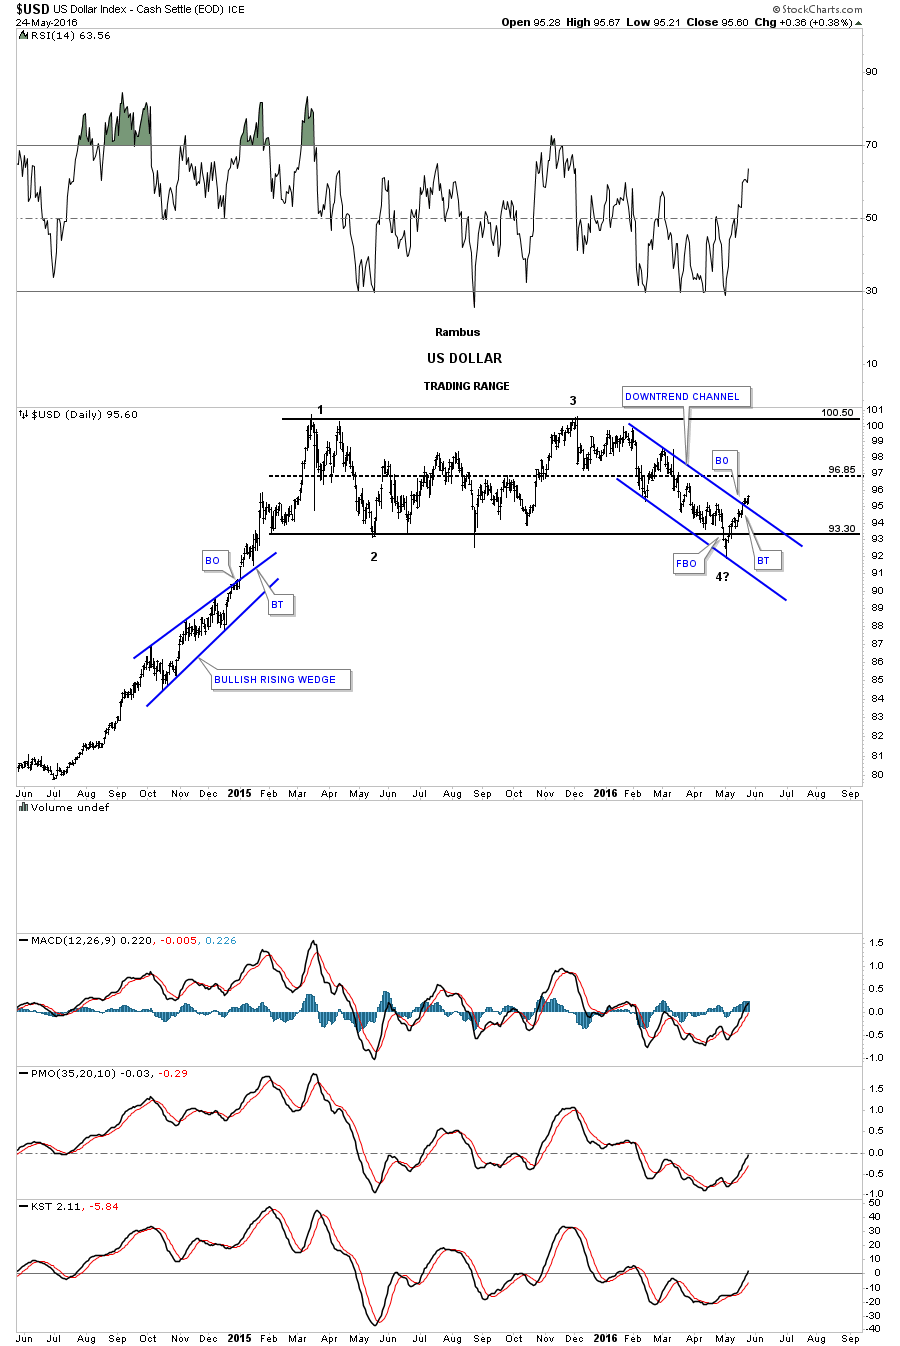
As the US dollar is the key driver going forward lets take a look some charts which are showing it has likely bottomed and is reversing back up. Below is a daily chart which shows the one plus year trading range. We’ve discussed in the past that a false breakout, of an important trendline, can lead to a big move in the opposite direction. Remember the false breakout the HUI and other precious metals stocks had back in January of this year that led to this massive rally we’ve enjoyed up until today? I believe we are seeing the same thing taking place on the US dollar right now. One has to respect the breakout but when the price action trades back above the breakout point the breakout in negated.
This daily chart also shows another reason why I believe the US dollar has bottomed. It just recently broke out above the top rail of its blue downtrend channel and looks like it had a short and sweet backtest. As I explained earlier today on the possible consolidation pattern that maybe forming on the HUI, there has to be four completed reversal points, at a minimum, before we can conclude we have a consolidation pattern. As you can see on the US dollar chart below it has completed three reversal points so far with the possible fourth reversal point just beginning. The fourth reversal point won’t be complete until the price action reaches the top of the trading range, around the 100 area.
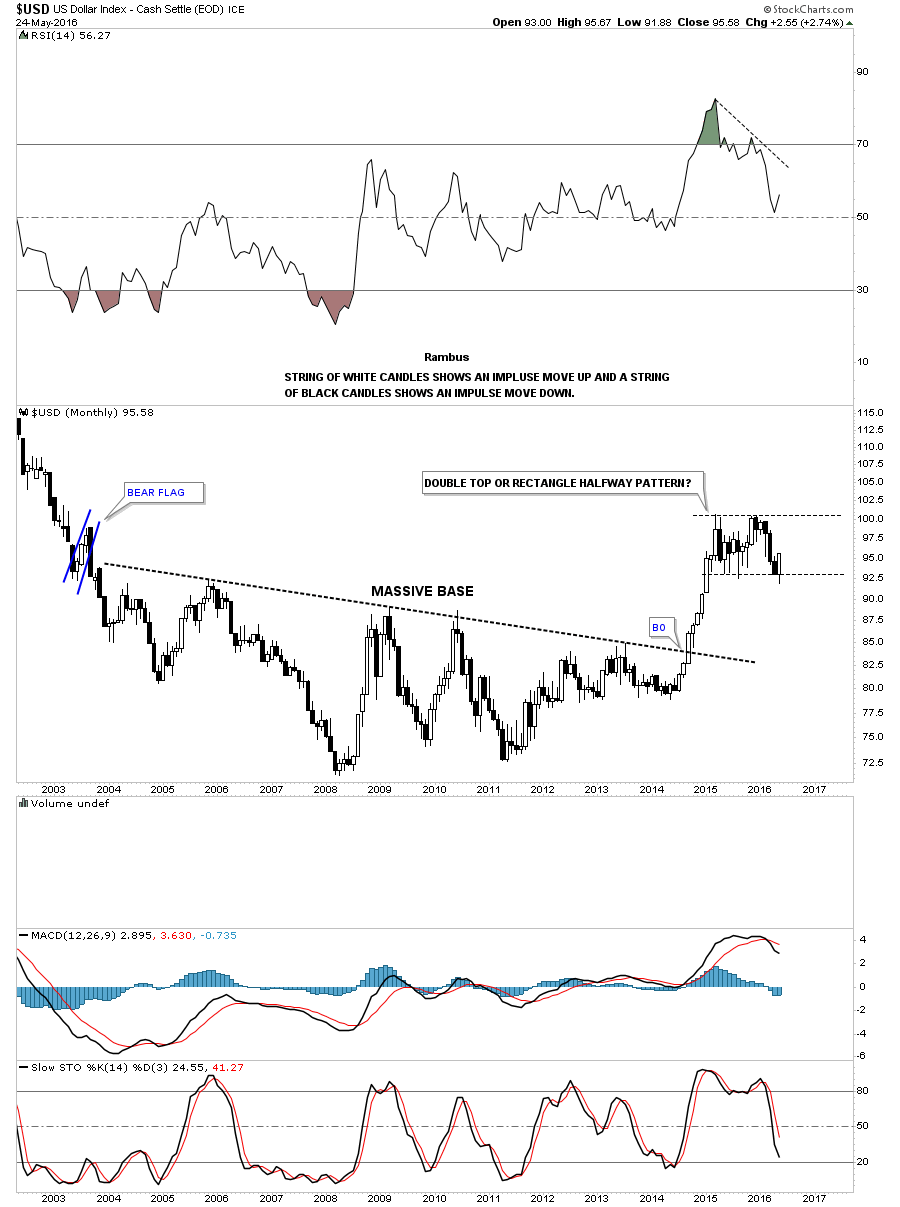
This next chart puts the one plus year trading range for the US dollar in perspective. There were nine white candlesticks that formed the massive impulse move up when the US dollar finally broke out above the massive bases. We still have a few more days to trade for the month of May but it looks like the US dollar will most likely form a white candlestick. In and of itself it’s not a big deal when a consolidation pattern is still building out but it is something to keep an eye on. Also when looking at this chart from 35,000 feet, with the big base in place and the current trading range building out, we have to respect the potential outcome when all is said and done. The potential outcome could still be a double top if the price action begins to fail fairly soon but when I look at the massive base it looks like a consolidation pattern seems like the probable outcome. Keep in mind we could see several more reversal points build out before the possible consolidation pattern is completed.
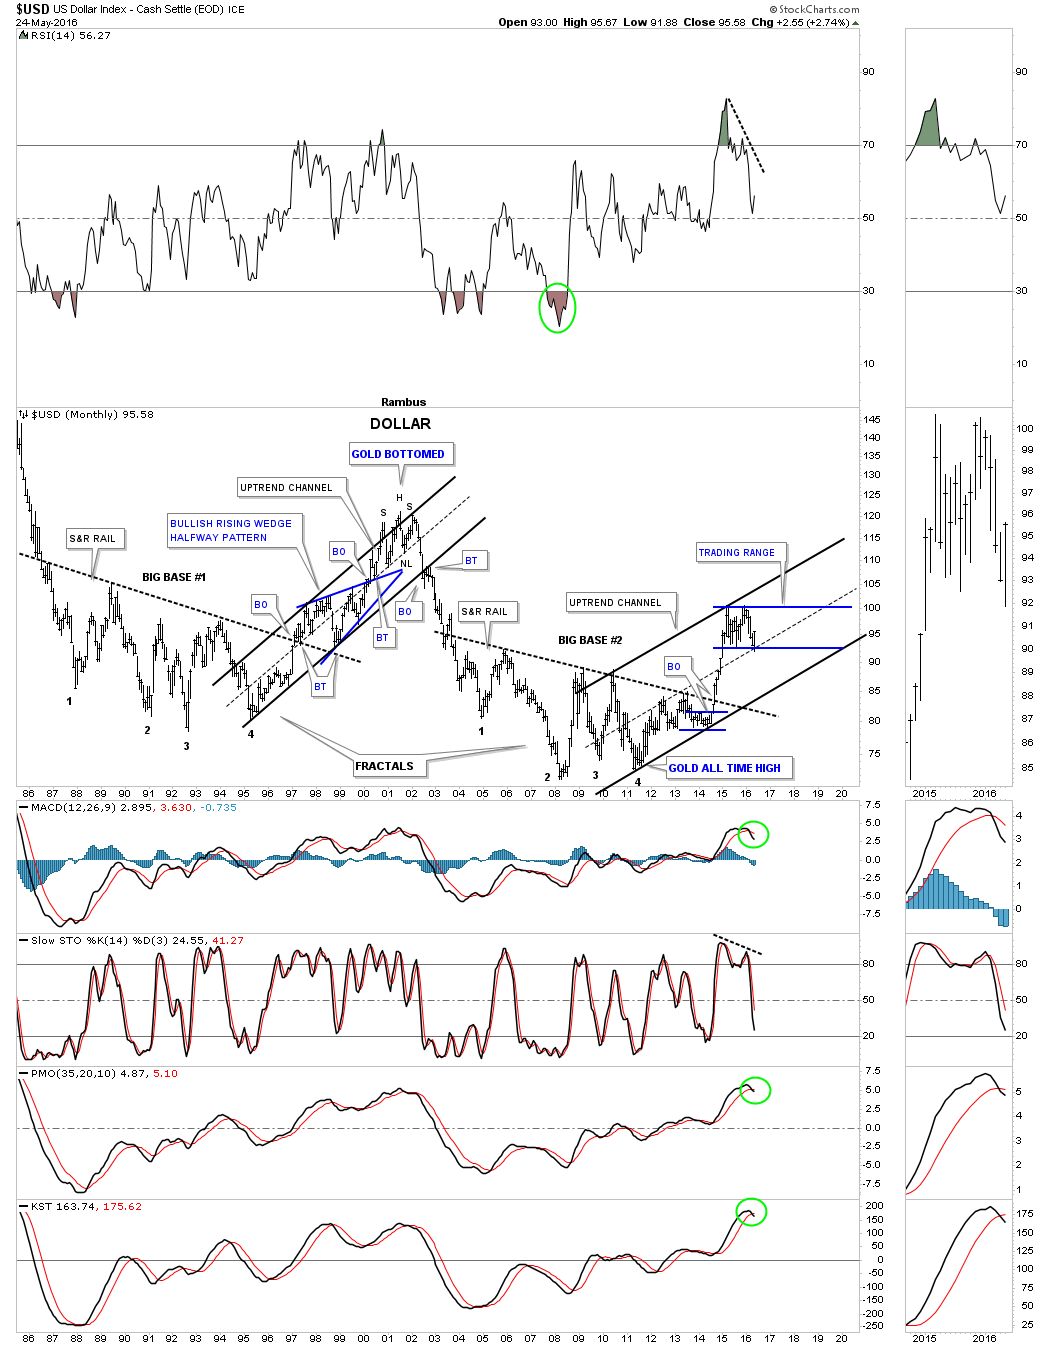
Below is a 35 year chart for the US dollar showing the two fractal bases labeled BIG BASE #1 and BIG BASE #2. Back in the mid to late 1990’s the US dollar built out a big blue bullish rising wedge as a halfway pattern that took roughly three years to complete. That major uptrend finished off with a H&S top which was the beginning of the bull market in the precious metals complex. As you can see our current uptrend channel is less steep than the 1990’s which could take several more years to build out. The big question for me is how well will the PM complex do during this consolidation phase in the US dollar? We will most likely get our answer if or when the US dollar trades back up to the top of its trading range. In the meantime as the US dollar consolidates so should the PM complex as both are reversing direction right now.
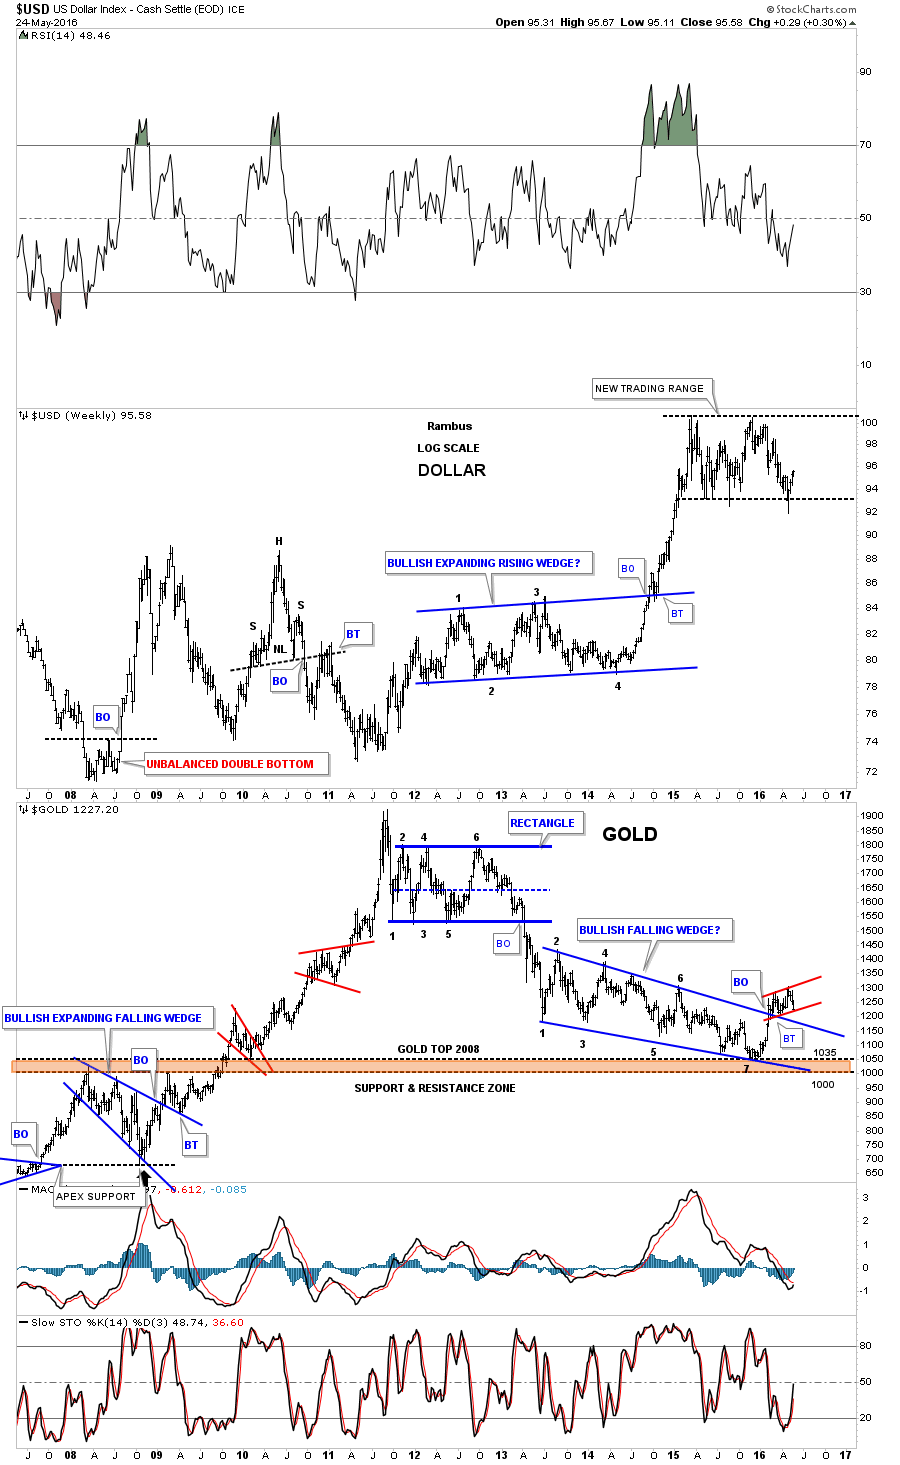
This next chart is a weekly combo chart with the US dollar on top and gold on the bottom. As the US dollar has been consolidating sideways gold put in a nice low right on top of the 2008 highs at the 1035 area, brown shaded support and resistance zone. You can see gold’s red rising flag that we’ve been following on the daily chart that has formed above the top rail of the multi year falling wedge. Both the US dollar and gold are at critical inflection points right now.
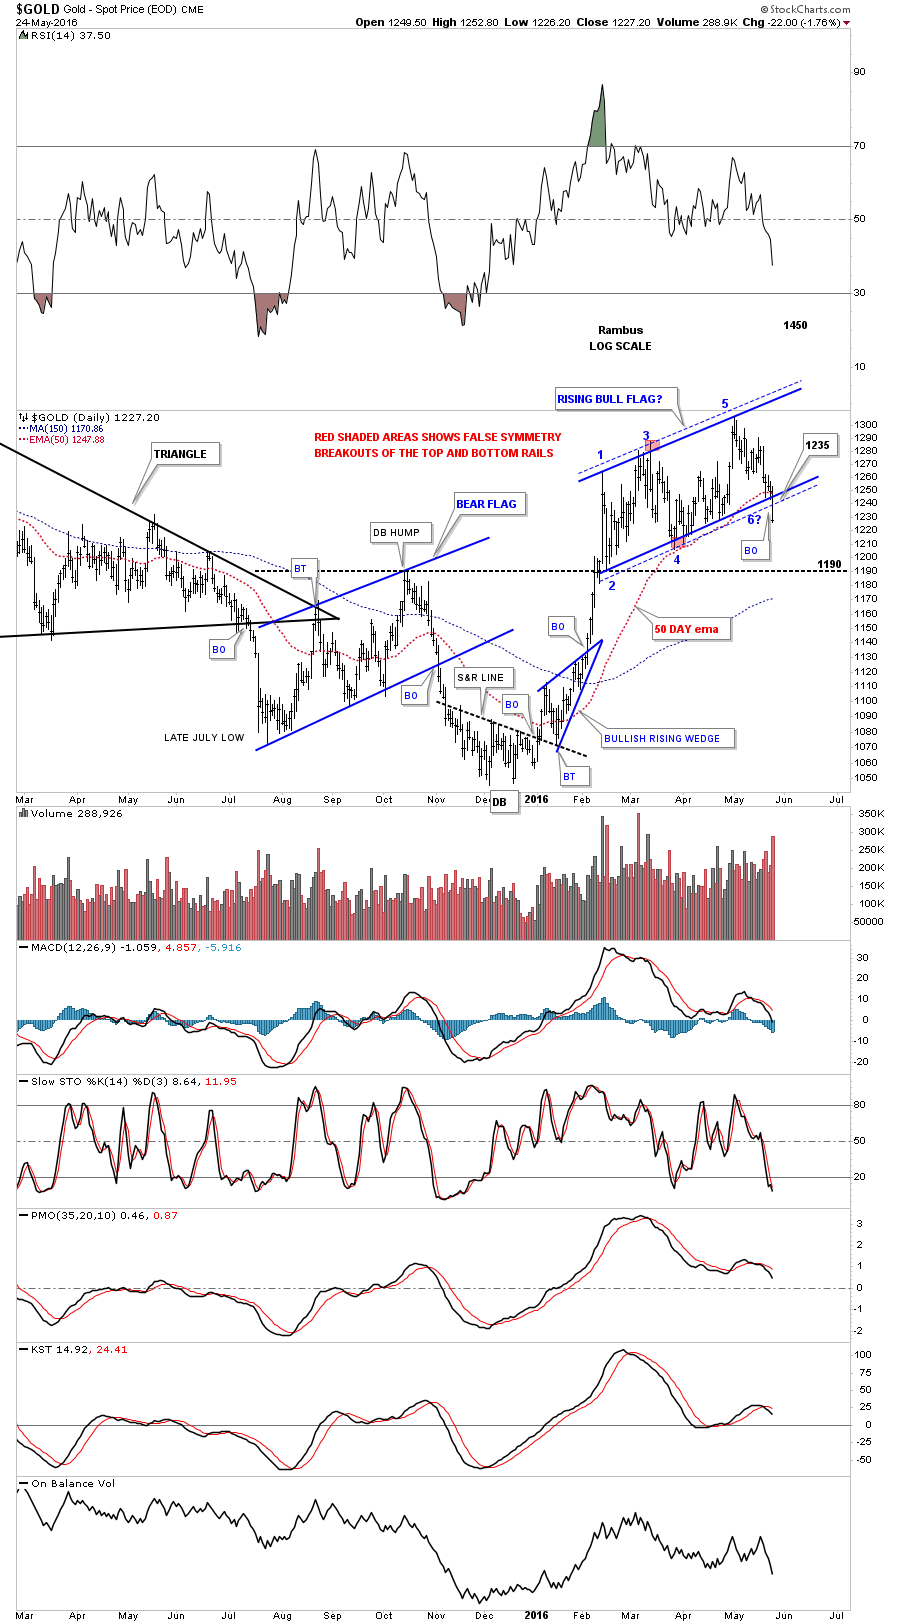
Below is the daily chart for gold we’ve been following which shows the rising flag that had created five reversal points. The breakout below the bottom rail is the main reason I exited half of the mining shares today. Gold still had a chance to bounce off of the bottom rail to start the possible sixth reversal point to the upside but that was not the case. With five reversal points in place gold now has a five point reversal pattern which is a bearish rising flag. Gold also closed below the 50 day ema for the first time since this impulse move up began.The next possible area of support may show up at the previous high at the 1190 area. The bottom line is we now have a reversal pattern in place which has to be respected regardless of what we may think. With the way the US dollar is looking now, there is a good chance I will exit the reaming shares tomorrow now that the dust has settled and we can see more clearly now.
I’m going to post this part of the Wednesday Report now and will do another post after while on what the stock markets are saying. I know most don’t want to trade the stock markets but while the PM complex is consolidating the stock markets may offer us a good trading opportunity for the time being.
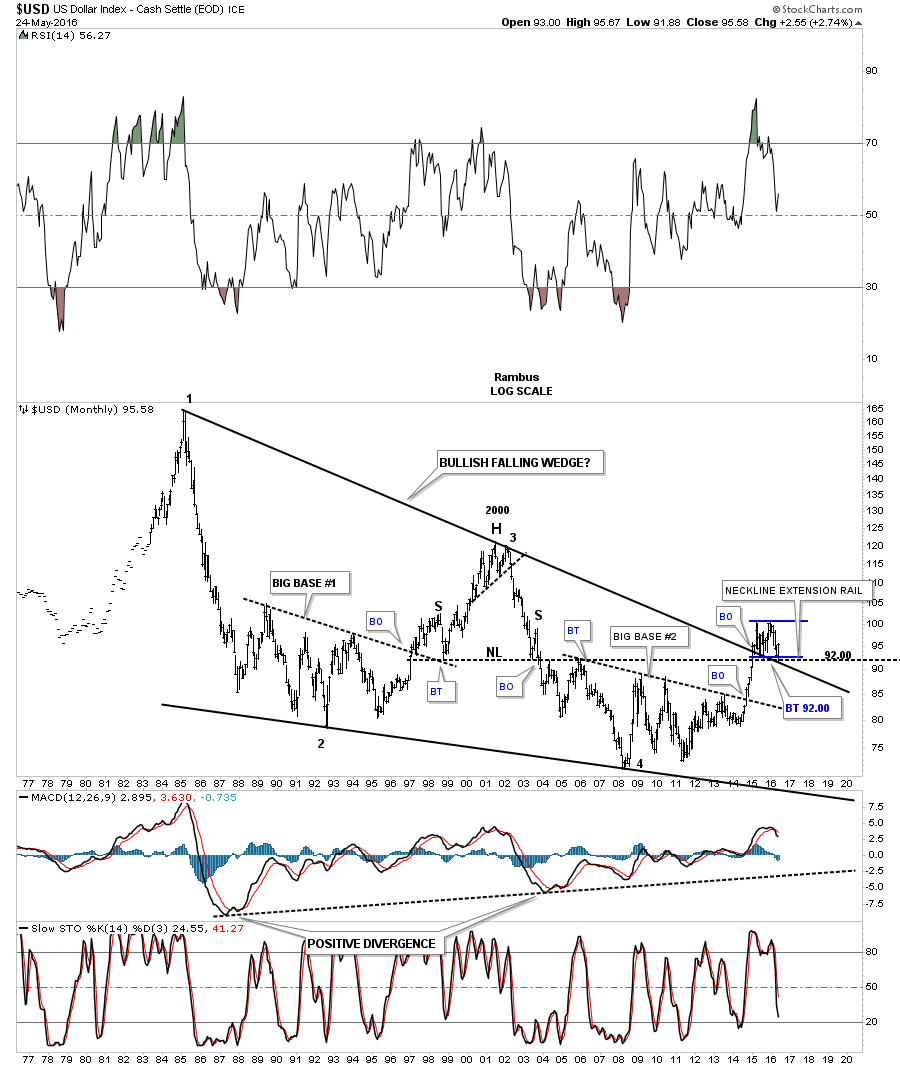
PS: So many charts to look at tonight I forgot to post this long term chart for the US dollar I haven’t posted in quite awhile. The US dollar is finding support on the top rail of the 30 year bullish falling wedge and the neckline extension rail taken from the previous H&S top. It’s hard to argue with what this chart is suggesting.