US Dollar…Taller or Smaller ?

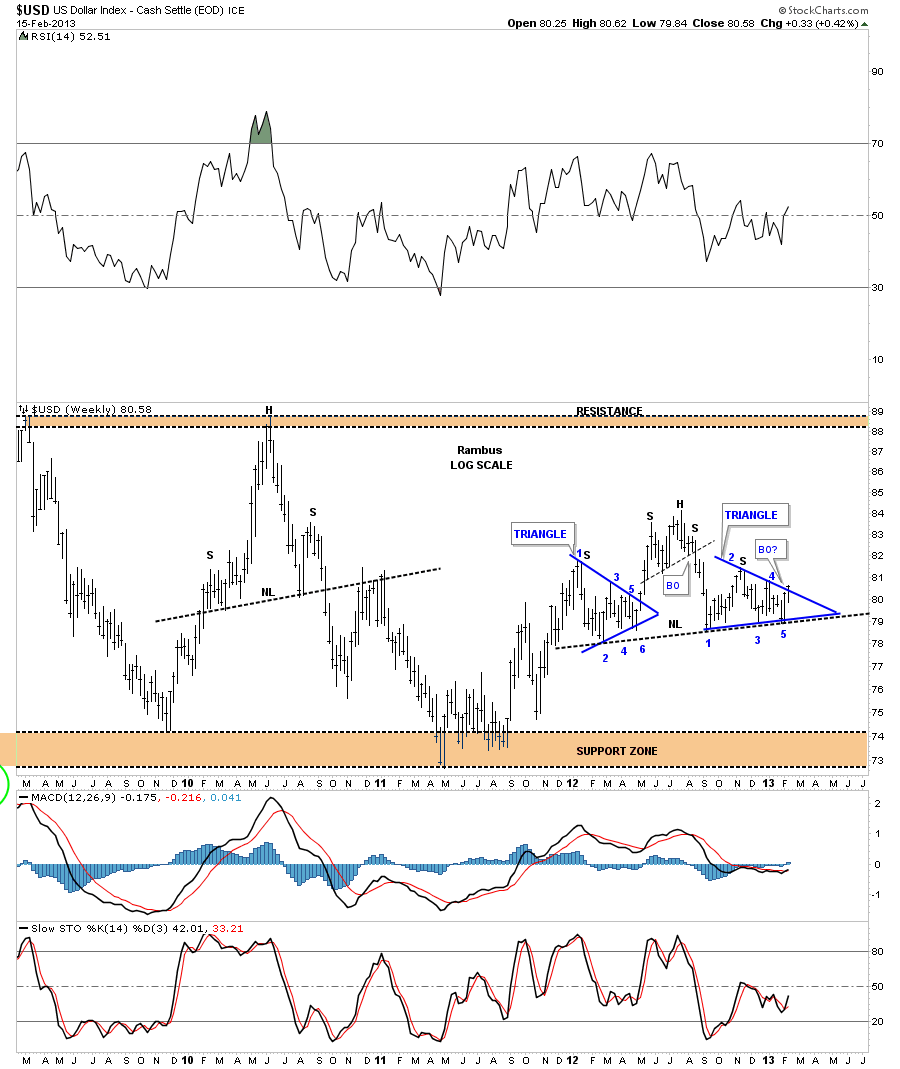
We haven’t looked at the US Dollar in awhile so lets see what it’s been up to in the last month or so. The first chart I would like to show you is a weekly bar chart of the H&S top pattern that everybody is focused in on at the moment. It does have nice symmetry to it and looks like the real deal. Please note the blue 5 point triangle on the right side of the chart where the current price action is strongly testing the top blue rail.  As I have shown you many times an odd number of reversal points in a chart pattern equals a reversal pattern. As this triangle is forming below the H&S top we need to see a pattern that has at least 5 reversal points to reverse the downtrend to up. A breakout above the top blue rail will give us our first big clue that the potential H&S top will fail. As you can see the blue triangle on the left side of the head has 6 reversal point making it a consolidation pattern.
dollar weekly h&s

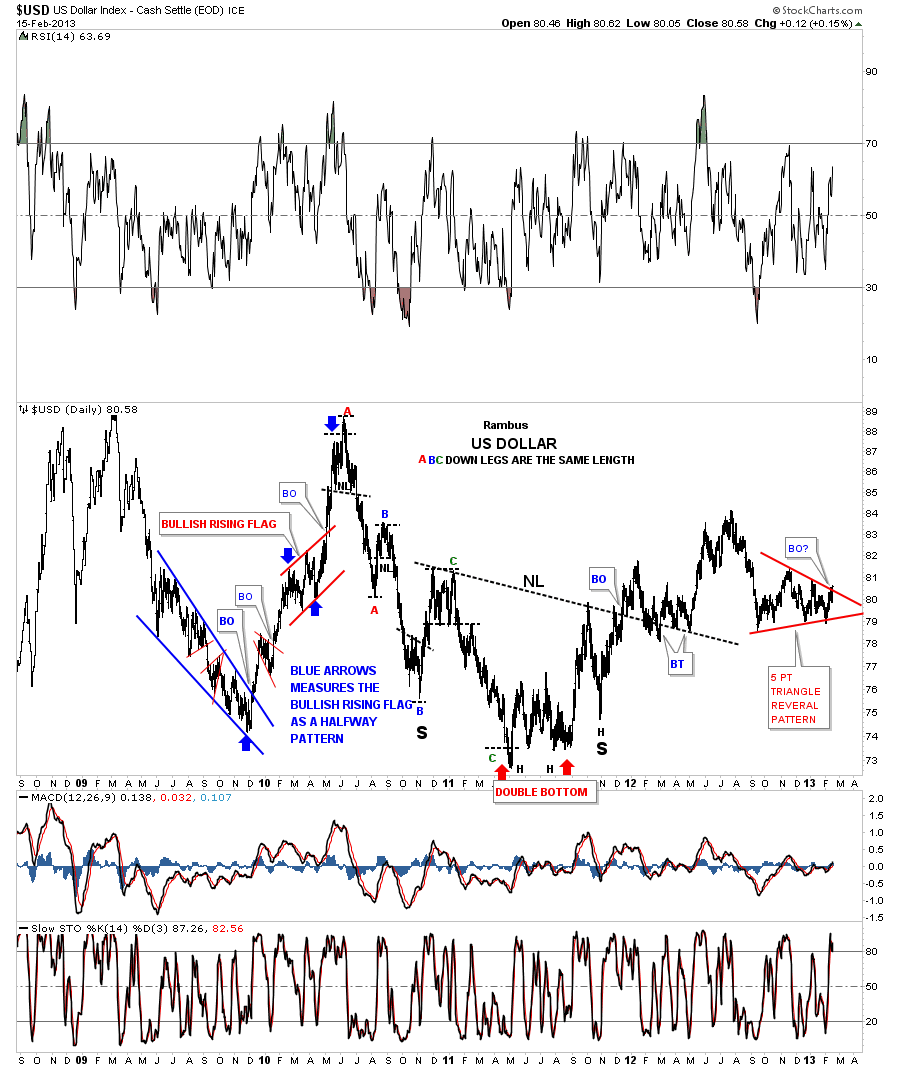
In order to launch a decent bull move a stock has to have a base that gives the stock the energy it needs to make a sustained move. This next 5 year daily chart shows the US Dollar does have a nice big base in which to launch a decent upward move.  Some of our earlier subscribers may remember this inverse H&S bottom that we watched develop for sometime last year. As you can see the breakout from the H&S bottom was anything but a rocket launch as the price action has been moving sideways to slightly down. Another simple clue that a bottom could be in is that the dollar has not made a lower low since the backtest to the neckline. A simple clue but an important clue up to this point. Again you can see the price action is strongly testing the top rail of the red triangle.
dollar h&s base

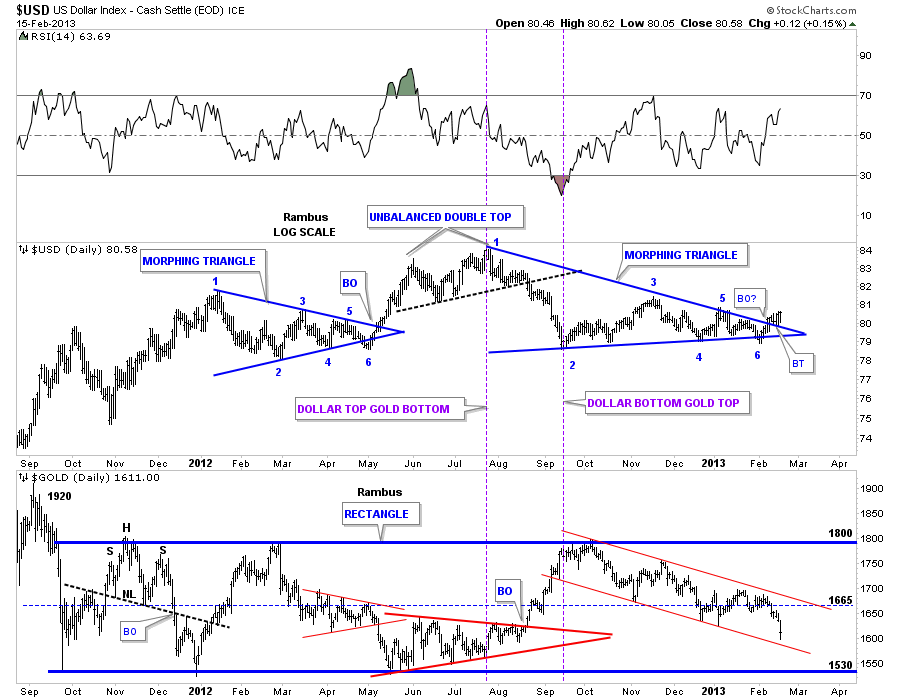
Below is another way we can look at the price action from the Dollar high made back in July of last year. Some of you may recall the blue morphing triangle on the left side of the chart that broke out to the upside after a false breakout to the downside at point #6. We have a similar morphing triangle on the right side of the chart. If we start the triangle from the July top then it only needs to have an even number of reversal point to make it a consolidation pattern. I have to admit its not the prettiest triangle I’ve ever seen but the way the breakout and backtest is progressing it could very well be completing the breakout phase. We will know very soon if this is the case as the top blue rail will have to reverse it’s role and act as support on any pull back. Note the gold chart at the bottom. If the dollar does in fact breaks out of the 6 point triangle to the upside that will put alot of pressure on gold.
dollar morphing tiranlgle

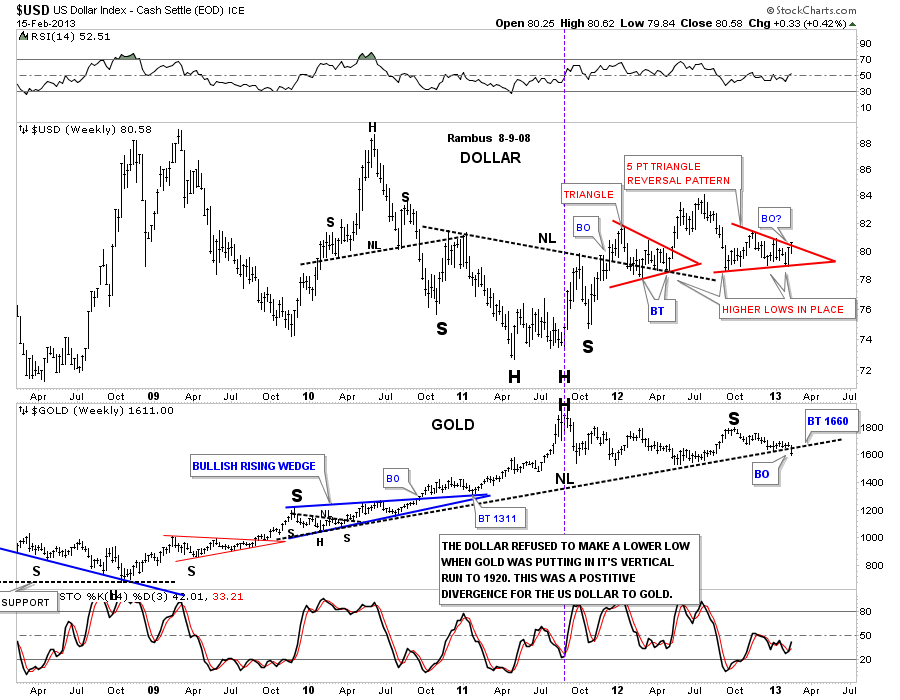
Below is another combo chart that shows the smaller red 5 point triangle reversal pattern on the dollar and the big H&S top pattern on gold on the lower chart. What I find interesting is the last bar on the chart for both the dollar and gold. As you can see the dollar is attempting to breakout from the red triangle and gold broke below it’s big neckline last week. Coincidence?
gold and dollar coincedence

Lets look at another combo chart for the dollar and gold that goes all the way back to 2003. The US Dollar chart on the bottom is giving a buy signal based on the 20 and 50 week ema’s. As you can see in the red circle, the faster 20 week ema has just crossed over the slower 50 week ema and the price of the US Dollar is above both moving averages at 80.58. You can also see the big long black dashed support and resistance rail that goes all the way back to 2004. That is critical resistance right now but if the dollar ever trades above that S&R rail that will be a very big deal IMHO. As you can see on the top chart gold is in a confirmed rectangle and if the dollar breaks higher that would put serious pressure on gold. Right now it looks like 86 for the dollar is resistance and 1530 is support for gold.

usd gold rectangle

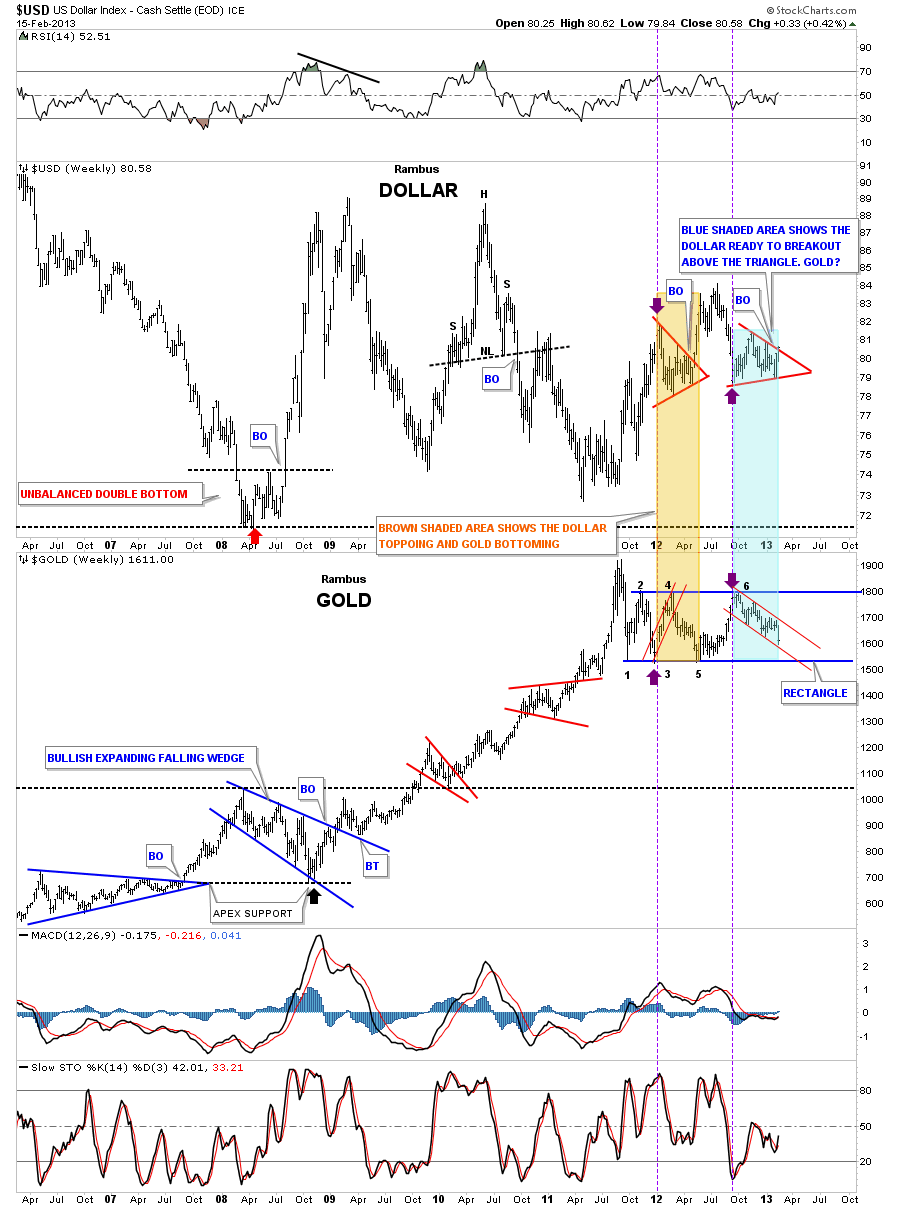
Lets look at one more combo chart for the US dollar and gold. On the chart below I’ve add a brown shaded area and a blue shaded area based on the two red triangles on the dollar chart on top. What this chart shows is the inverse move that the dollar.and gold tend to make. You can see that when the red triangle on the left side was building out gold moved up to point #4 on it’s rectangle and when the dollar finally broke out to the upside gold corrected down to point #5 at the bottom of the rectangle. This is where it gets interesting. Note the red triangle on the right side of the dollar chart that is getting real close to breaking the top rail. If the US dollar breaks out above the red rail that will put serious pressure on gold that will break the bottom red rail of it’s small downtrend channel. And if the dollar has a strong move up the blue bottom rail of gold’s big rectangle will be in jeopardy which would be a serious blow to gold if the bottom blue rail ever gives way. A break of gold’s bottom blue rail of it’s rectangle would then turn from support to resistance on any backtest. So we have plenty to watch over the next week or so. Stay tuned…All the best…Rambus

More (Including Free Trial) at www.rambus1.com
gold 1111111


Friday Night Chartology…What Do You See?

“Beauty is In the Eye of the Beholder” ..English Proverb

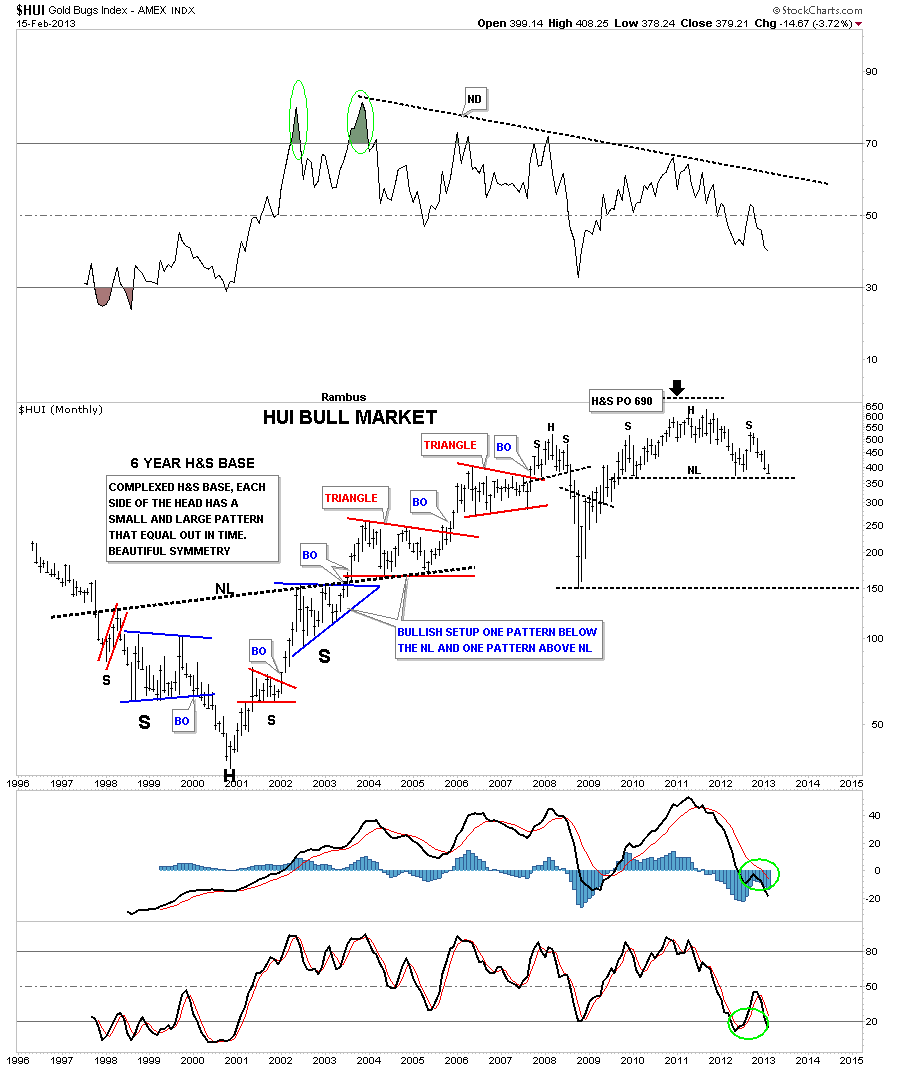
Tonight I want to show you a long term monthly chart for the HUI. It seems there is alot of disbelief that if a H&S pattern is too big that it some how makes it invalid or not to be trusted. I’m curious how that rumor ever got started? Nothing could be further from the truth IMHO.

Below is a monthly chart of the HUI that shows a massive 6 year inverse, complex H&S base, that launched the bull market for the precious metals stocks back in 2001. There is a certain beauty that 6 year H&S base has that most wouldn’t recognize. If you look on each side of the Head you will see two chart patterns, one large blue formation and one small red formation. They are positioned just the opposite on each side of the head. This doesn’t change the time component as the left and right shoulders measures out very close to each other. At the very top of the chart you can see what that big 6 year H&S based measured to. As you can see it measured up to 690 which was just a tad higher than the actual all time high.

The Chartology of the entire chart is one of beauty and symmetry which some will see and others won’t. They say beauty is in the eye of the beholder. What do you see?

xau

More at

www.rambus1.com
HUI Update…BREAKOUT GAP #3

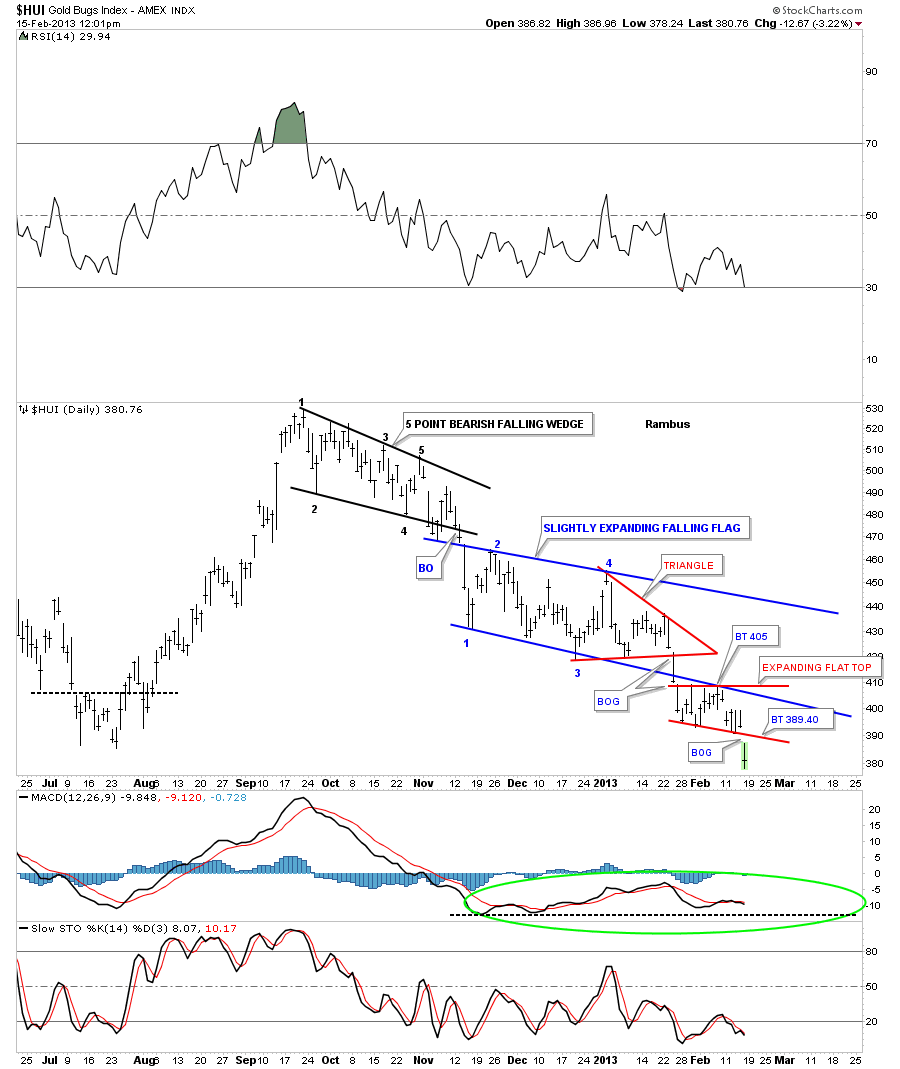
Below is a chart for the HUI that shows all the patterns since this downtrend began at the September 2012 high. Today it broke below the latest small consolidation pattern the little red flat top triangle. Today marks the start of the 3rd impulse leg down since the 2012 top. The first one was the breakout of the black 5 point bearish falling wedge. The second impulse leg down was the breakout of the blue slightly expanding bear flag. And today is the start of the 3rd impulse leg down on the breakout of the red flat top. The reason your seeing a big move is because its a breakout. Notice the breakout gap this morning. This is what one likes to see when you have a completed pattern. It tells you the consolidation period is over. I can guarantee you won’t see this type of analysis or these chart patterns anywhere else on the planet except here at Rambus Chartology.

hui 2

Editors Note :

I am a HUGE Goldbug…but I decided I can bitch Moan and complain..or…I can follow all the Action

with Chartology by Rambus and be on the right side for a change !

Presently Rambus’s Chartology is showing this may not be even close to Over !

why not join us for some Incredible Tutorials in PM Market Investing

Rambus is giving it to you for free for 10 days but IMHO you may as well subscribe srtaight up

either way you have everything to gain….top right sidebar

Wednesday Report…19 Nervous Breakdowns

I was planning on doing the Wednesday Report on Platinum and Palladium tonight but there is some deterioration taking place on some of the precious metals stocks that needs to be addressed. I’ve been waiting patiently for a couple of the really big caps to start showing some weakness. I believe the biggest cap precious metals stocks have been hiding the retreat that has been going on in some of the lesser precious metals stocks, giving hope that a bottom is close at hand, if one just looks at the big cap pm stocks. I’ve gotten several e mails from angry gold bugs that tell me I have it completely backwards and that the precious metals stock indexes are putting in a triple bottom. I got another one that told me these H&S top patterns, that I’ve been showing you, are too big to be valid.  The amount of denial is still pretty strong among the staunch gold bugs. But that’s not what’s important. What’s important is what are the charts showing us regardless of what some folks may think.

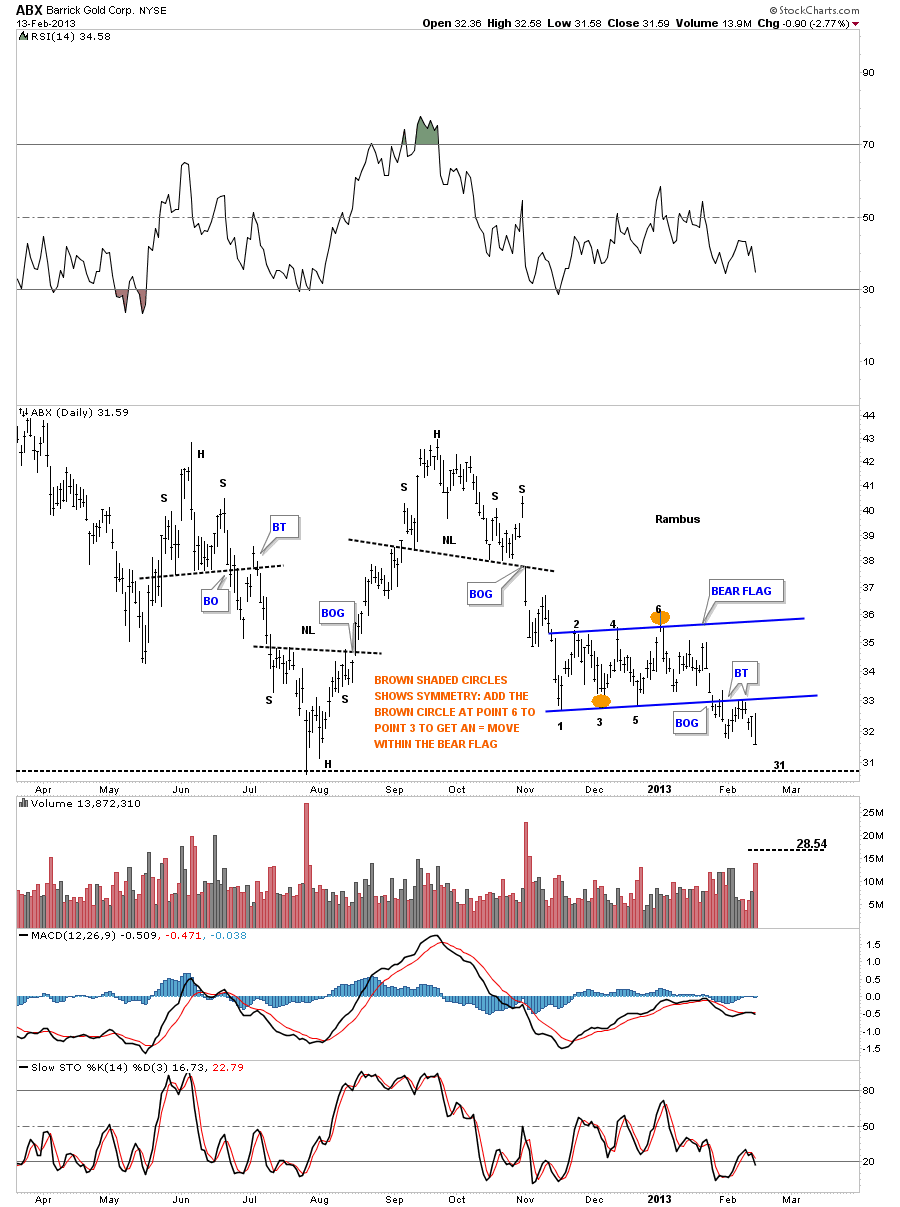
First lets look at ABX as it’s the biggest of the big cap precious metals stocks. How it goes so goes the rest of the PM complex. Below is a daily chart that shows ABX has broken out of a bear flag and has completed the backtest move. You would have to go all the way back to August of last year to see a lower closing price vs today’s closing price.

abx 2 x day

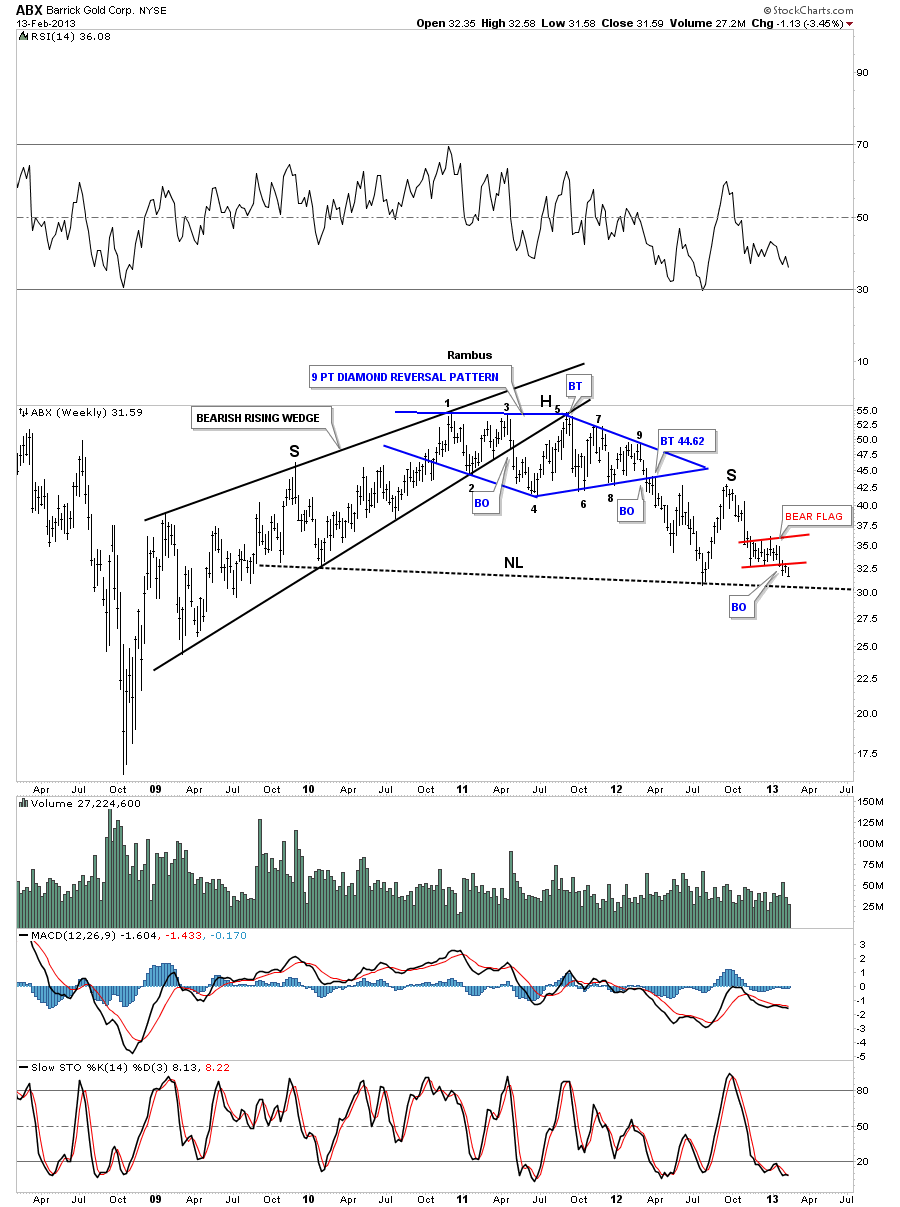
We have to look at the weekly chart to put the daily look into perspective. The placement of the bear flag on the daily chart above is very important as its forming just above the big neckline. That little bear flag may have enough energy to move the price of ABX below the big neckline.

abe weekly

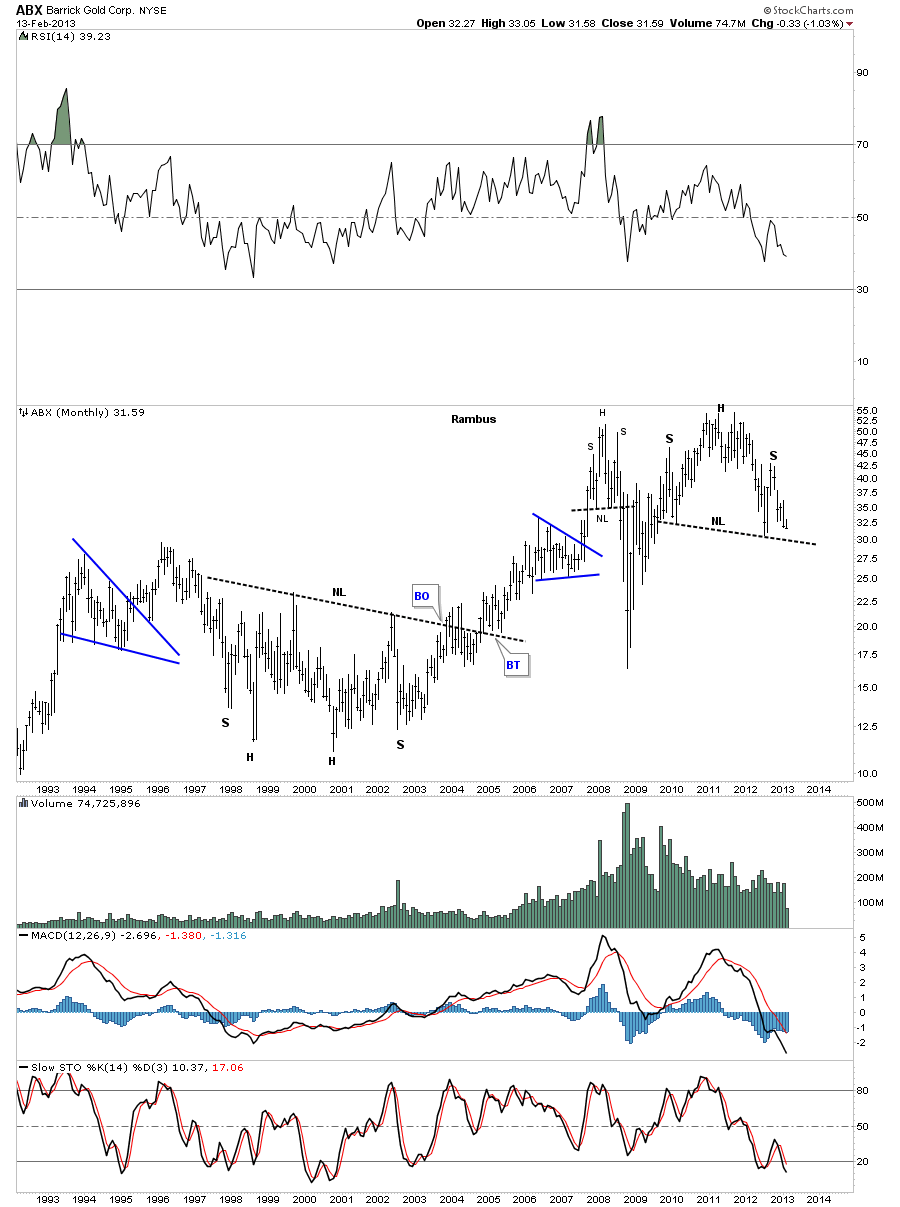
The long term monthly look at the H&S top. Note the multi year base that lead to the bull market in ABX.

abx month

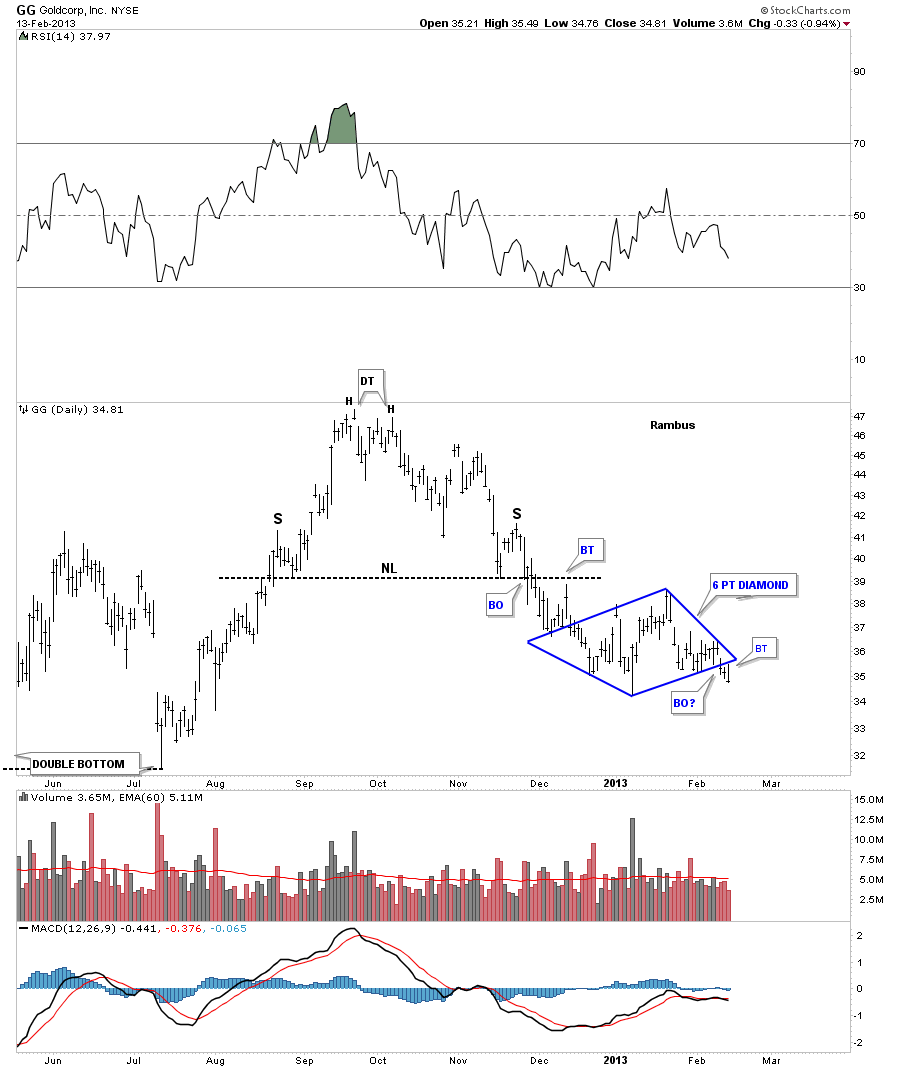
GG is another big cap precious metals stocks that is showing some deterioration on the daily chart. After completing a H&S top last fall GG has been building out a 6 point blue diamond consolidation pattern just below the neckline. Today’s move backtested the bottom blue rail before selling off for the rest of the day.

GG DAY

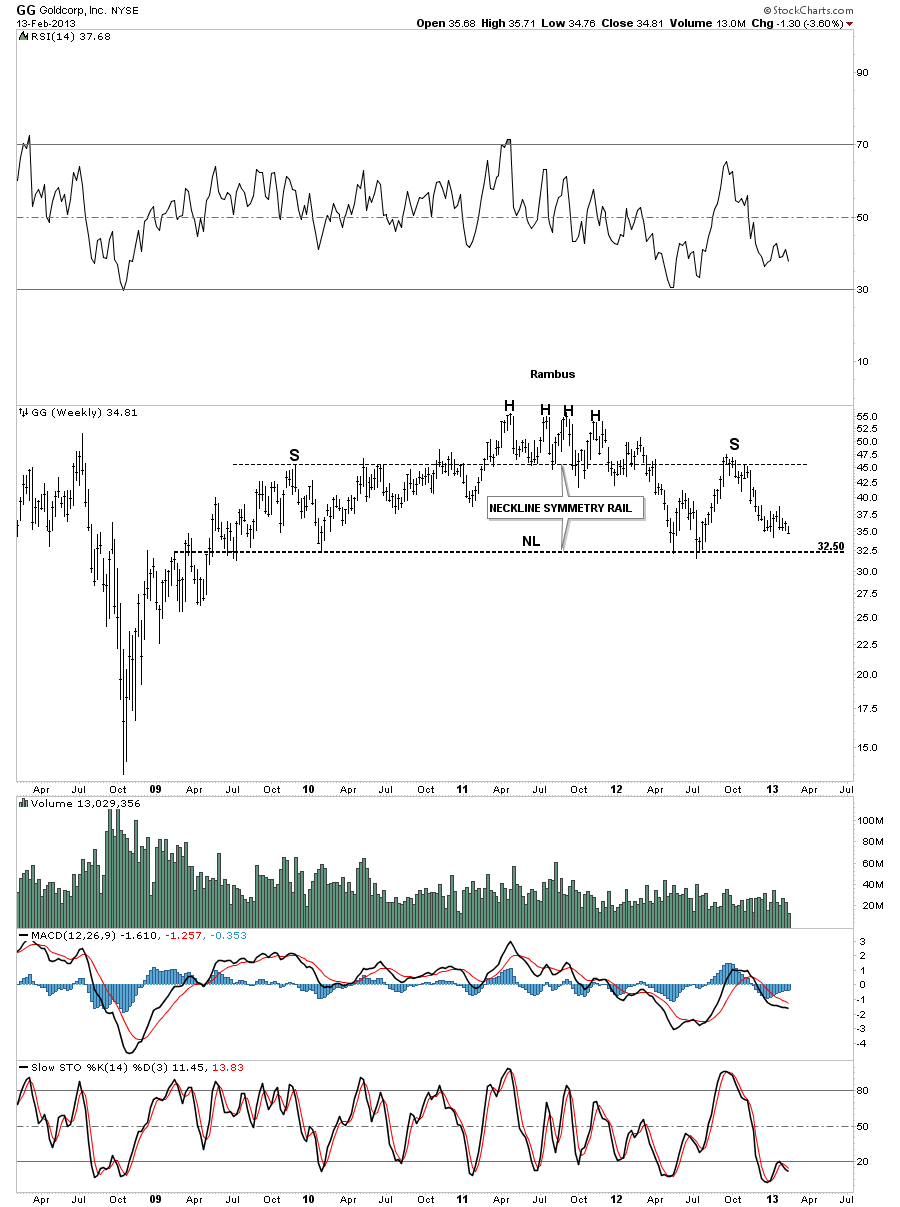
The weekly chart shows the all important neckline, that comes in at the 32.50 area, as the bulls last line of defense that needs to hold.

GG WEEKLY

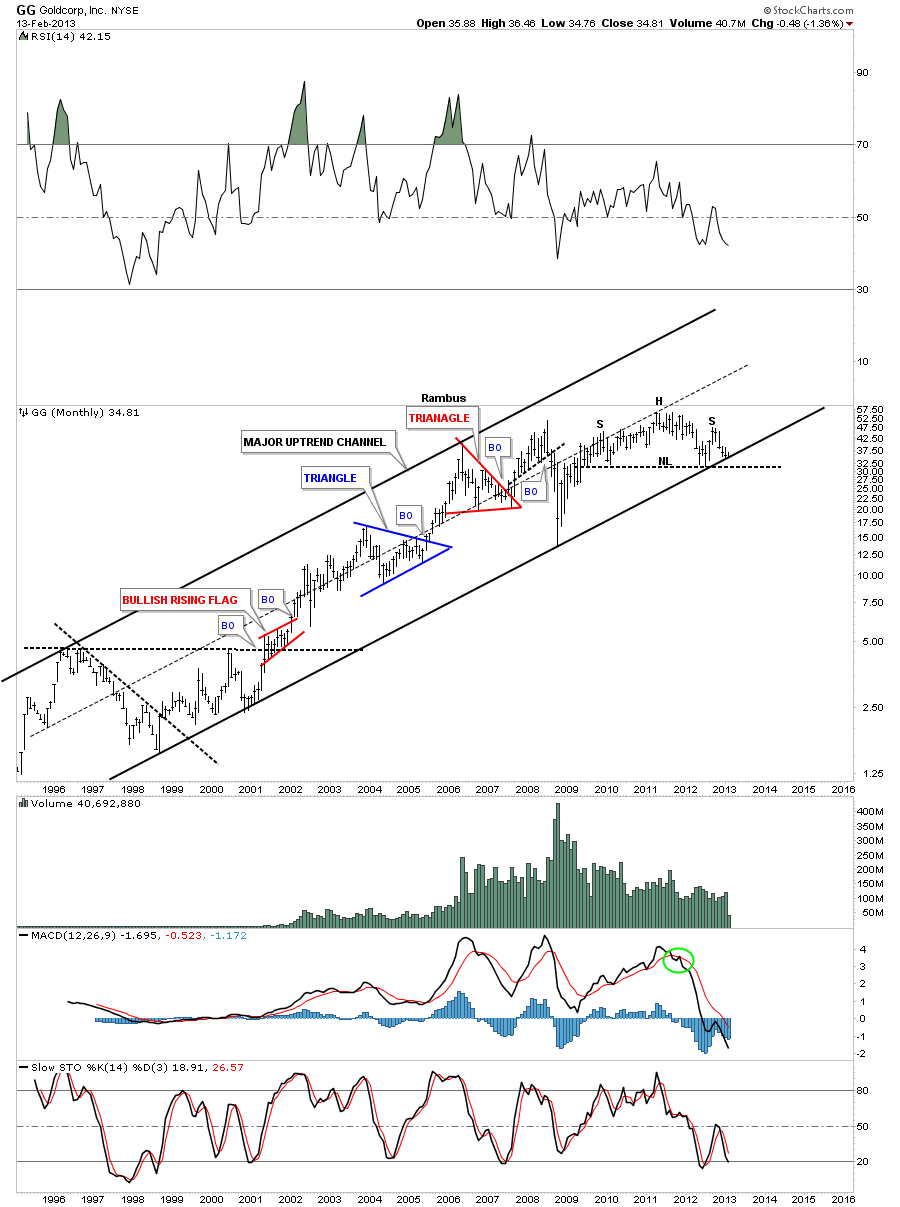
The monthly look at GG is interesting because of where the H&S top is forming.  As you can see on the chart below there is an uptrend channel that has been in place since 1998 or so. If the H&S top plays out that means the big multi year uptrend channel will be broken to the downside. Also seeing a massive H&S reversal pattern sitting on top of the long term uptrend channel should give even the most bullish bulls a reason to reflect on what maybe possible if the H&S plays out. Keep in mind I’m only the messenger.

gg monthl

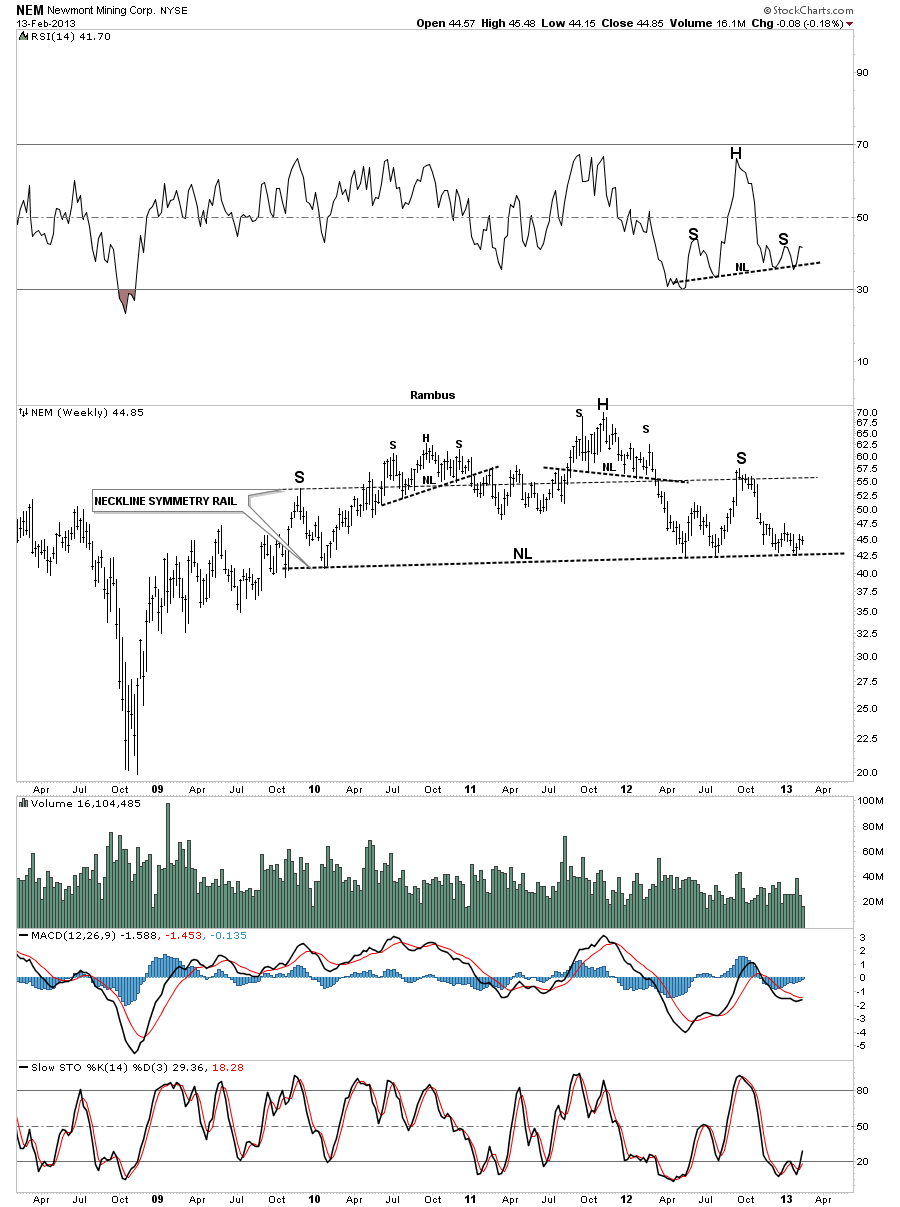
Lets now take a look at a weekly bar chart for NEM that is showing a massive H&S top pattern. This chart shows the neckline symmetry rail, parallel neckline rail,  that showed us where to look for a possible top to the right shoulder. You can also see the 4 touches, of the big neckline, in the area of the right shoulder so we know that neckline is hot and to be respected. If it gives way it will reverse it’s role and act as resistance on any backtest.

nem weekly

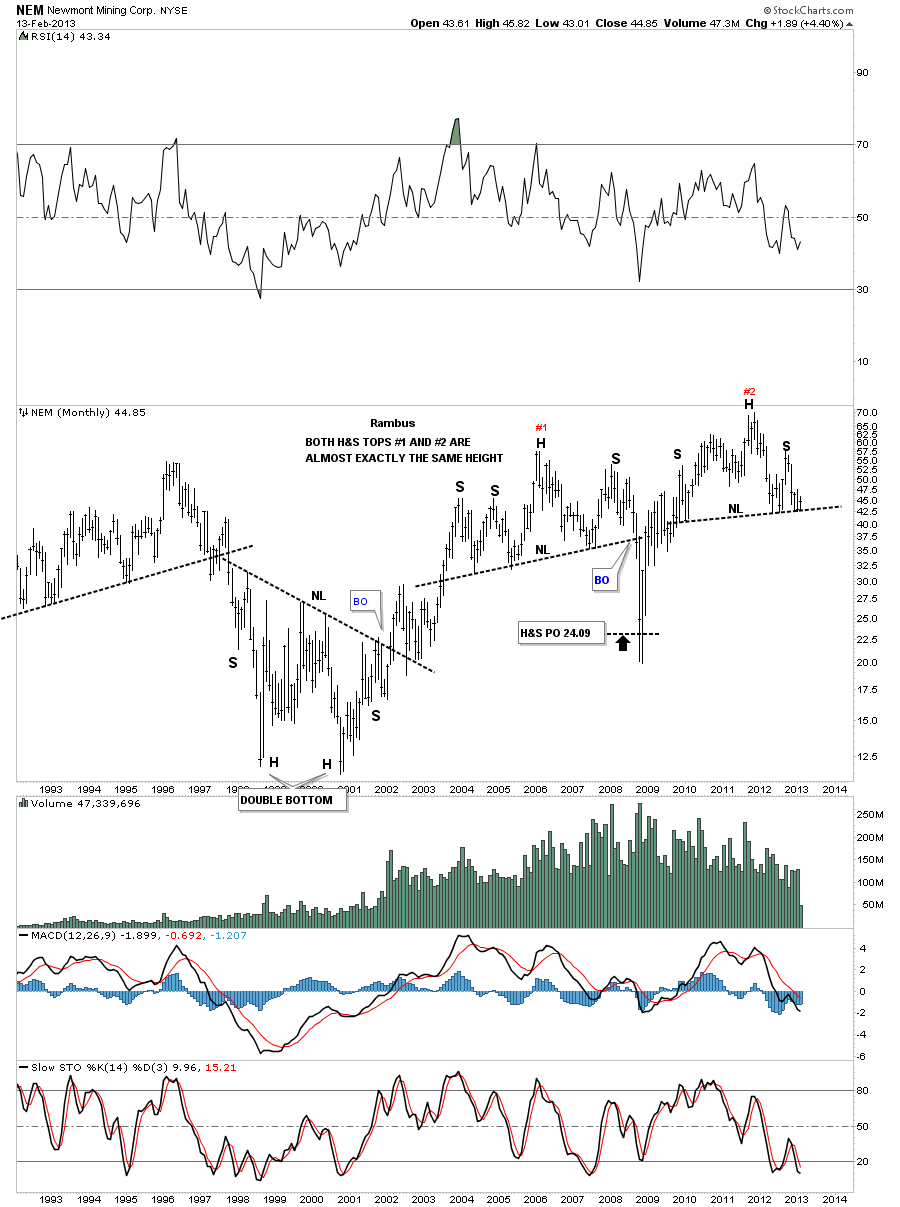
The monthly look shows our H&S top that is almost exactly the same height as the H&S top that formed just to the left.

nem monthly

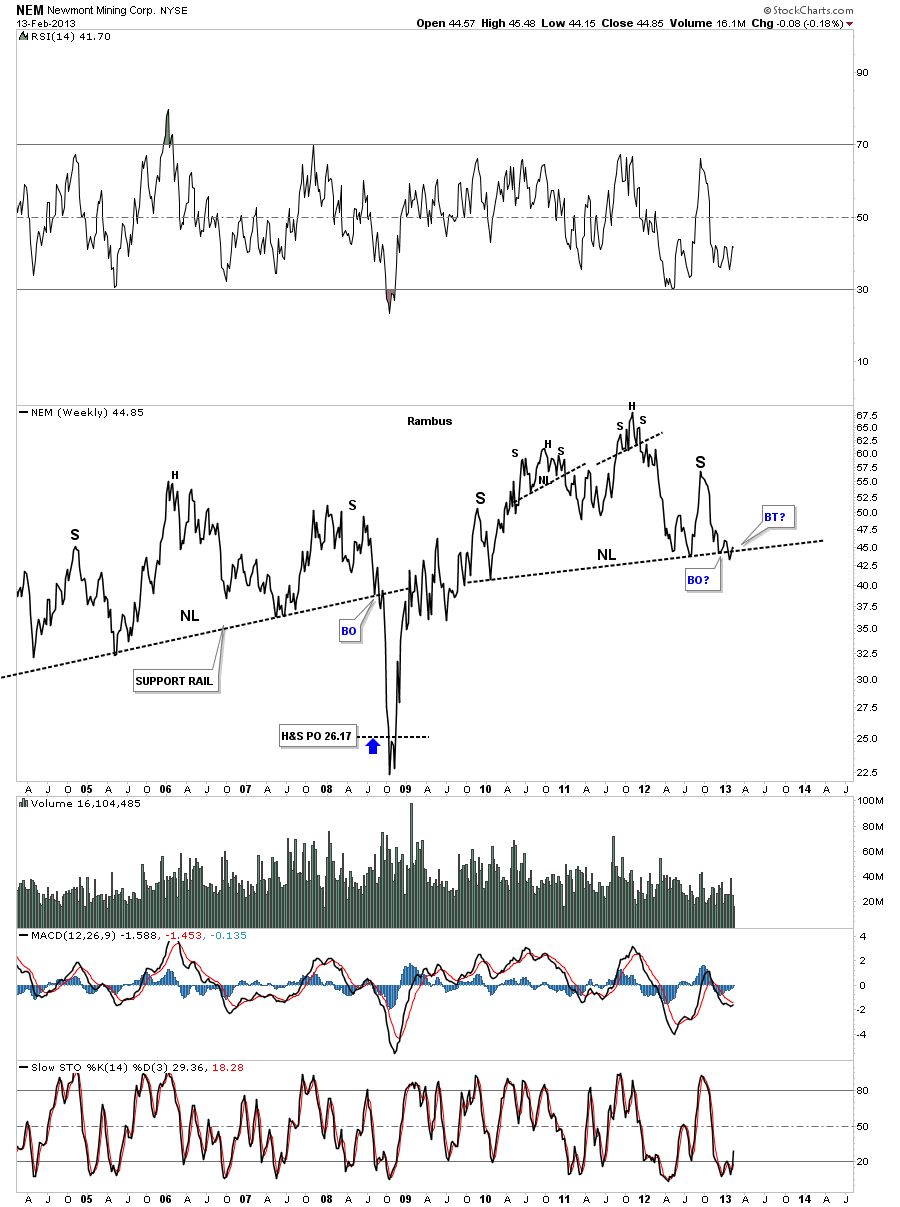
Lets look at one more chart for NEM that is a weekly line chart. As you can see on the chart below it has been testing the breakout point of it’s big H&S top pattern. So far nothing definitive but it looks like the neckline is being backtested from below.

nem weely line chat

As I have shown you on the charts above the biggest of the big cap precious metals stocks have yet to really break below their respective necklines. Now I would like to show you some other precious metals stocks that have already broken below important topping patterns while the big caps are running interference, taking the investors eye off the ball.

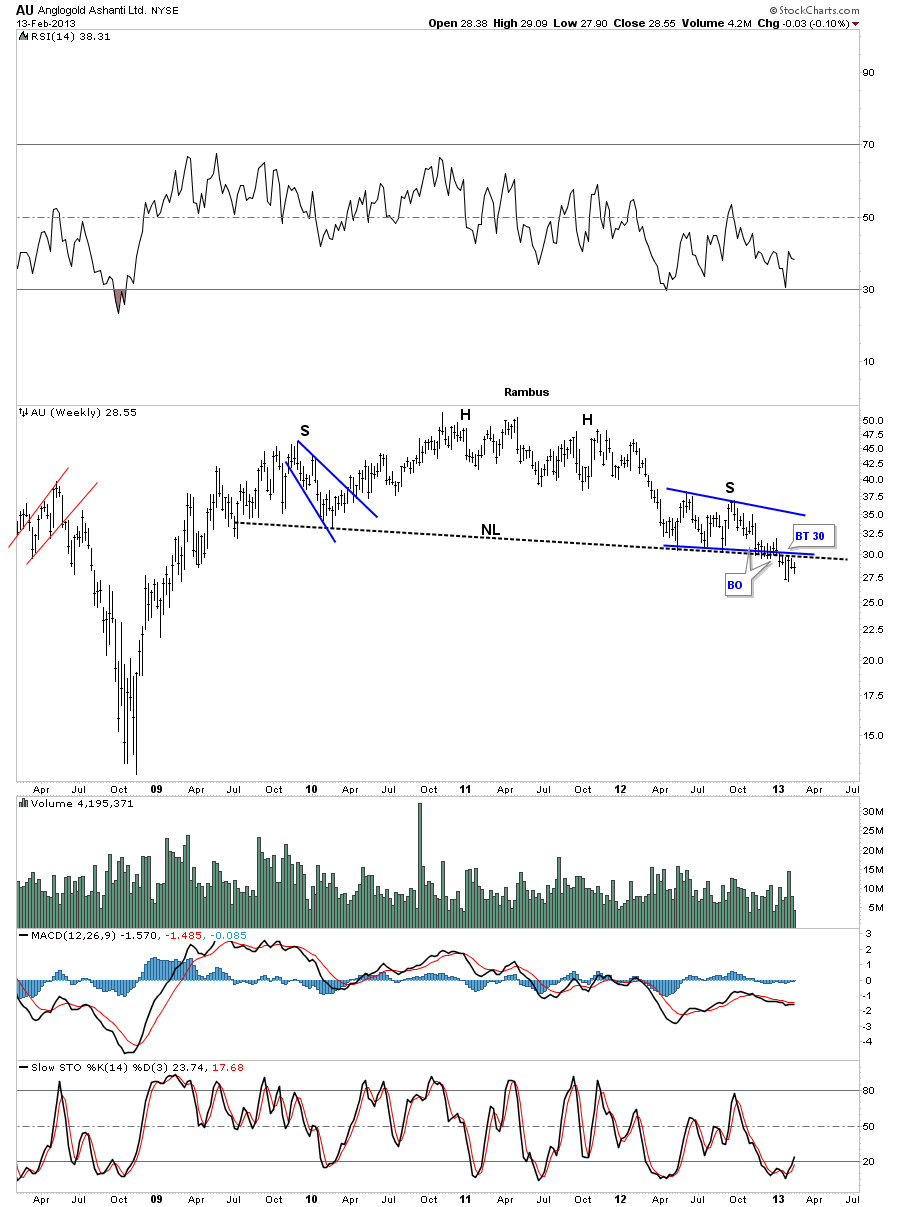
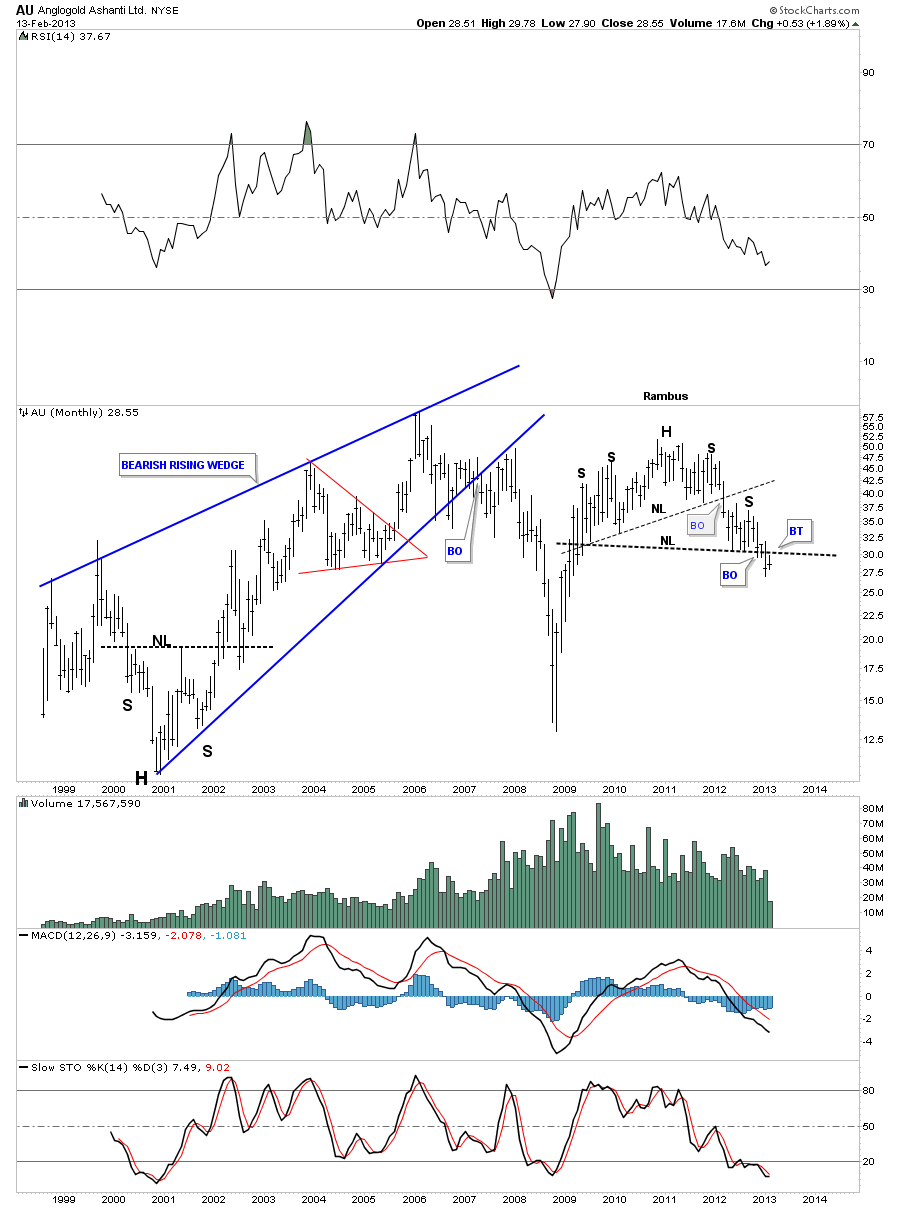
AU has been trading below it’s big neckline for 6 weeks or so and has completed a backtest to the 30 area.

au weekly

The AU monthly look shows the double H&S top.

au monthly

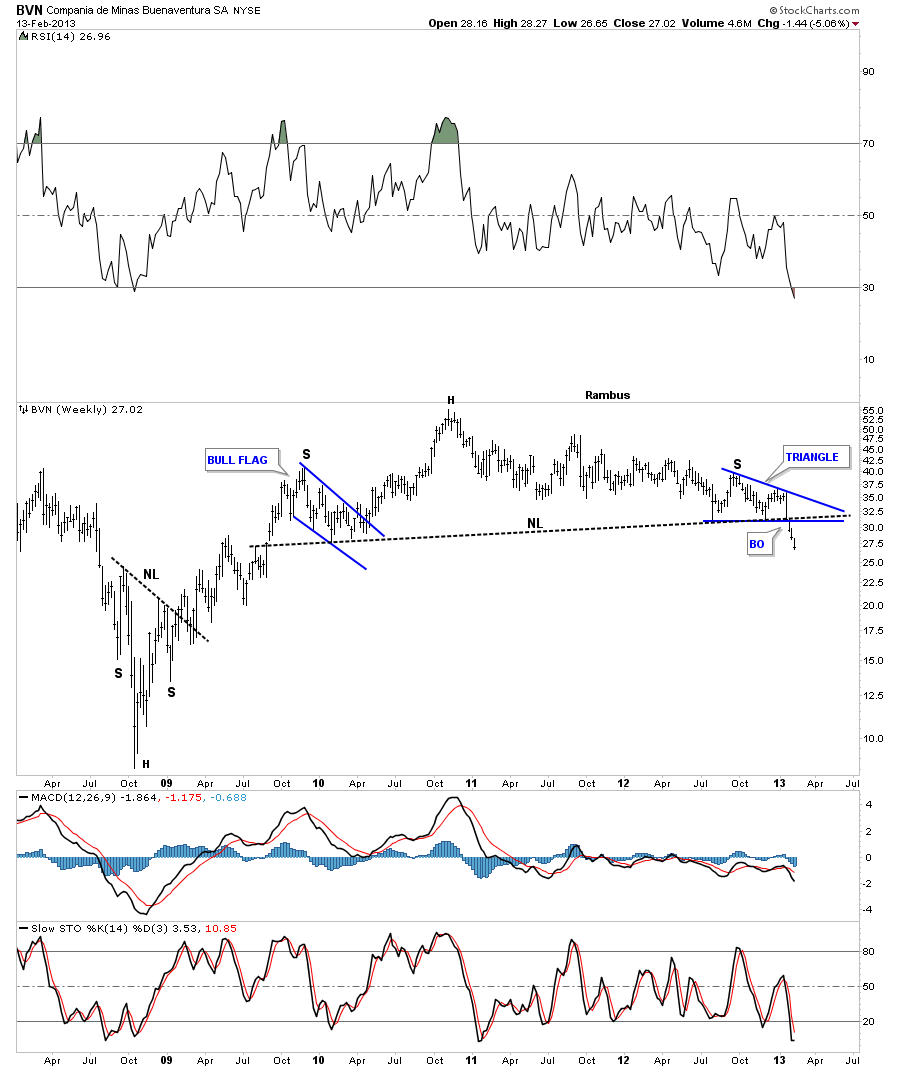
BVN has been trading below its massive H&S top for 3 weeks now.

bvn

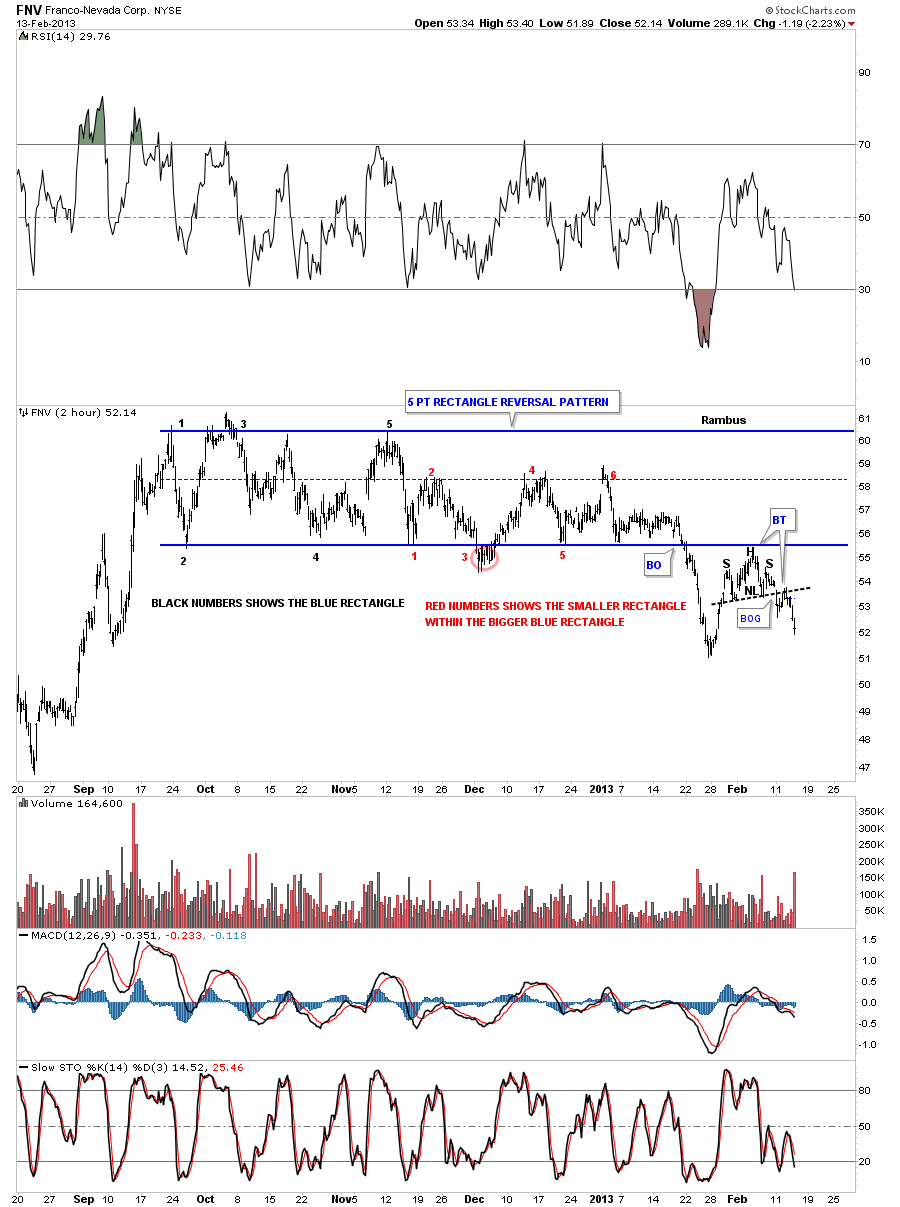
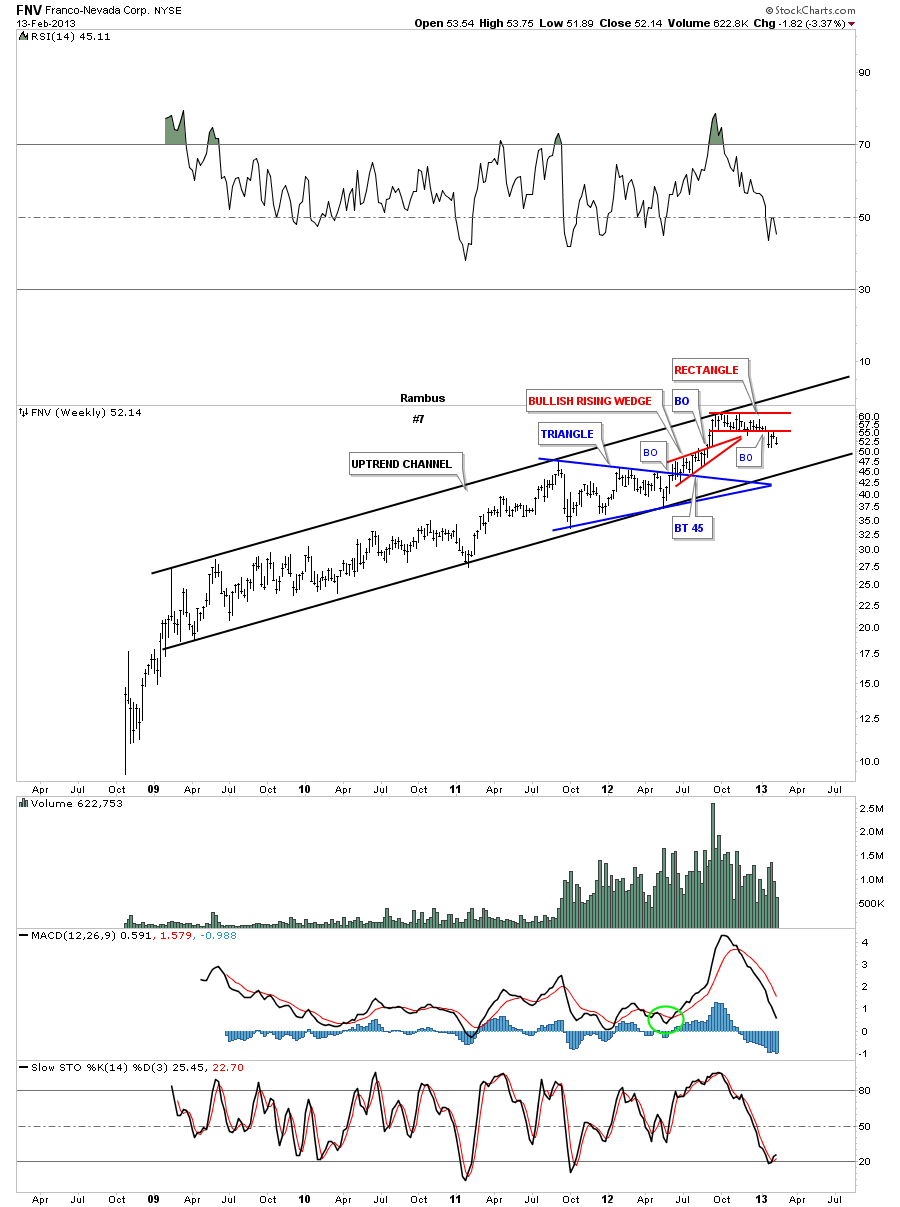
All the reversal patterns have not been of the H&S variety. Below is a 60 minute chart of FNV that shows a 5 point rectangle as it’s reversal pattern. Notice the smaller H&S pattern that formed on the backtest to the bottom blue rail of the 5 point rectangle. That’s an impressive backtest leaving no doubt that the bottom blue rail is HOT.

fnv 60 min

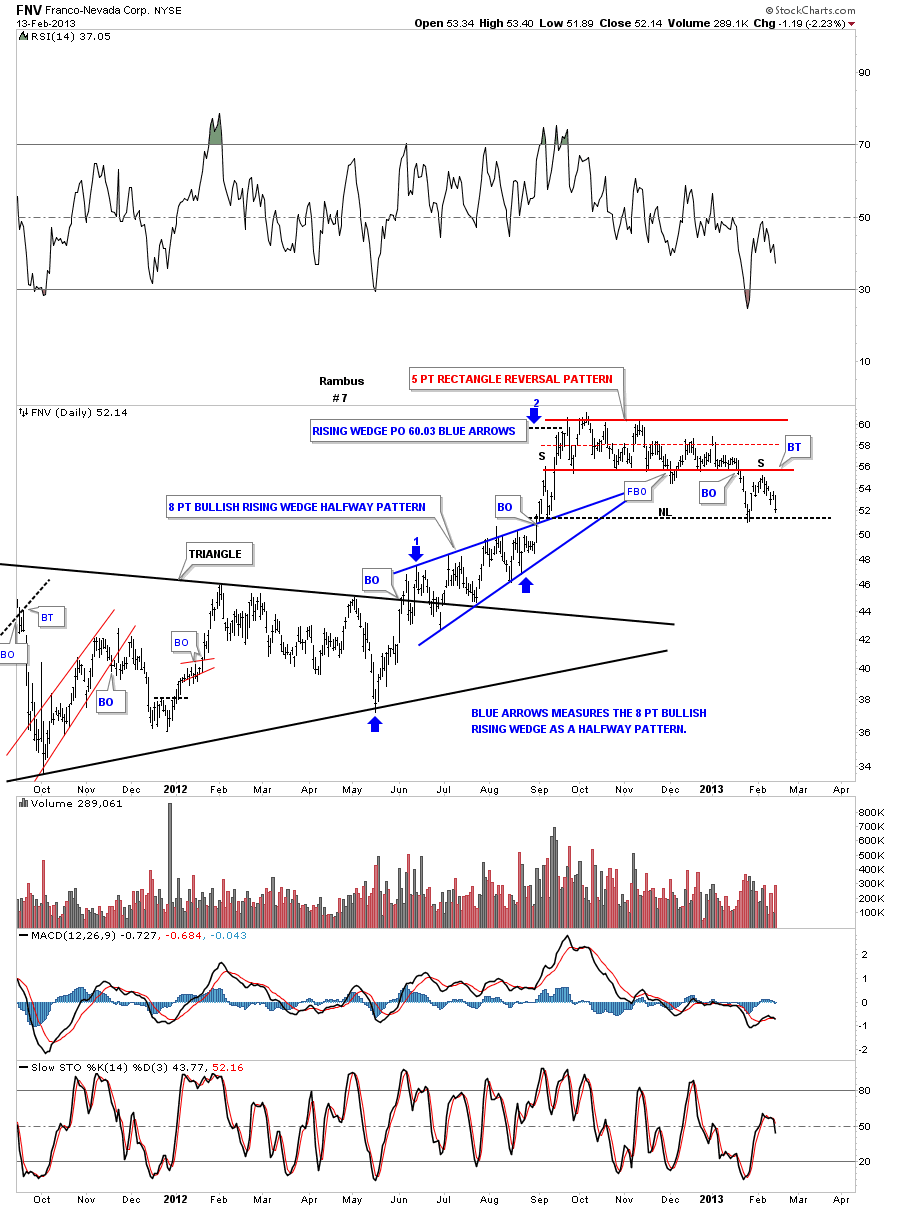
The daily chart shows how its reversing symmetry down as shown by the black dashed horizontal trendline that started off the September 2012 low. I could make a case for a H&S top using last September’s high and our current backtest high as a left and right shoulder.

FNV DAY

Again we have to look at the long term chart to put everything into perspective. As you can see FNV has been in a nice tight uptrend channel since 2009. It looks like at a minimum that the bottom rail of the uptrend channel will be tested at some point in the future.

fnv weekly

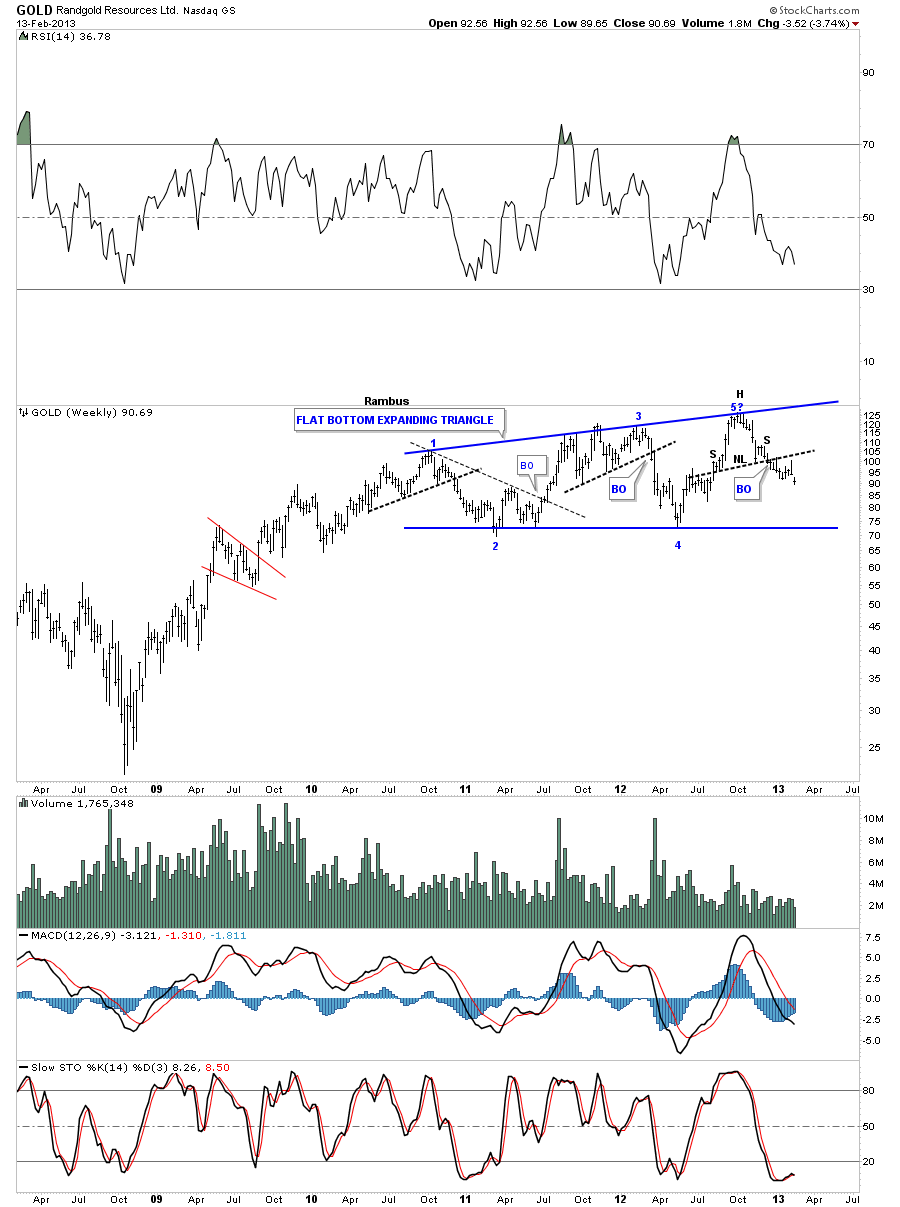
The Randgold weekly chart is showing a 5 point flat bottom expanding triangle as it’s potential topping pattern. It still has a ways to go yet but the small H&S top pattern that has formed at point #5 should get the price back down to the blue horizontal trendline.

rand gold

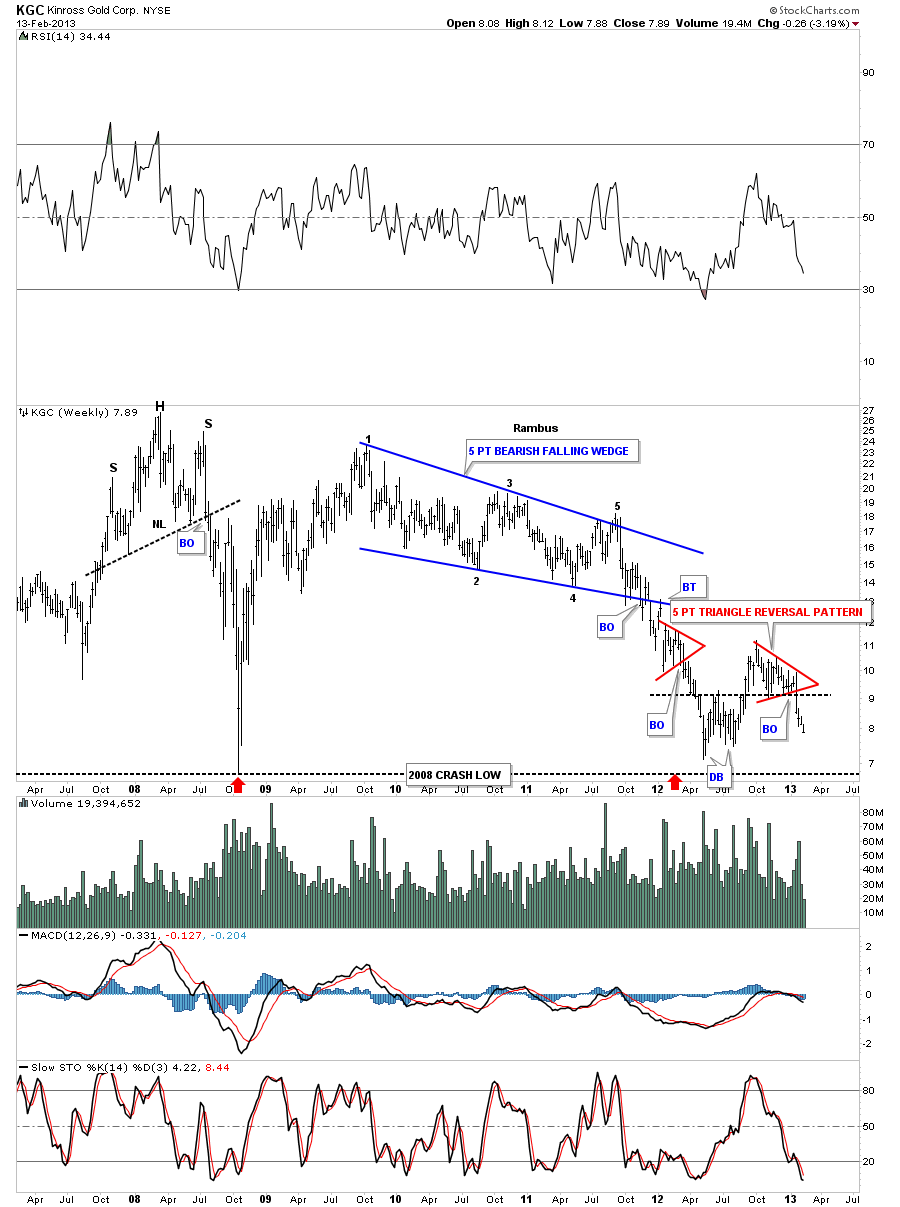
KGC is probably one of the weakest big cap pm stocks as it’s fast approaching the 2008 low. You can see it’s reversal pattern was a 5 point bearish falling wedge. Note the failure of the double bottom hump, on the far right hand side of the chart, to hold support. The reason it failed is because of the 5 point red triangle that reversed the small uptrend.

kgc day

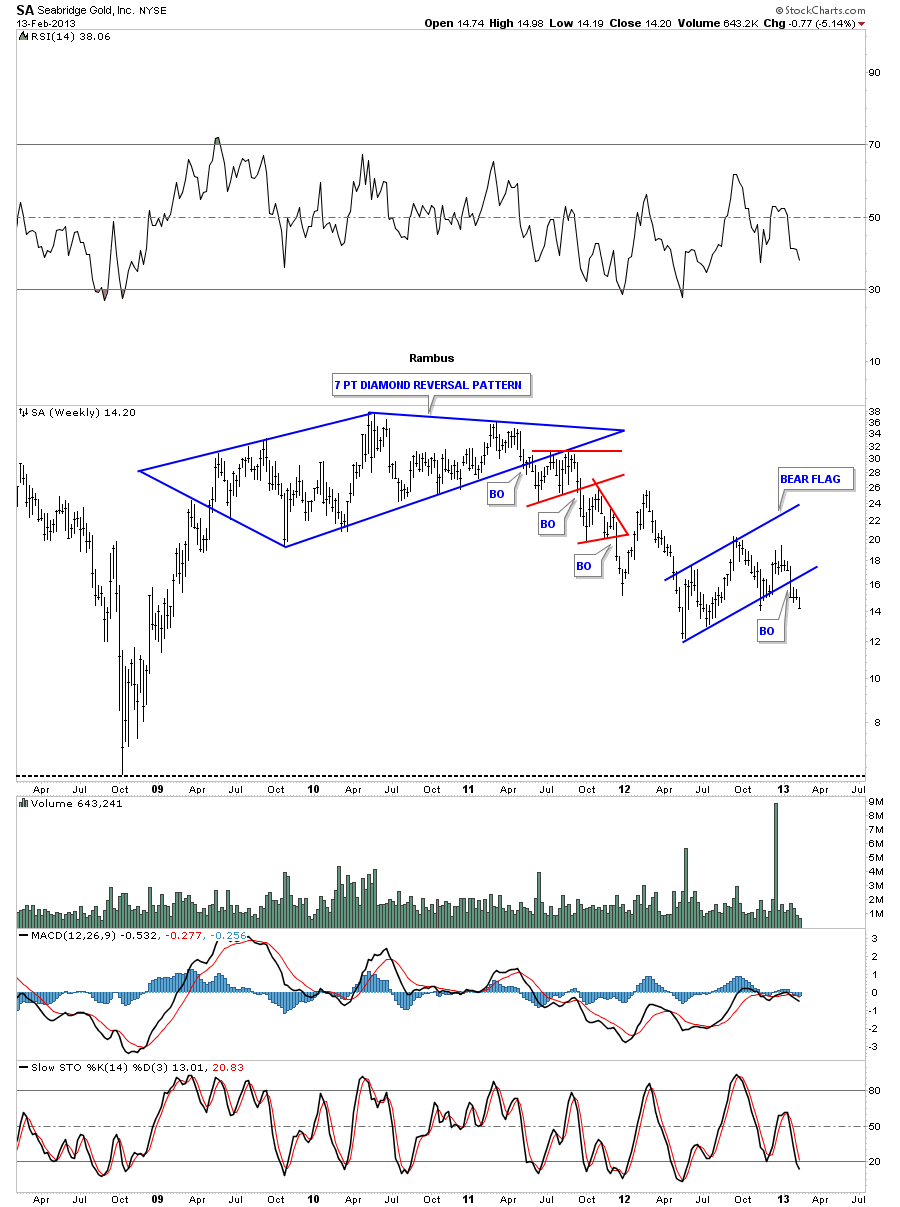
SA shows us a 7 point diamond reversal pattern that broke down in April of 2011. It now looks like it has just created a blue bear flag that broke down about 3 weeks ago.

sa week

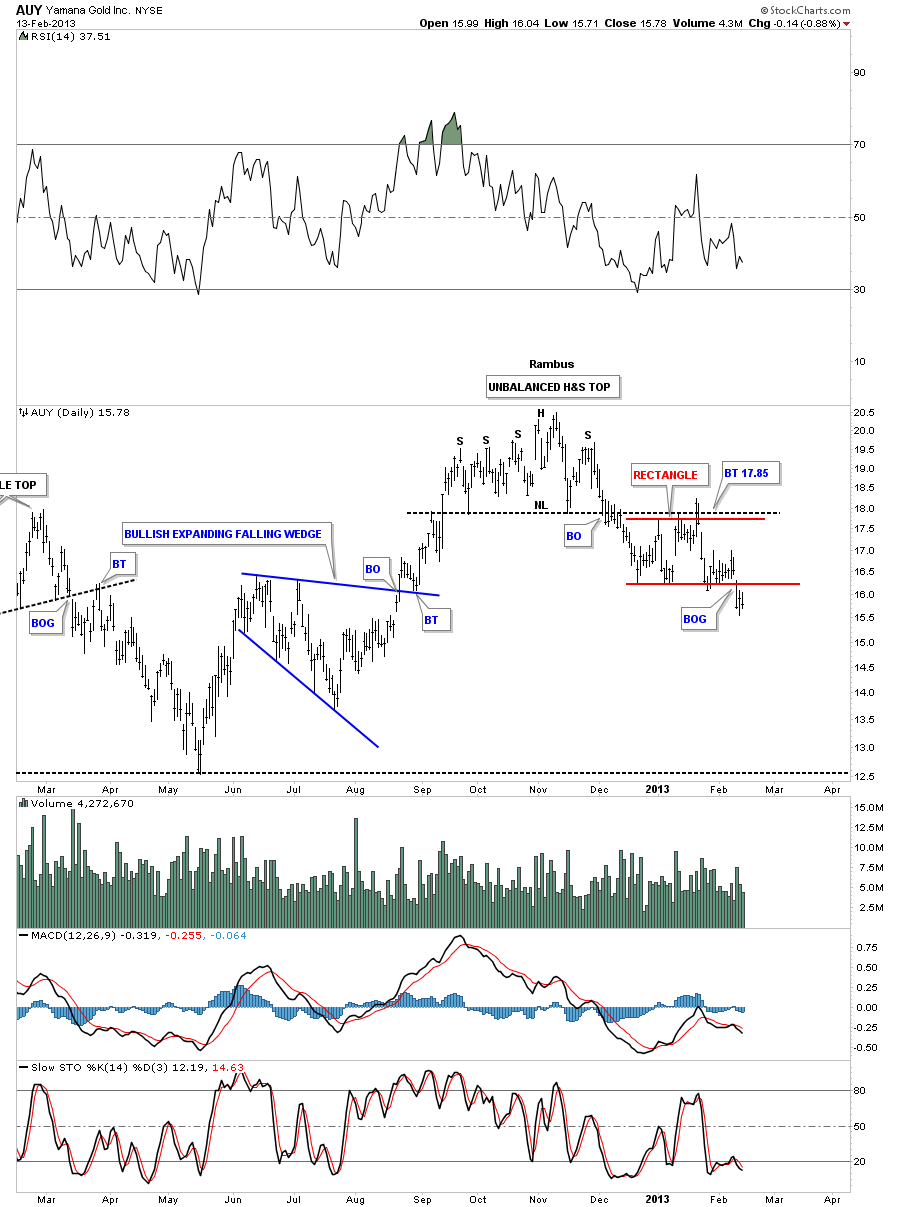
The AUY daily chart shows a H&S top that broke down in December of last year followed by the red rectangle that has formed just below the neckline. Its now 3 days into the breakout phase of the red rectangle.

AUY DAY

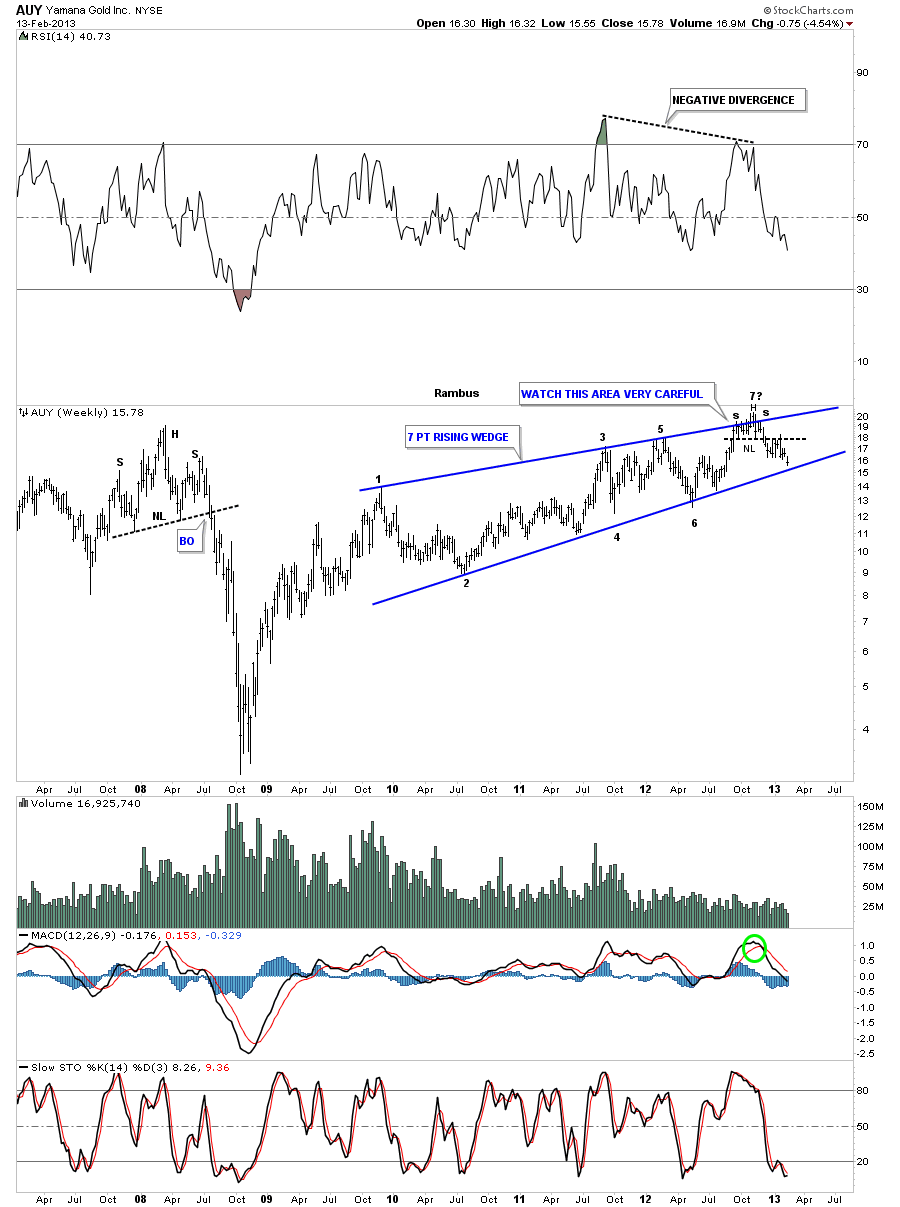
The weekly chart shows why the H&S top, on the daily chart above, is so critical to the overall bearish picture. The H&S top has formed at the top of a 7 point rising wedge. A break of the bottom blue rail of the rising wedge will complete a very bearish picture for AUY. If you own this stock keep a close eye on the bottom rail and act accordingly it it breaks down.

auy weekly

I could go on and show you more bearish charts for the big cap precious metals stocks but its getting late and I think you get the picture. Folks this article doesn’t take into account the small cap precious metals stocks that have been vastly under performing the big caps. The real carnage is in the small caps right now. If you are holding any then you will know what I mean.

As I stated earlier I’m just the messenger and have no axe to grind with the precious metals crowd as I have been following this sector since the spring of 2002. I wish I could be showing you some big reversal patterns to the upside but that’s not what the charts are showing. There is no bell that rings when a top or bottom is in place. There is only hard work in understating what the charts are telling us if we can keep an open mind. All the best…Rambus

More at

www.rambus1.com