This is one of the best Tutorials you will ever read. It is Epic. 3 Years ago JANUARY 2018 Rambus had become Uber Bullish on the Stock Markets at a time when most many traders looking for a top …and … Continue reading
Category Archives: public
Markets Update…End of the World History Chart : 2021 EDITION
Gallery

This gallery contains 6 photos.
We hear so much negativity from both sides of the isle that if a Republican is elected to the presidency then everything is going to hell in a hand basket and if a Democrat is elected then you will be … Continue reading
FULLY’S TIMELESS TUTORIALS : ANATOMY OF AN IMPULSE MOVE
Gallery

This gallery contains 1 photo.
The Year was 2013 . Rambus was navigating his subscribers through a waterfall decline in the Precious Metals. An Historic Waterfall after the Epic Run to almost $2000 . For most Goldbugs this was a horror story as they watched … Continue reading
FULLY’S TIMELESS TUTORIALS : WEDGES FACTS AND FICTIONS
Hi : I am Fullgoldcrown , Rambus Chartology Manager/Editor.
Some call me “Fully”. I have been with Rambus over a decade now and still consider myself a Chartology Student.
Rambus has taken Traditional Chart Analysis ( as originally developed by Edwards and Magee in their Iconic book originally published in the 50s “Technical Analysis of Stock Trends) and “tweaked ” it over the years , to add many nuances and observations based on his passionate study of the Art and Science that make up his body of work which we call Chartology.
I will be presenting one Tutorial every Wednesday to help those who are interested in this fascinating and profitable body of work.
“Give a man a Chart and he may thrive for a day. Teach a man to chart and he may thrive for a lifetime.” Anon
We’ll Start with one of my favorites . This was an eye opener for me when first published On New Year’s Eve 2012. Enjoy.
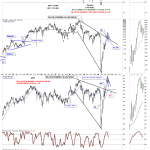
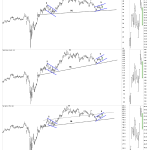
WEDGES : FACTS AND FICTIONS
Markets Update…Precious Metals Yellow Flag
Gallery

This gallery contains 11 photos.
Most of the time during a bull market the short, intermediate and long term charts are pretty much in sync even during a consolidation phase. Consolidation patterns are needed to bring the overbought condition back to what is normal for … Continue reading
Markets Update…
Gallery

This gallery contains 9 photos.
Lets start with the daily bar chart for the pm complex which has the horizontal black dashed S&R line taken from the previous high. Think of them as more of a support zone, brown shaded areas on the left side … Continue reading
Quarterly Report Stock Markets…A Secular Bull Market for the Ages
Gallery

This gallery contains 11 photos.
In this last post for the Quarterly Report I would like to update some very long term charts for some of the US stock markets and other areas to see how this secular bull market has been progressing since the … Continue reading
Wednesday Report…Precious Metals and Commodities Comprehensive
Gallery

This gallery contains 5 photos.
For the last 2 days our internet has been down which really makes you appreciate this miracle invention. We’ve had intermittent problems through the years that no one has been able to figure out until today. The phone company finally … Continue reading
Markets Update…PM Trading Range Doing It’s Job to Confound Bulls and Bears Alike
Gallery

This gallery contains 4 photos.
The trading range on the HUI and other PM stock indexes continues its job of confusing both the bulls and bears alike. I’ve always said that trading an impulse move is much easier than trading during a consolidation phase. During … Continue reading