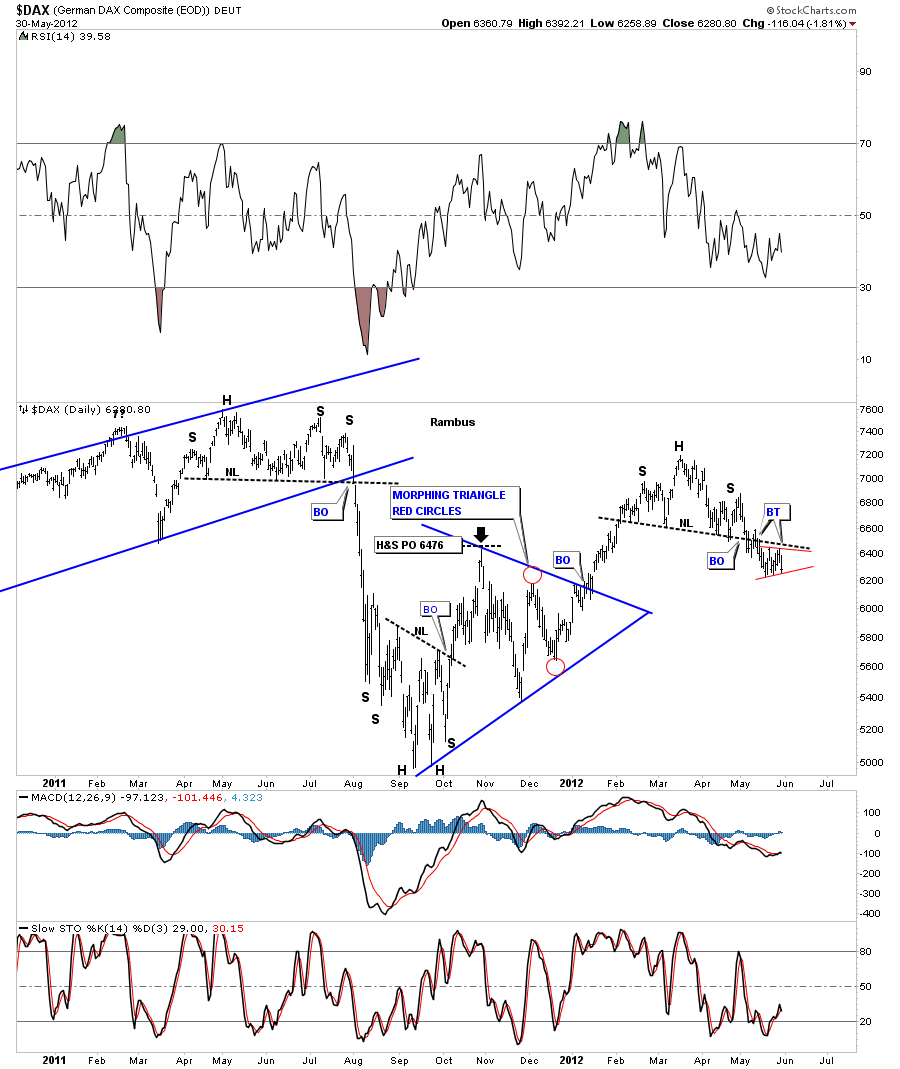
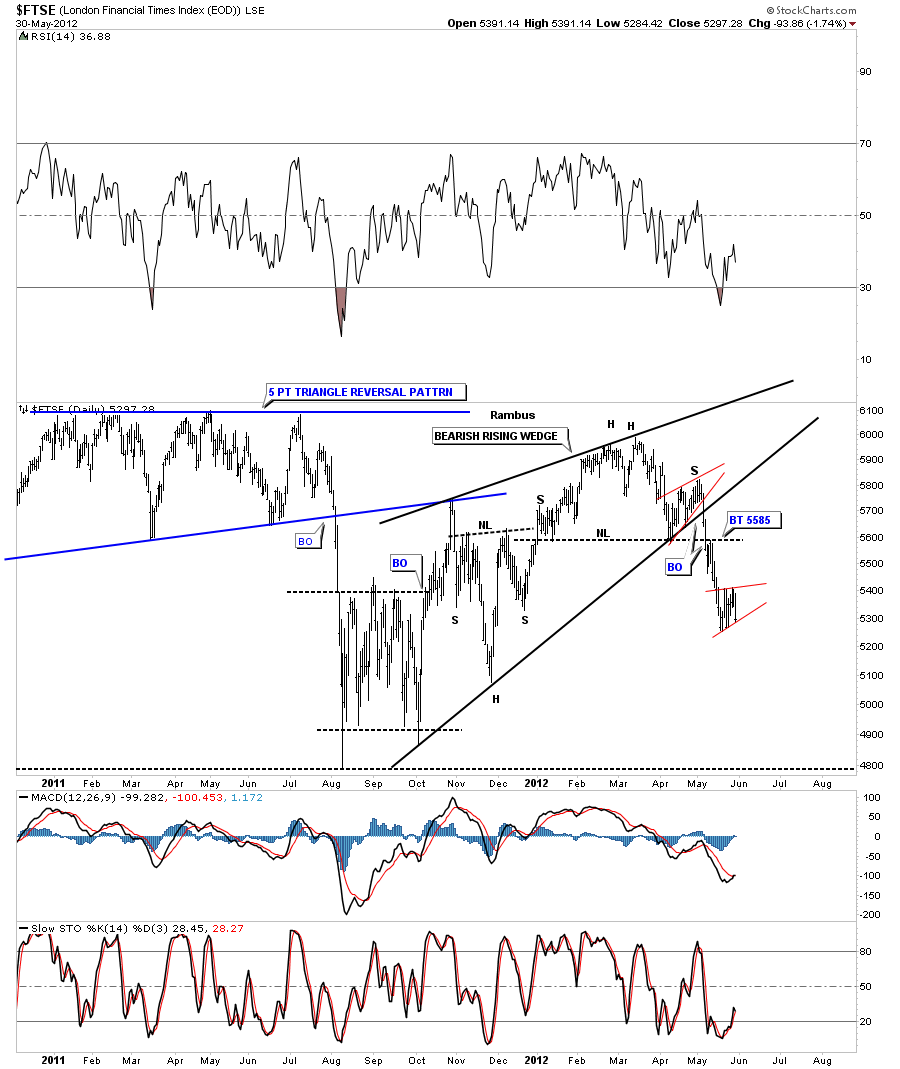
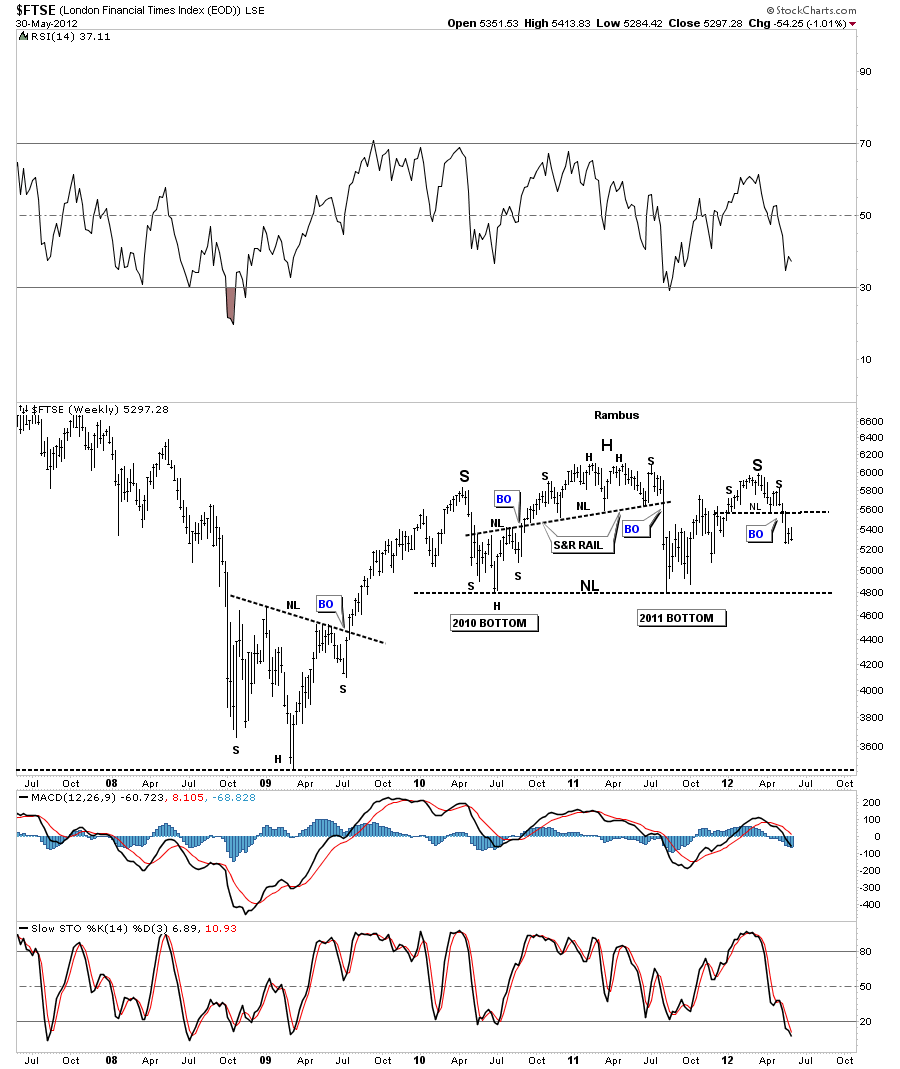
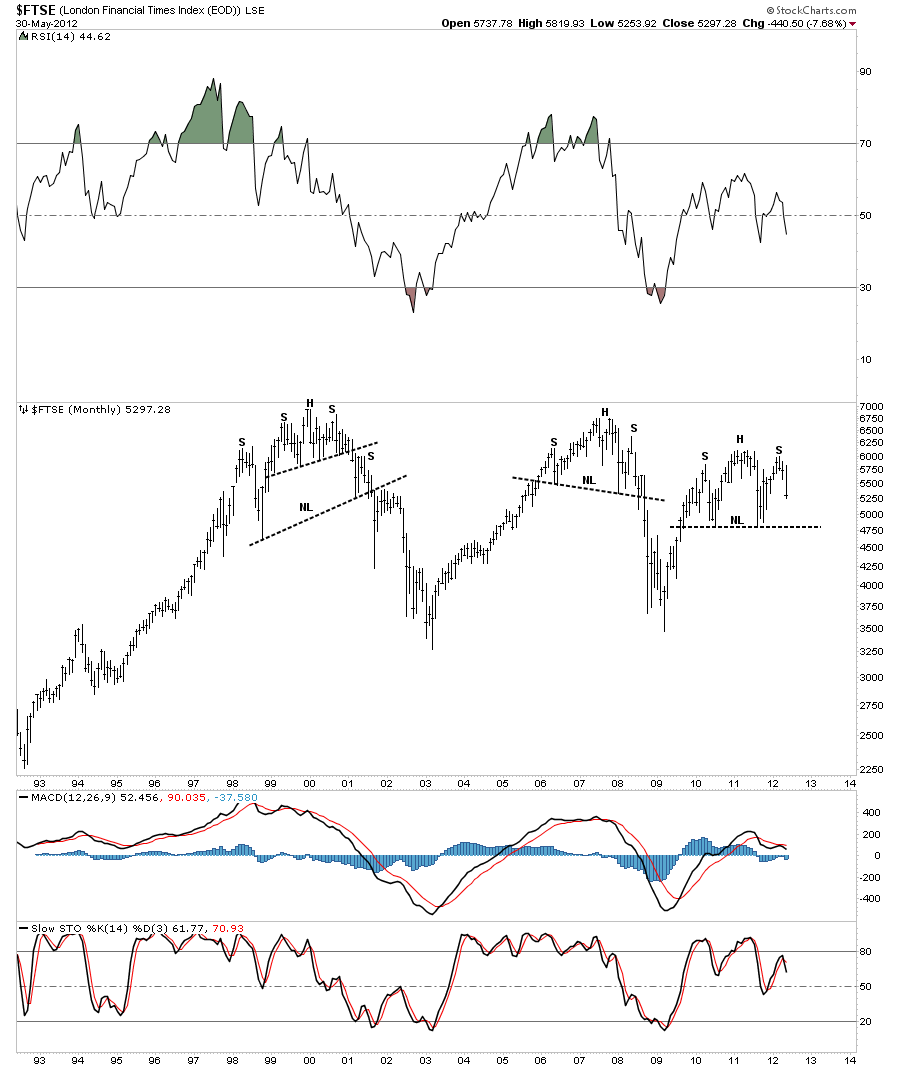
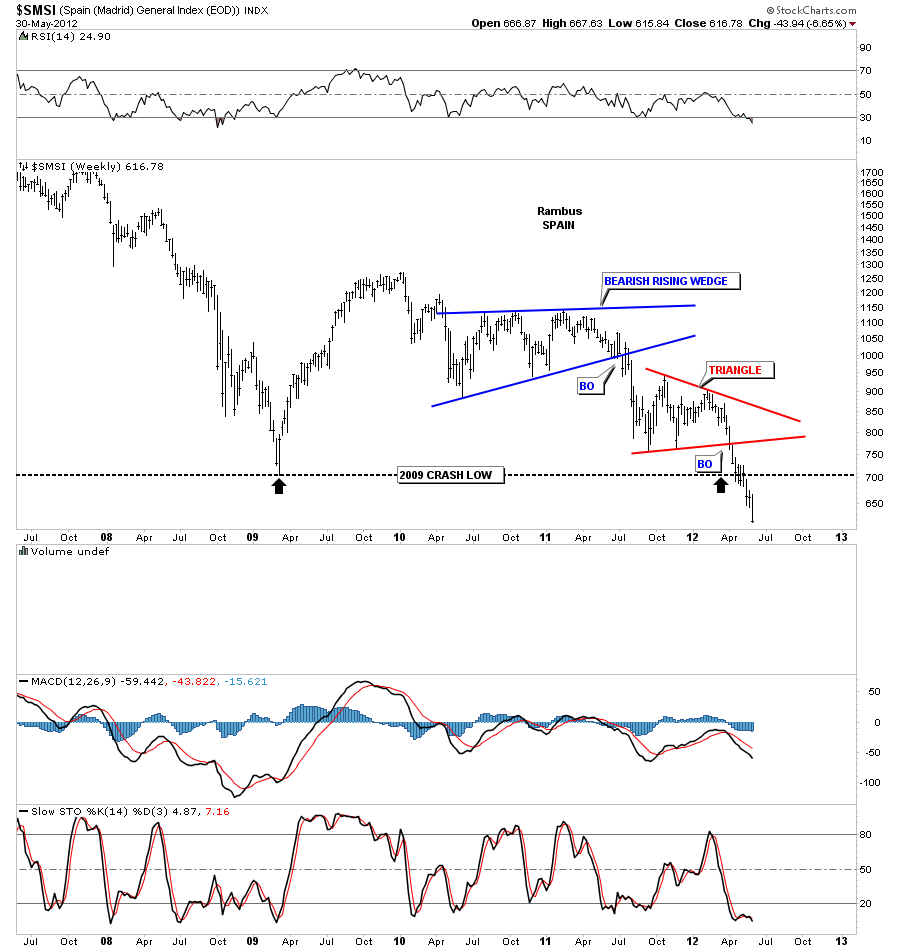
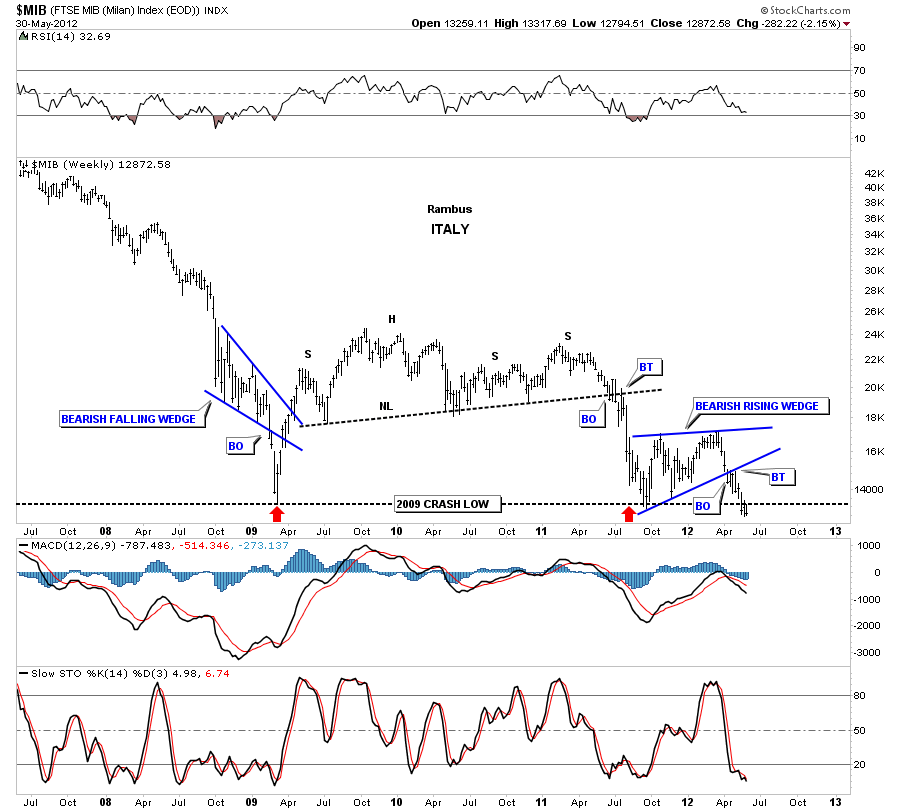
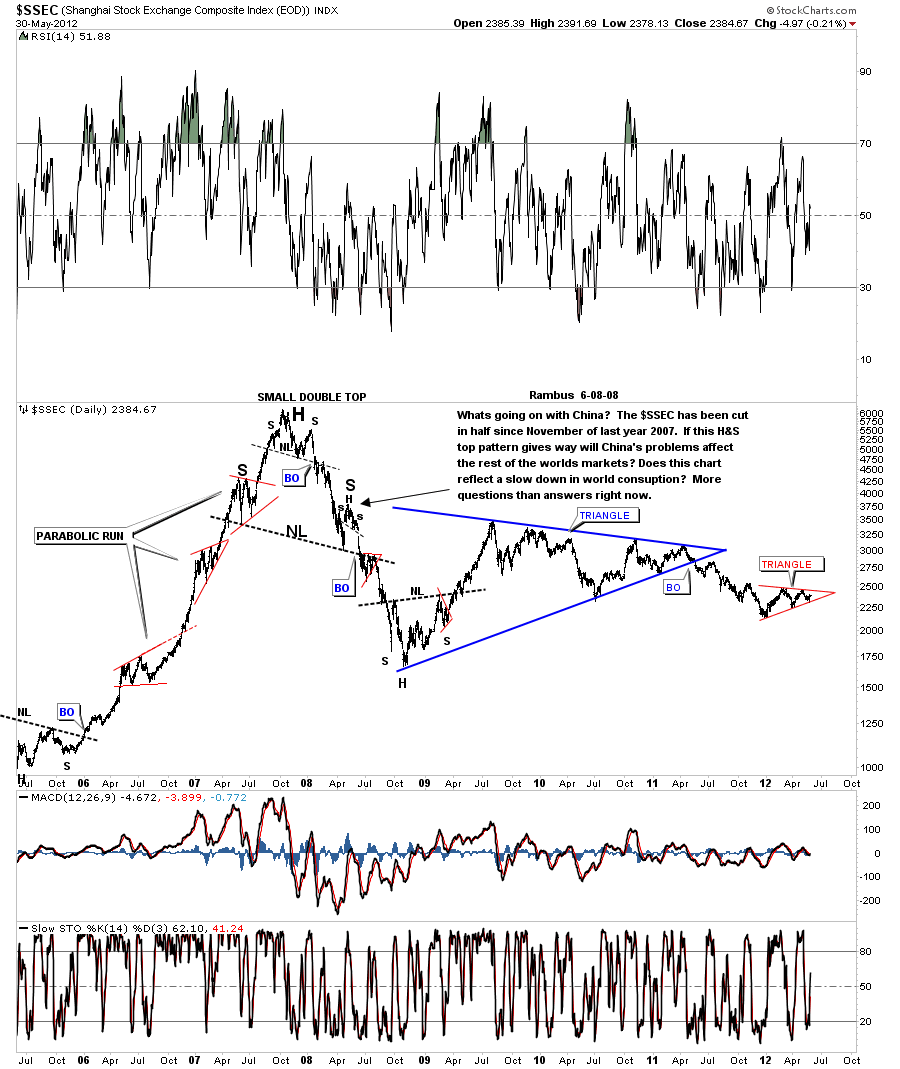
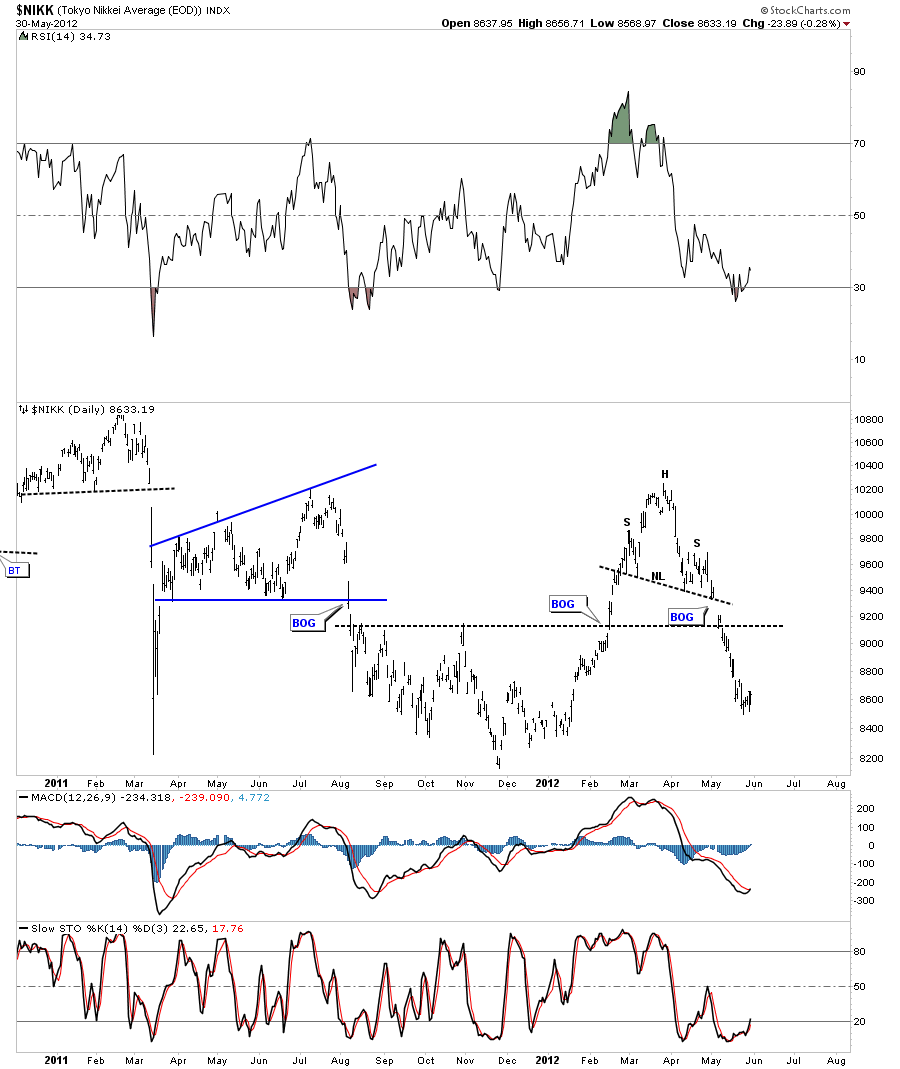
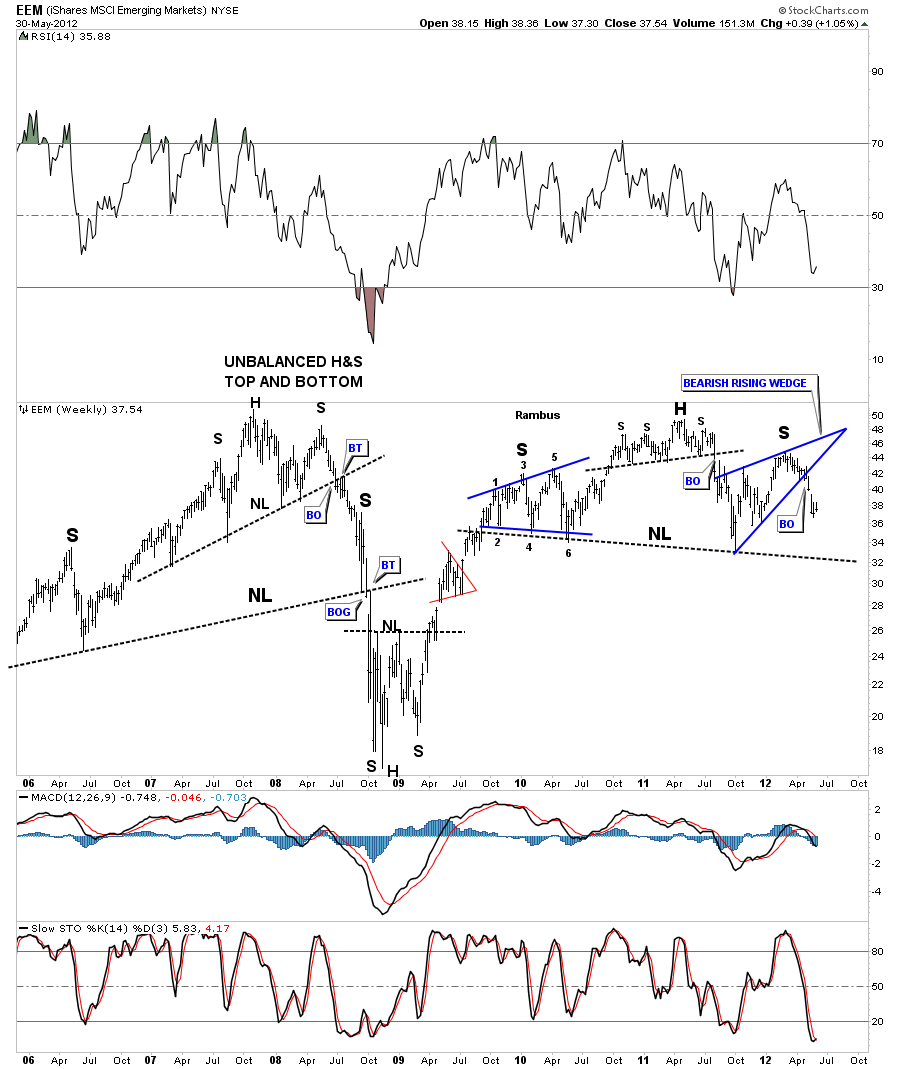
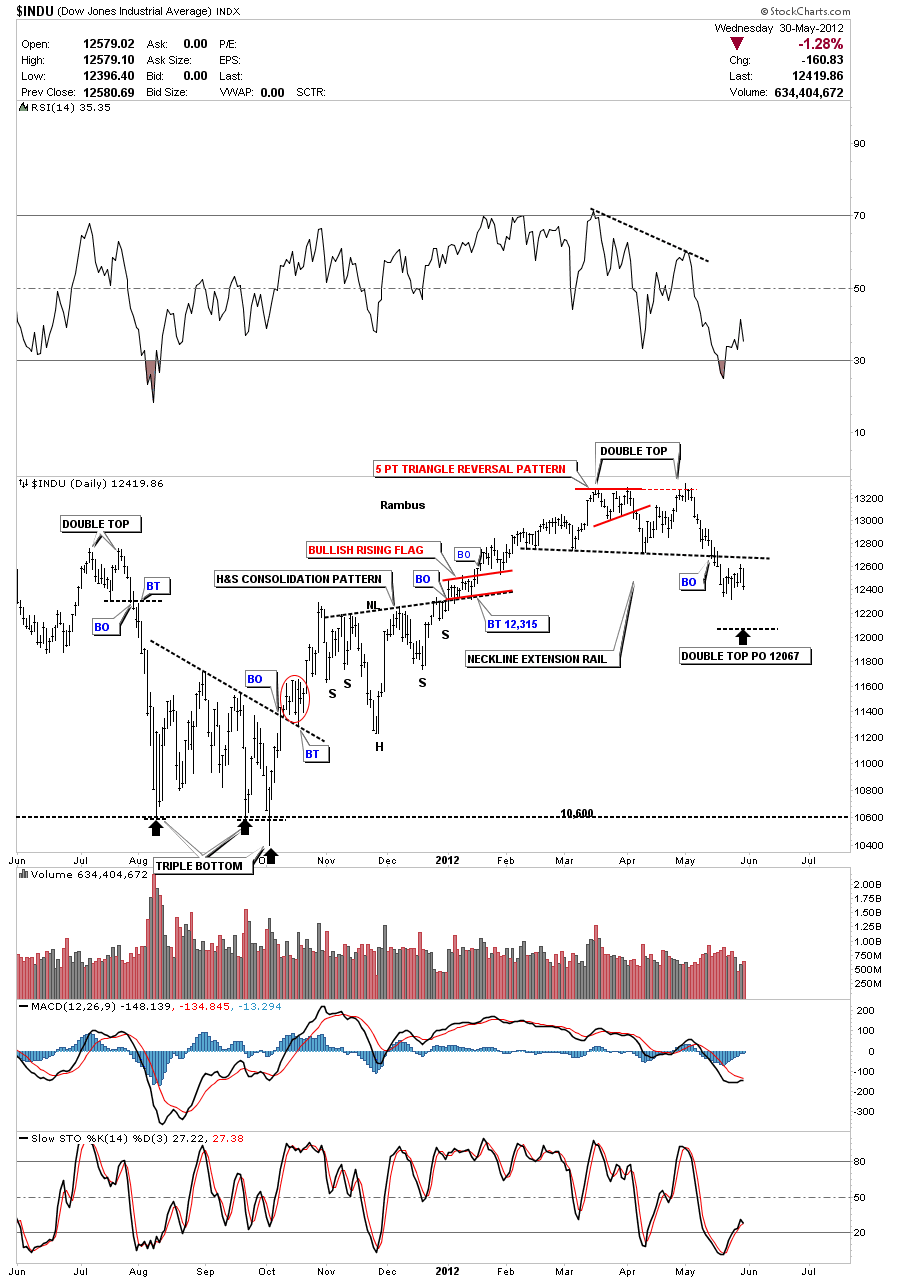
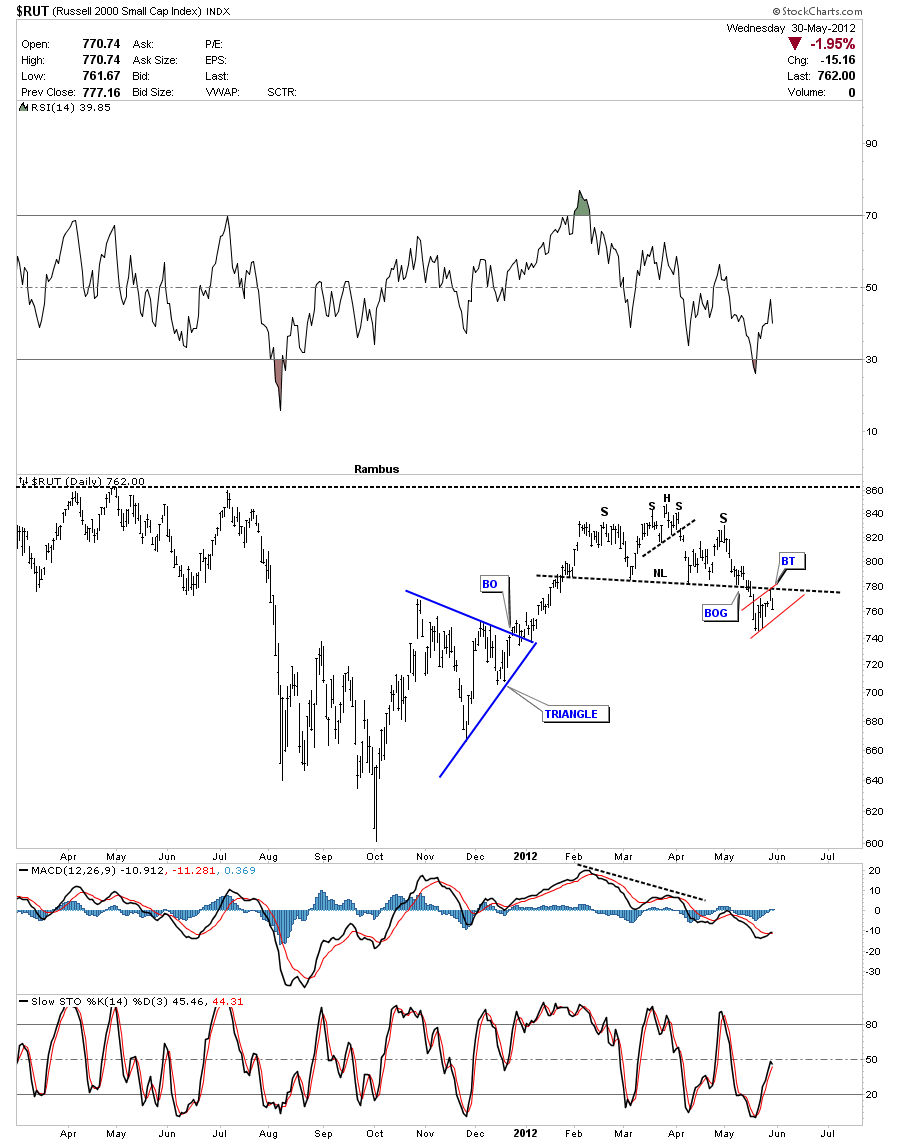
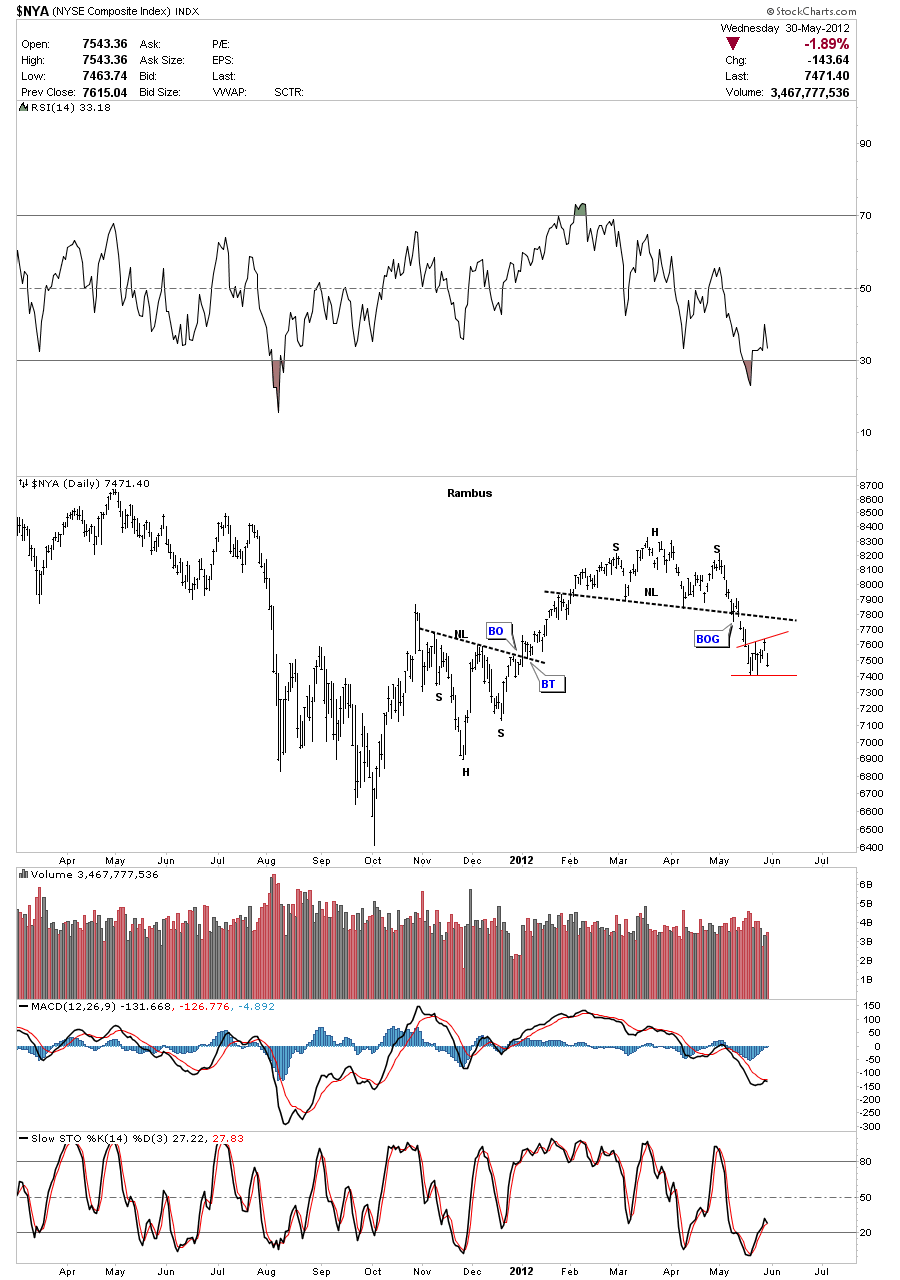
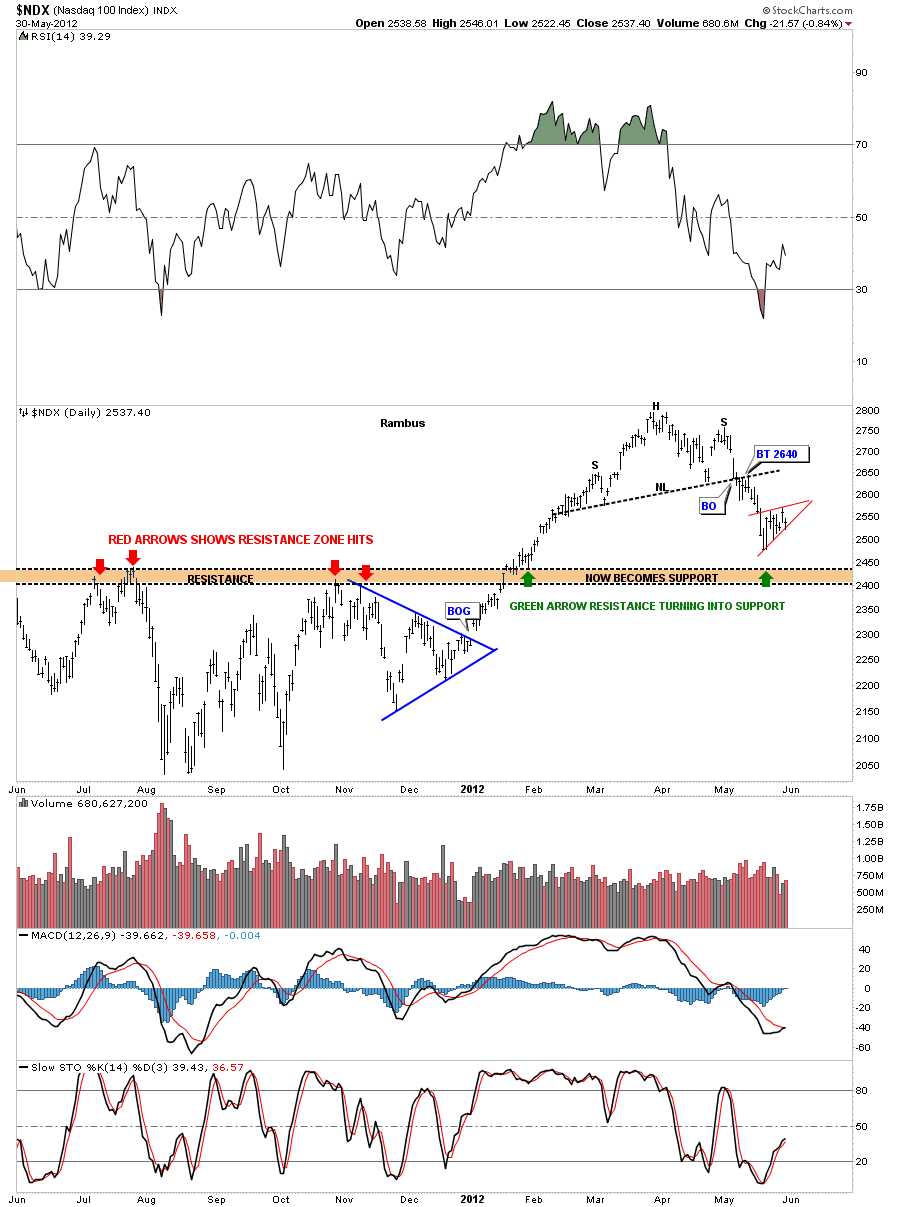
In this weekend report I want to expanding on the Wednesday Stock Report that dealt with many of the global stock markets that have H&S tops that are in play right now. The global stock markets are telling us something is very wrong and we should pay close attention to what they are saying. In part 2 of this report I want to focus in on some other areas that are showing a contraction taking place such as oil, and many different commodities that are breaking down right now. Putting all of these different categories together is painting a deflationary picture on a worldwide scale.
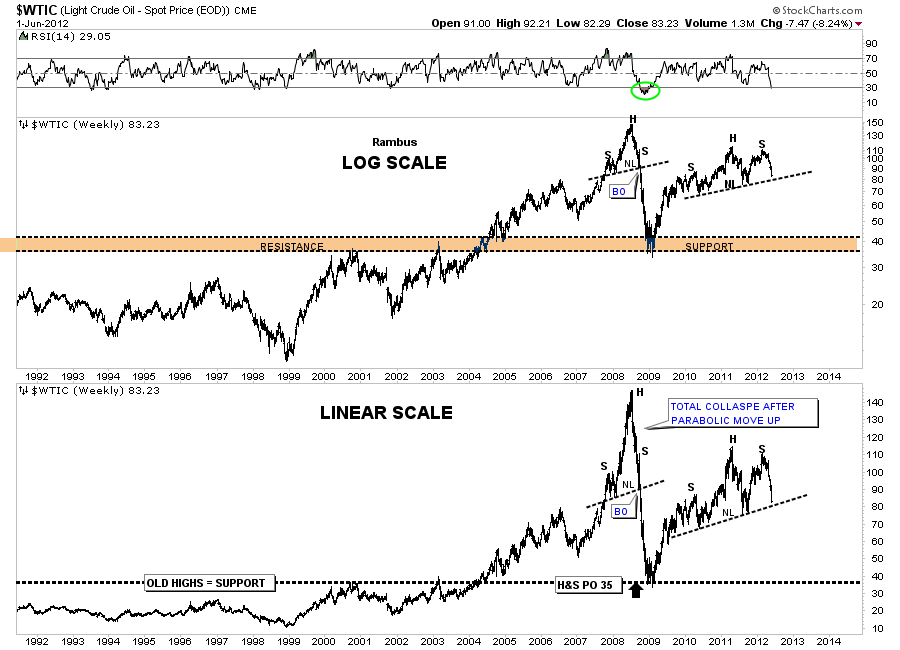
Lets start with oil that is a very good indicator of market strength for the most part. The stock markets and oil generally rise and fall together. Its only when oil goes on a parabolic run does it affect the stock markets, like in 2008. When the economy is strong demand for oil is strong and when the economy is weakening the demand side of the equation is falling. So oil is a good gauge for economic strength or weakness.
Long term oi chart in log and linear scale.
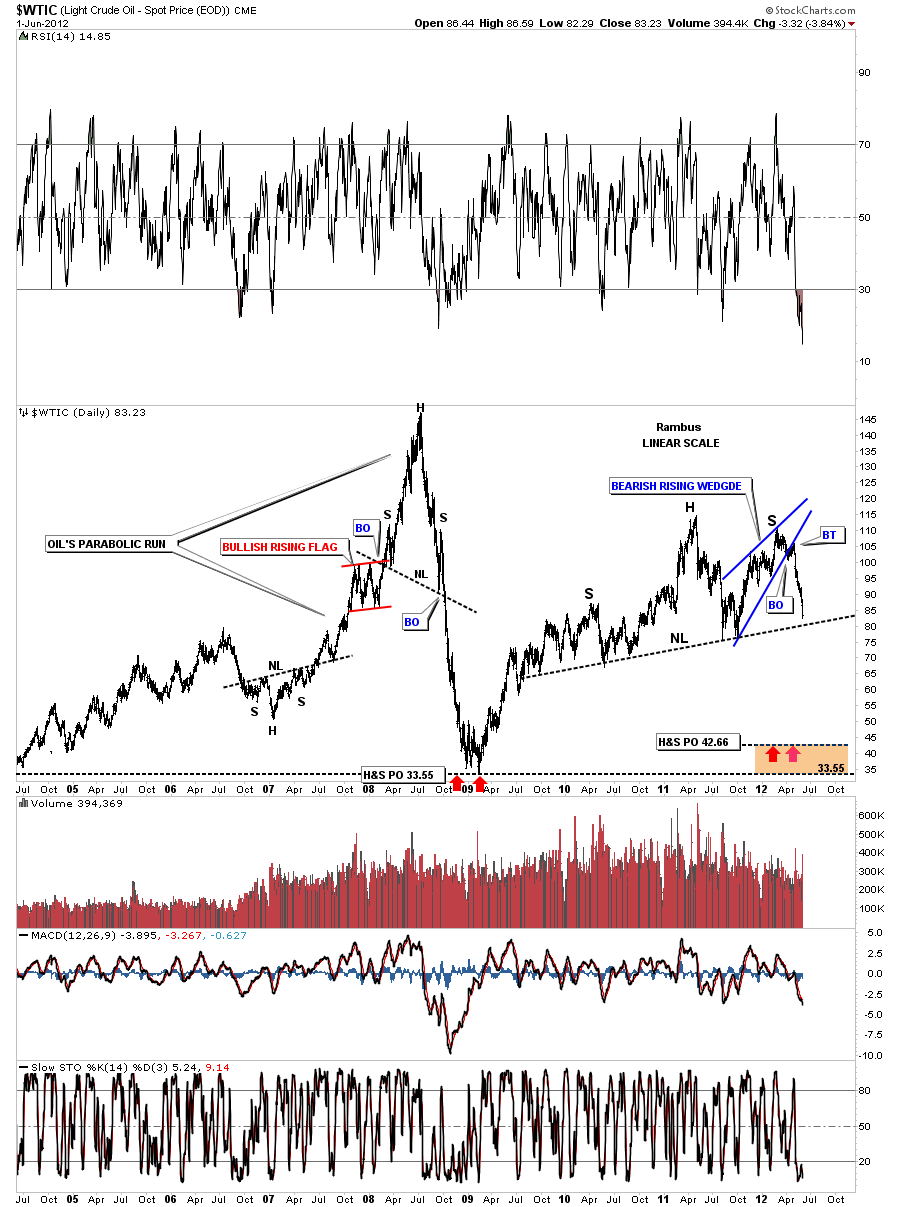
Below is a another look that shows our H&S top pattern zeroing in on the neckline. A break of the neckline will send the price of oil all the way down the low 40’s at a minimum. This would suggest a very slow global economy.
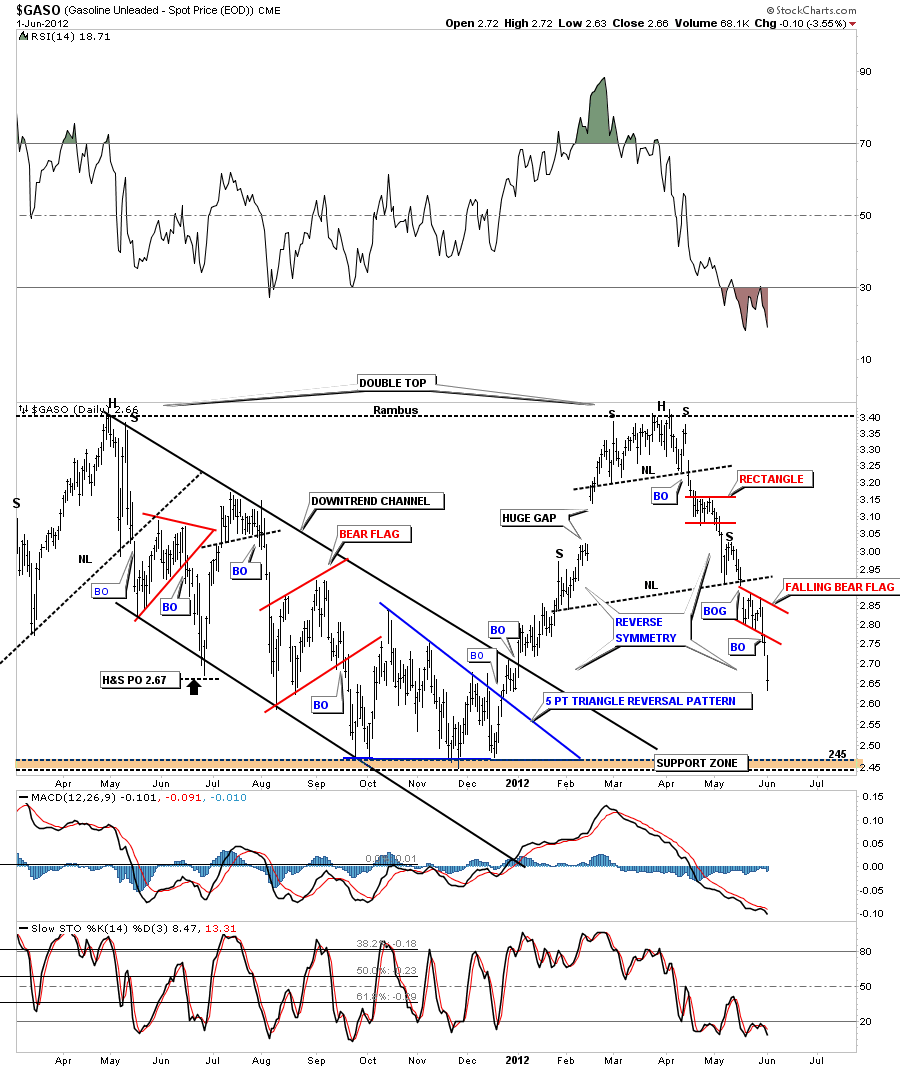
The next chart is a chart for gasoline, the GASO. As you can see below it has been falling like a rock. It has been reverse symmetring down, meaning how it went up is how its coming down. It has formed a second H&S top pattern that has a price objective down to the bottom of the big trading range at 2.49.
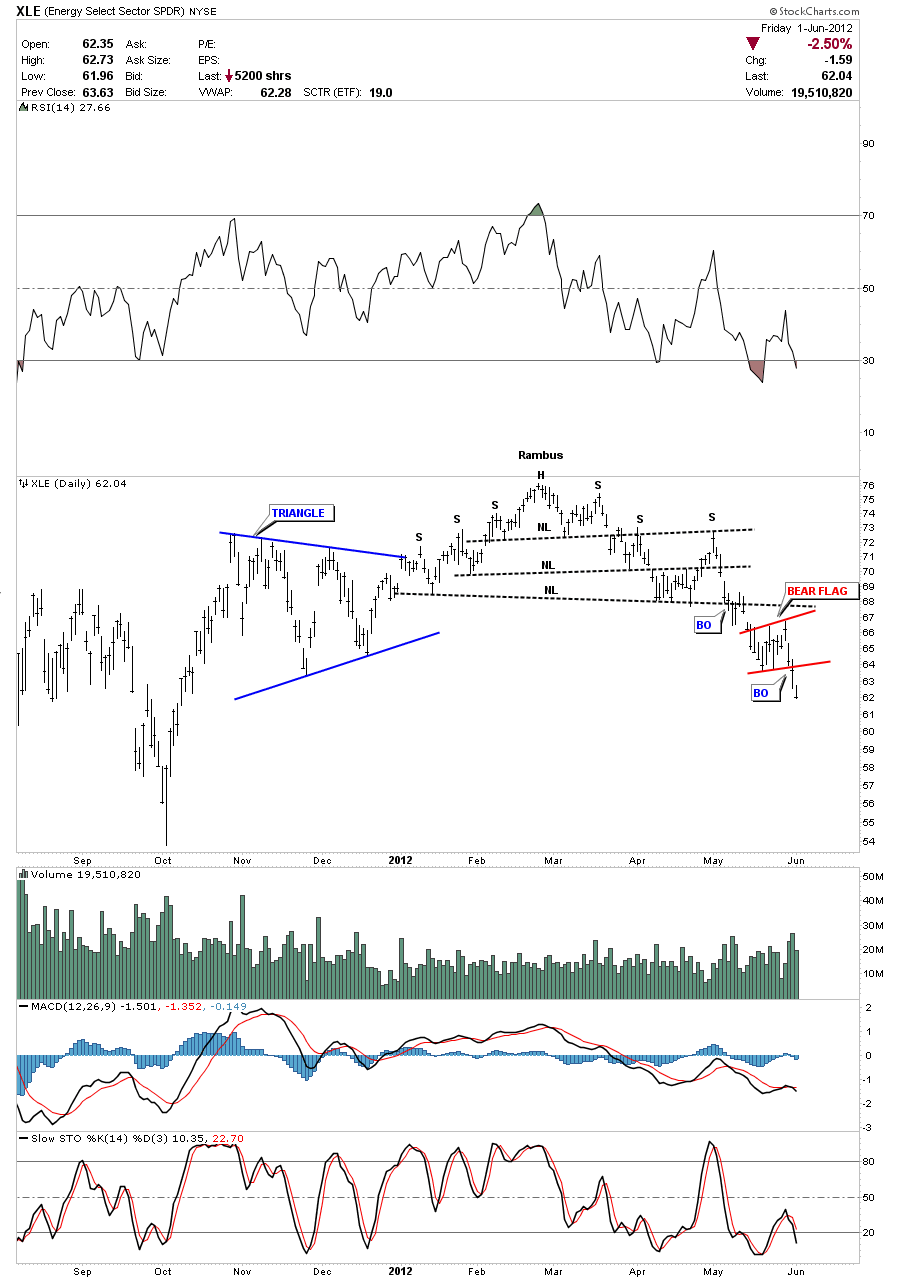
Next lets look at the XLE which is an energy etf. After chopping out a complex H&S top pattern it is now in full retreat after breaking out of a bear flag last Thursday.
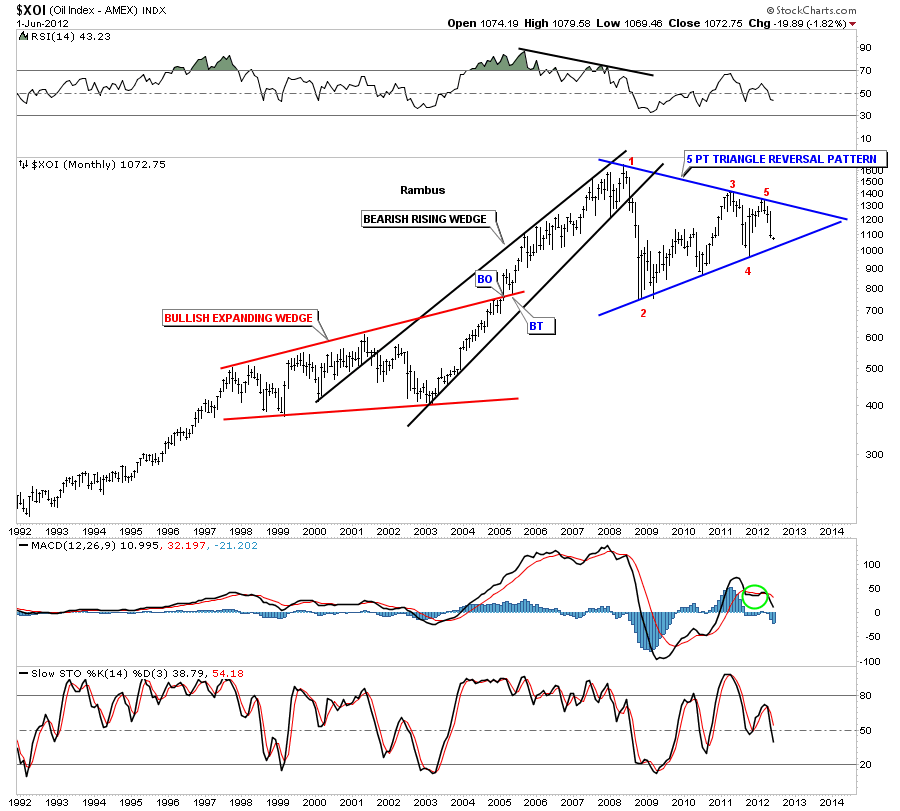
I would like to show you one more chart for the energy sector before we move on. The XOI doesn’t have a H&S top but its close to breaking down from a 5 point triangle reversal pattern. As you can see on the chart below its a huge reversal pattern that suggest, when the bottom blue rail is broken, there is going to be a very big move lower.
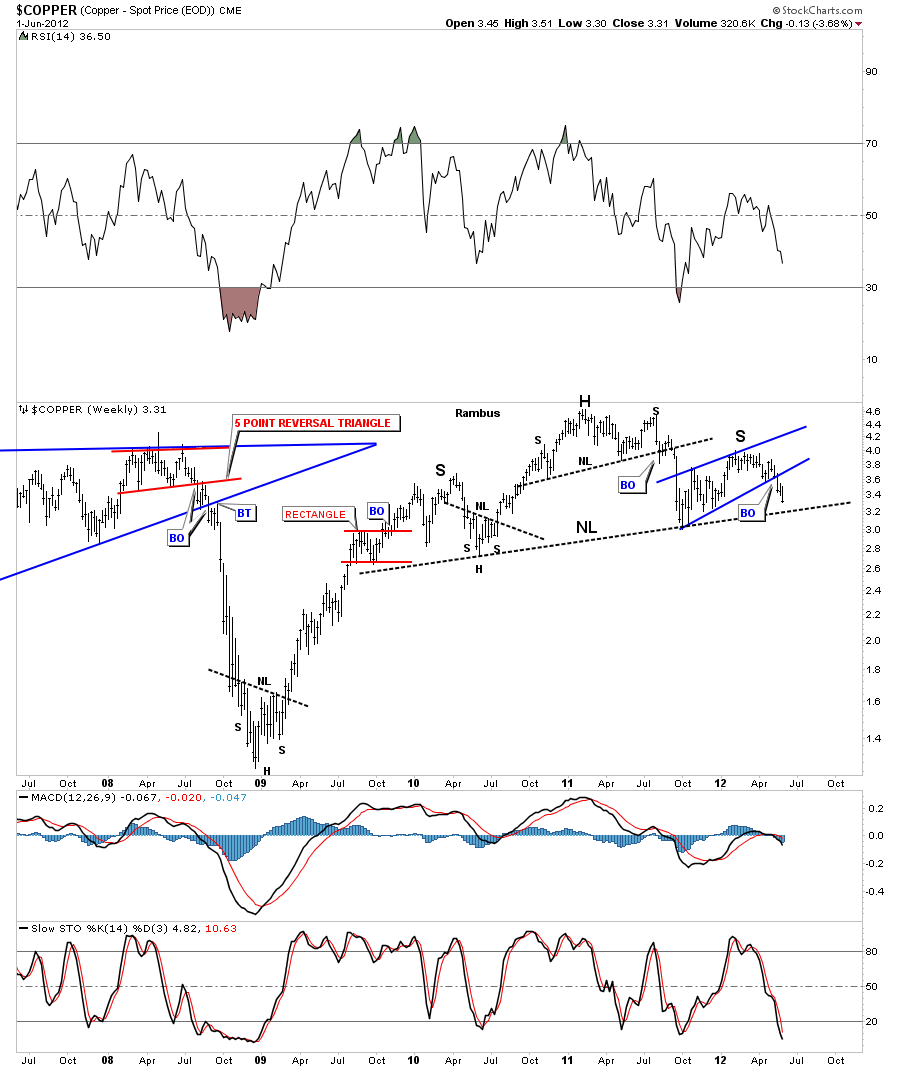
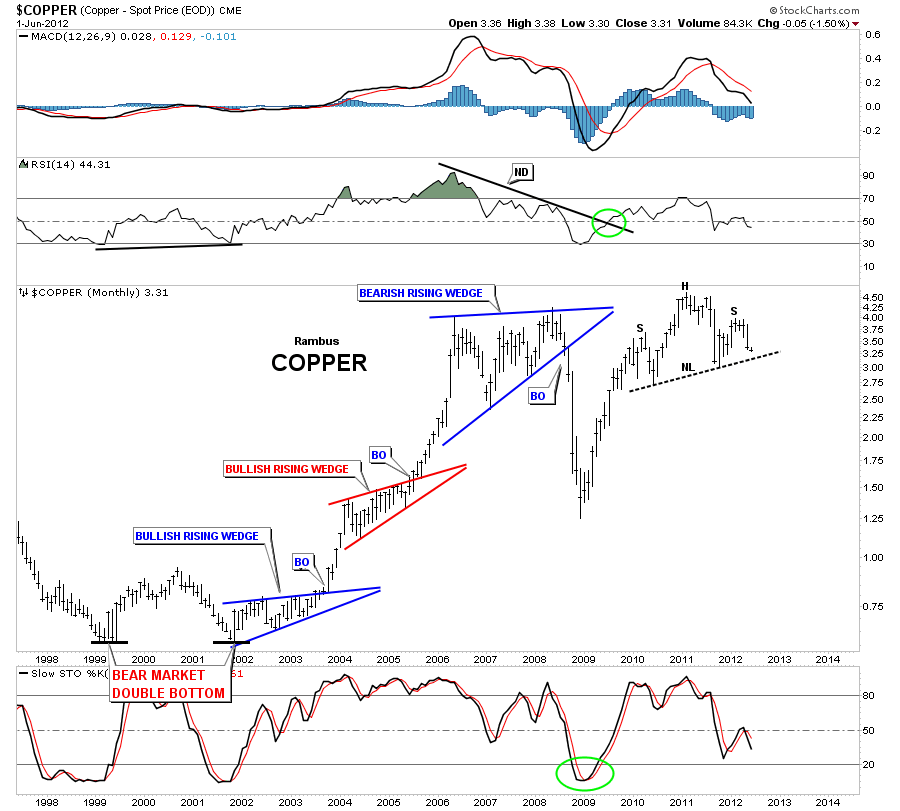
Copper is a very good indicator of a strong or weak economy. As the weekly and monthly charts below show copper is working on a 2 1/2 year H&S top. This is a big topping pattern that is reversing the bull run off the 2009 lows.
The weekly look.
I just want to show you the monthly look to put this H&S top pattern into perspective.
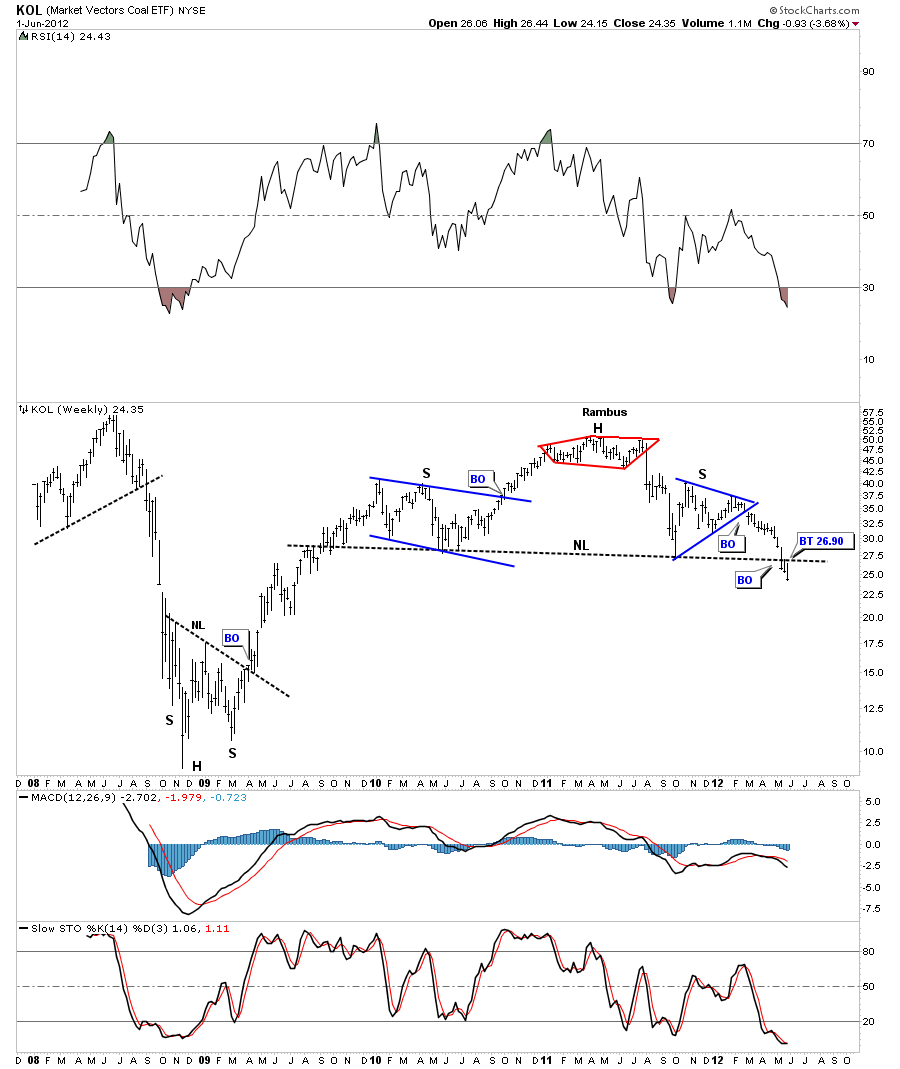
If the world economies are slowing down the demand for coal should reflect that slowdown. Below is an etf for coal, the KOL, which shows a very large H&S top in place with the breakout and backtest now finished.
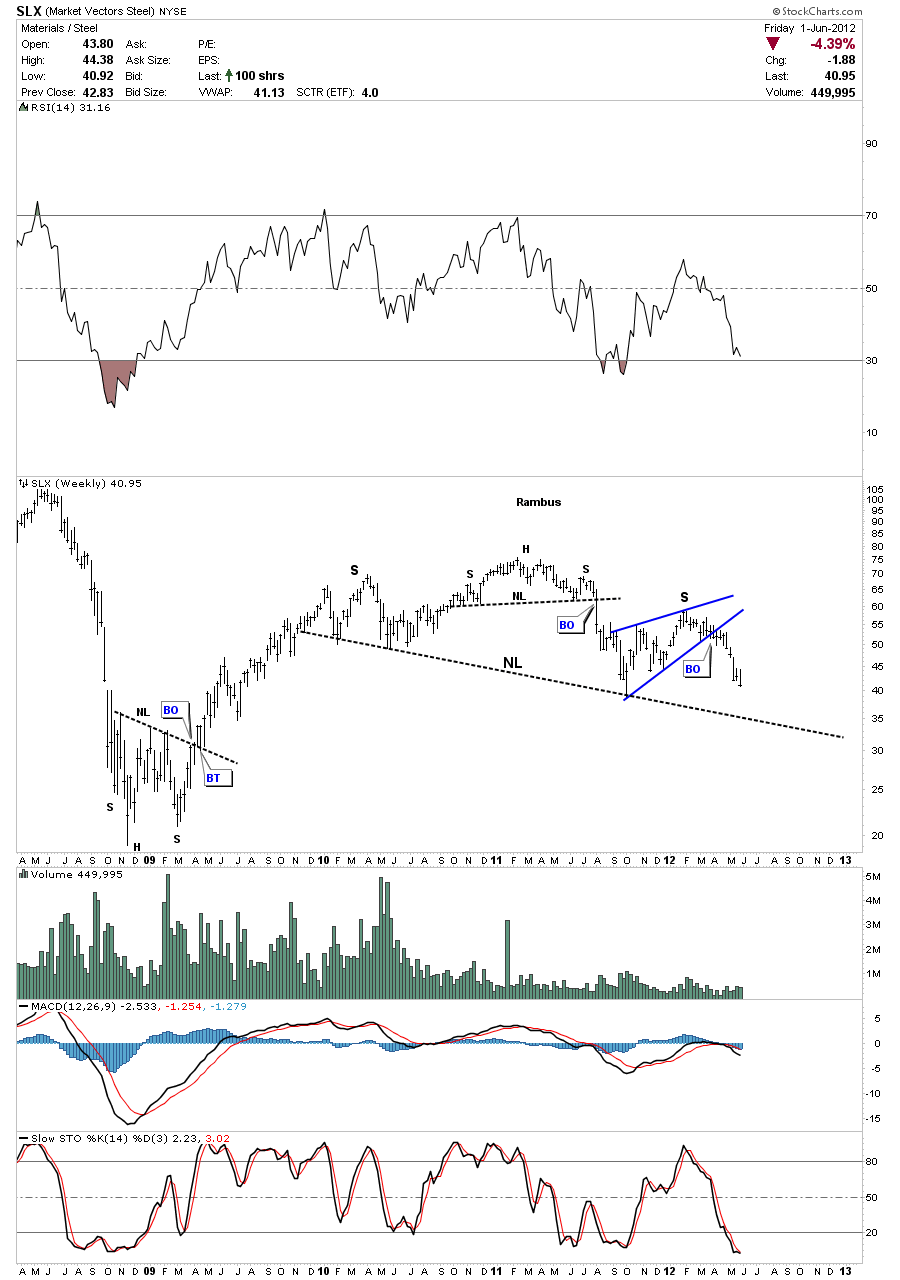
Steel is another commodity that is affected by the global economies. As you can see on the chart below there is a nice H&S top pattern in place that is still maturing. A break of the neckline will usher in a move down to the 2008 crash lows.
Below is a monthly chart of US Steel that is showing a double H&S top pattern. The price action is sitting right on the neckline.

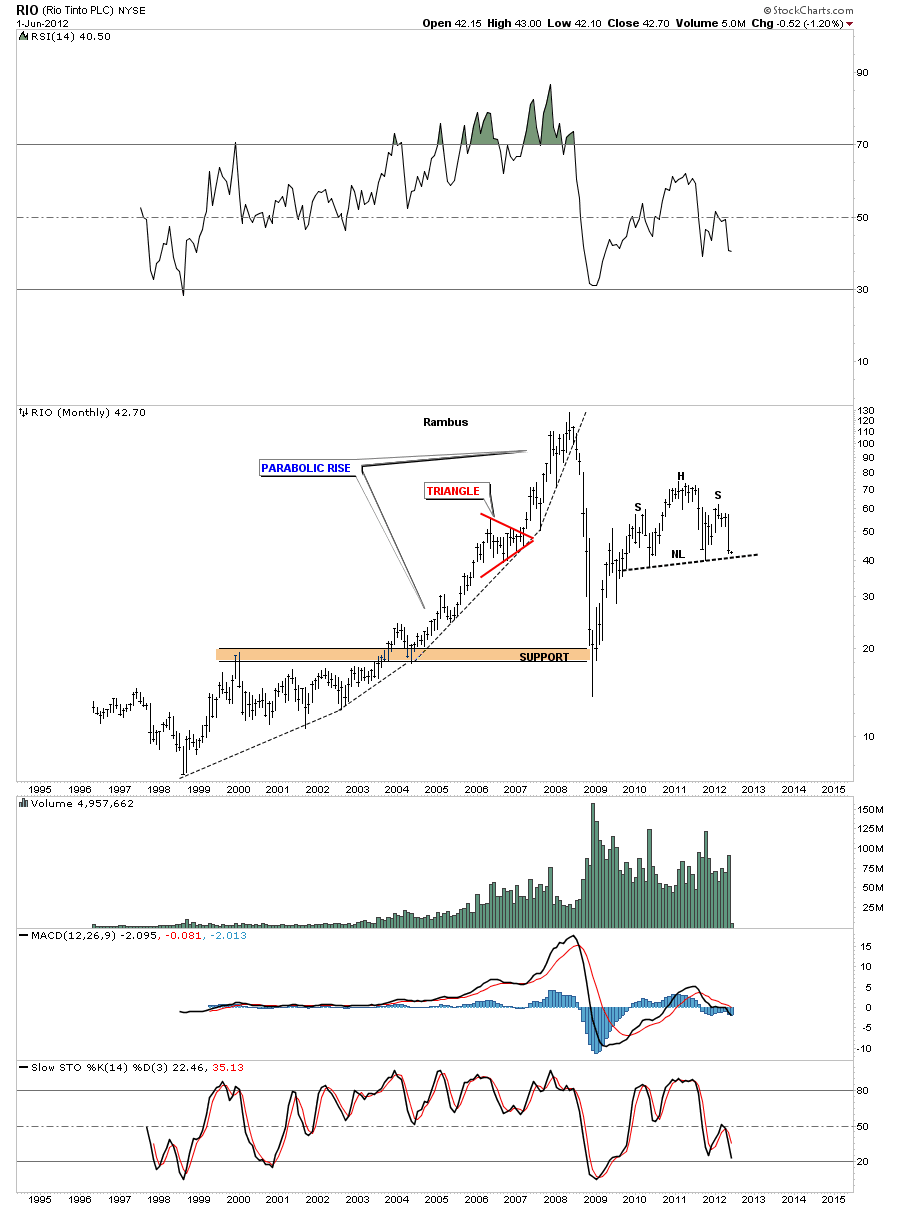
If the base metals are showing weakness then the companies that mine them should also be under pressure as well. Lets look at three of the very largest miners.
RIO has a beautiful H&S top that is on the verge of breaking the neckline on the monthly look.
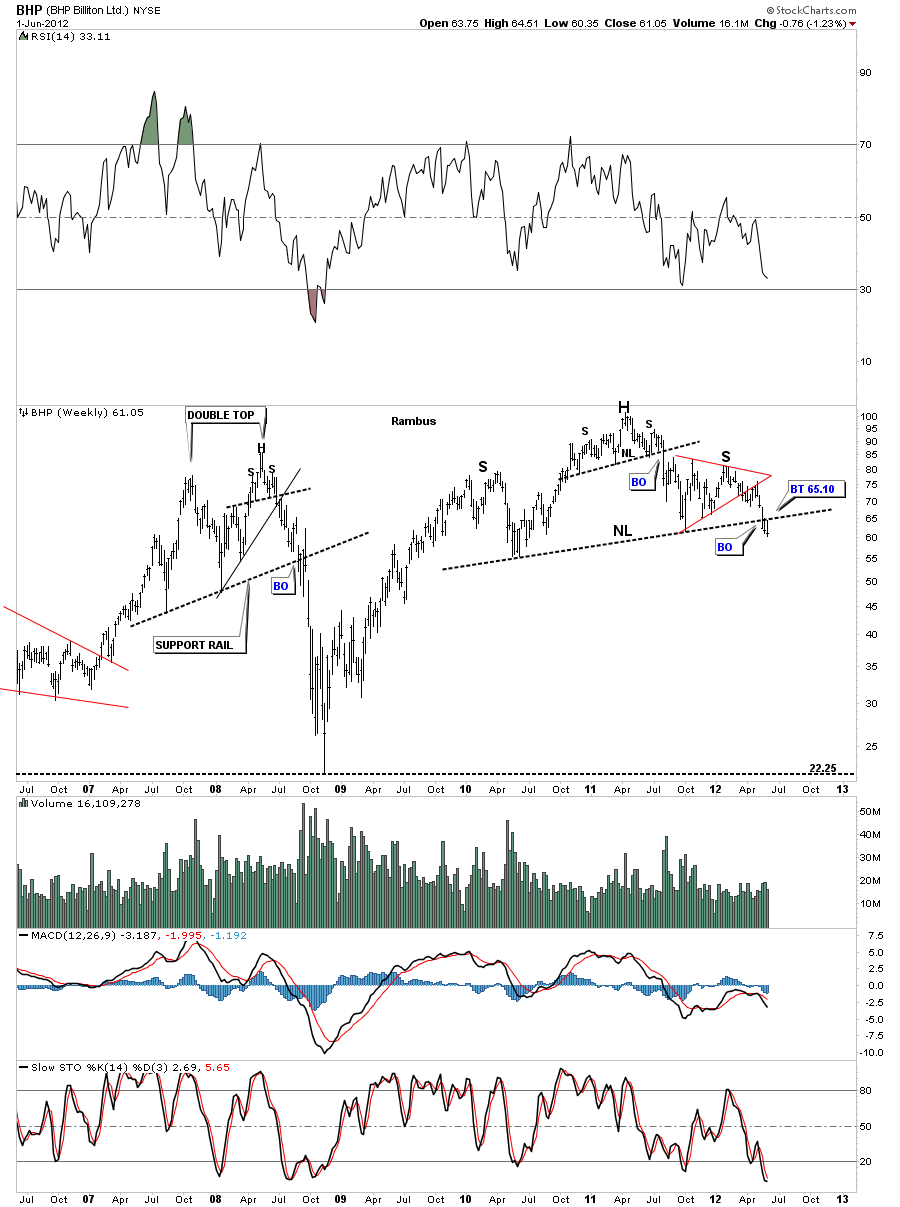
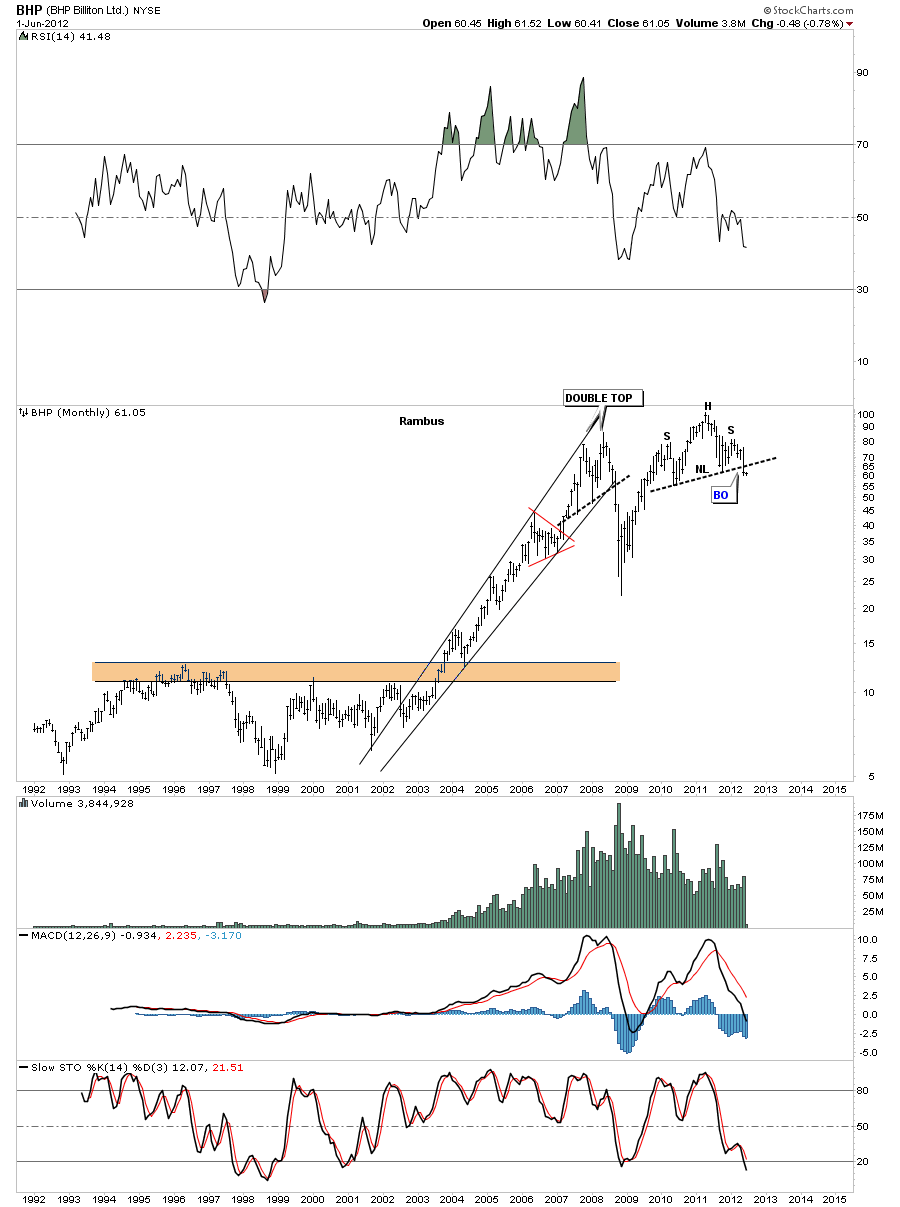
Below is a weekly and monthly look at BHP. The weekly look show it breaking the neckline 3 weeks ago and doing the backtest last week.
The monthly look show a very nice tight H&S top formation on BHP.
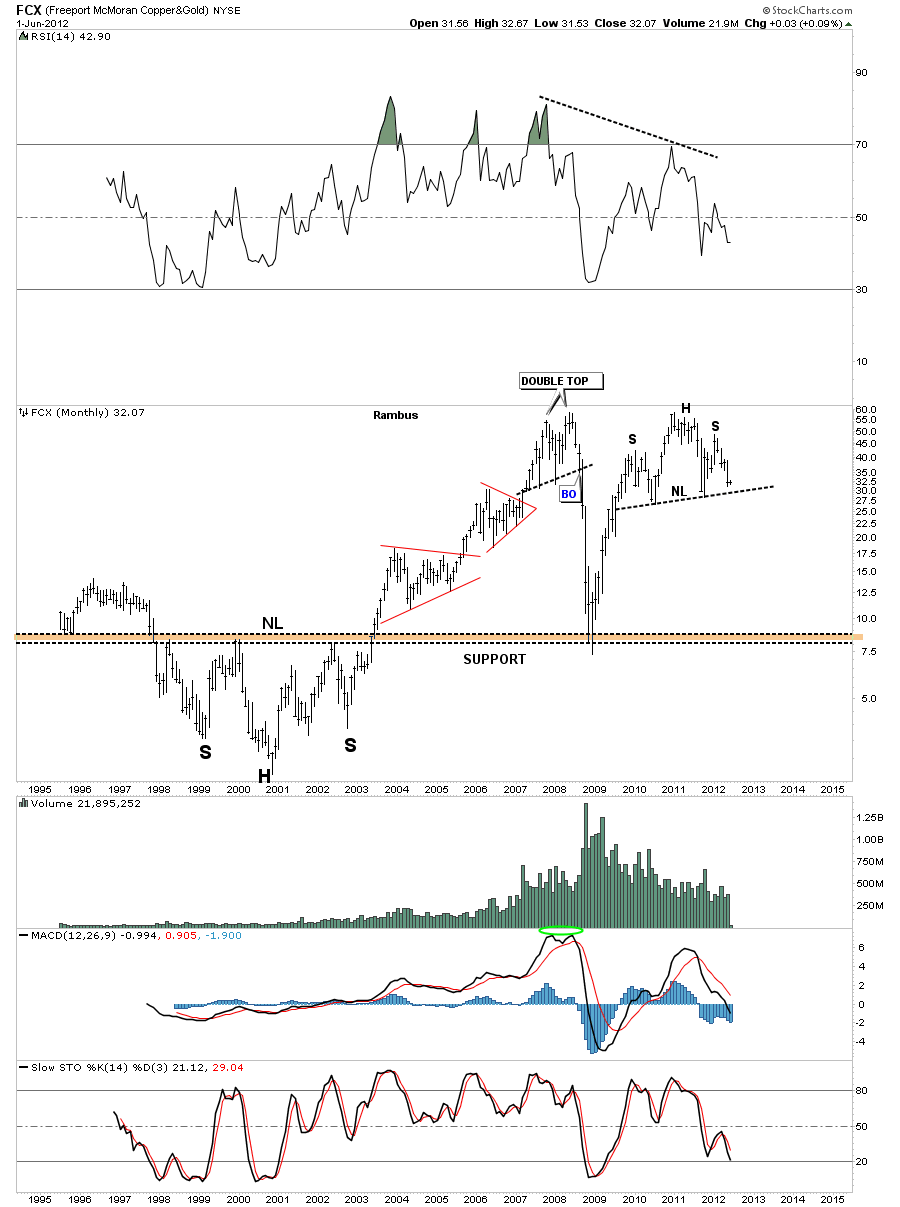
FCX is another big miner that is showing a similar H&S top formation that is approaching the neckline.
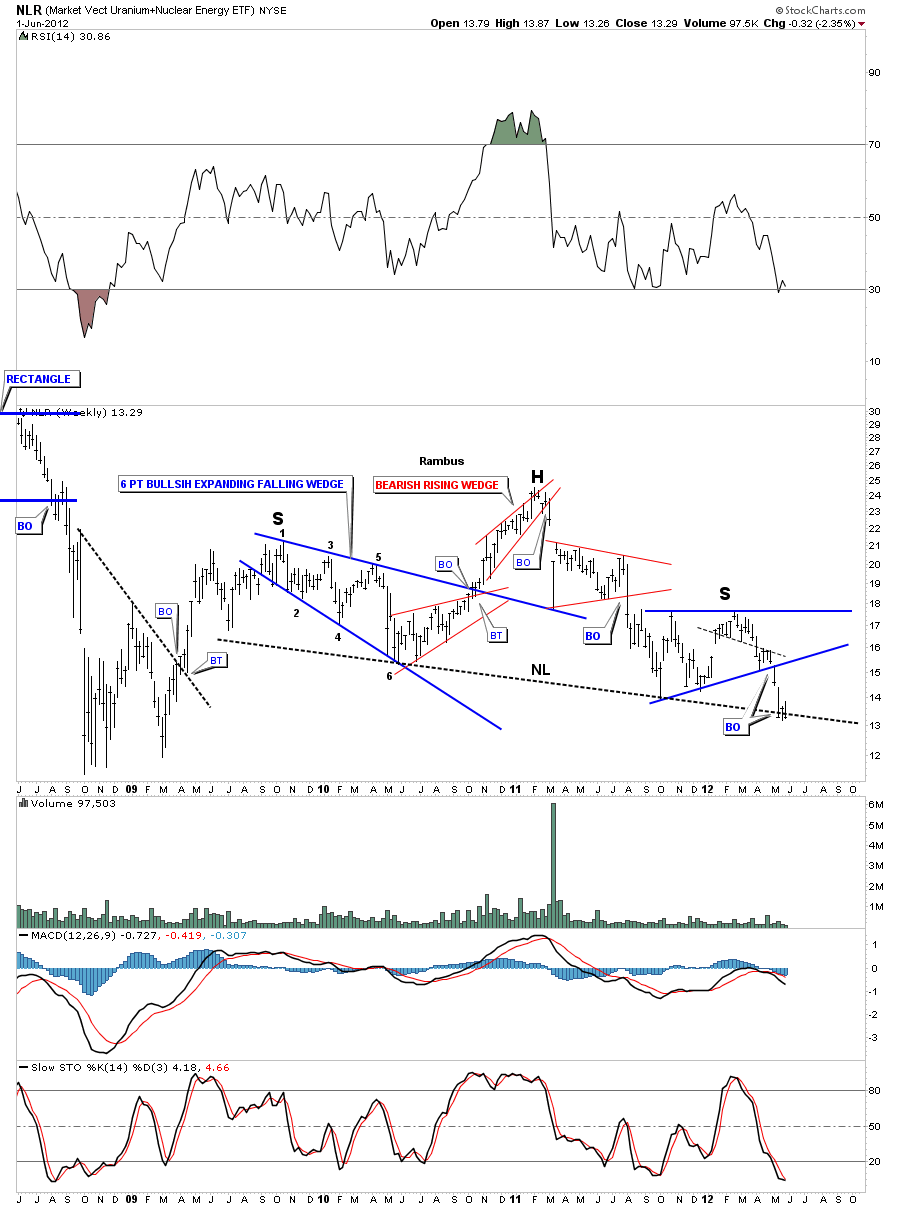
Next lets look at the NLR which is a Uranium etf that is showing a H&S top pattern in place. Its been testing the neckline for 3 weeks now.
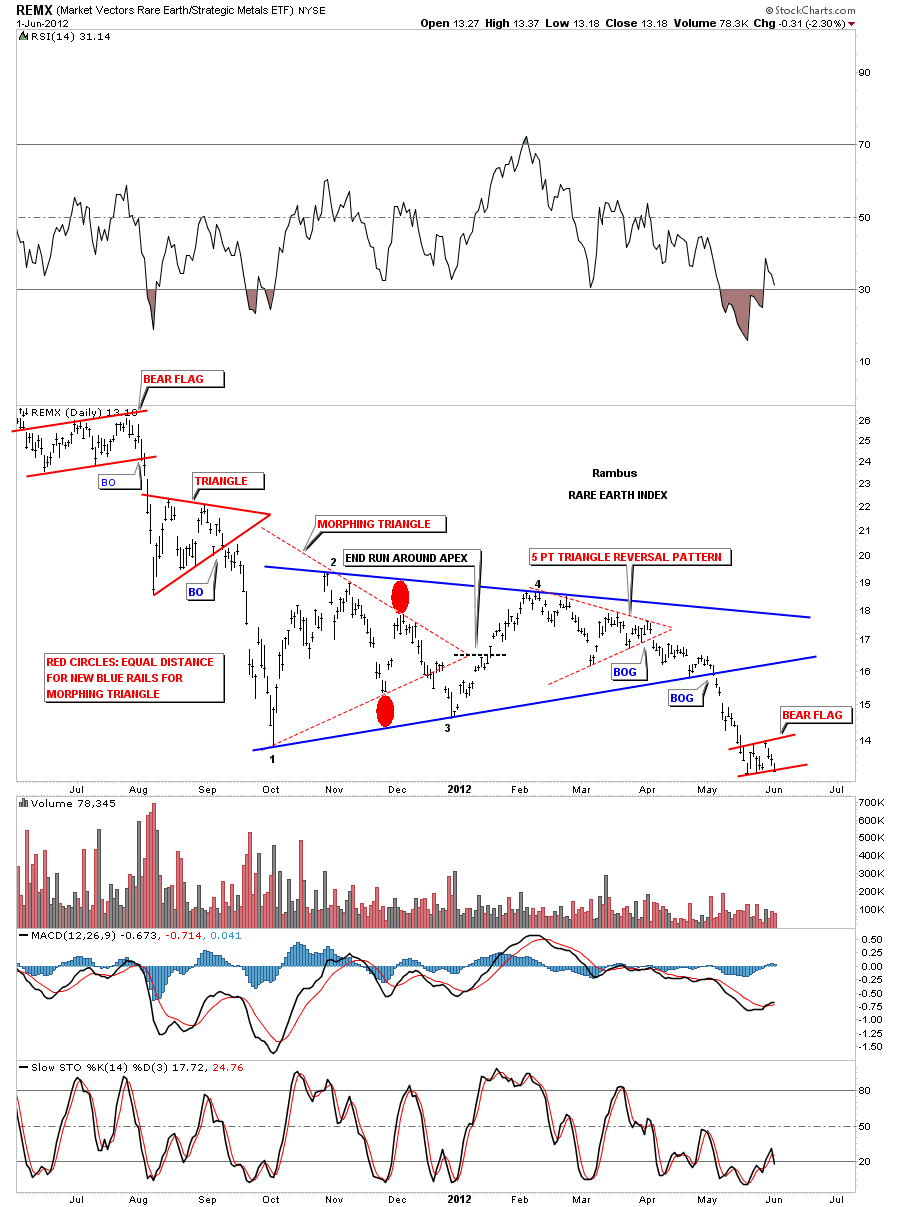
Lets take a look at the rare earth etf, the REMX, which doesn’t have a H&S top in place but it has been falling hard after breaking down from a morphing triangle pattern. Note the little red bear flag that is ready to break to the downside.
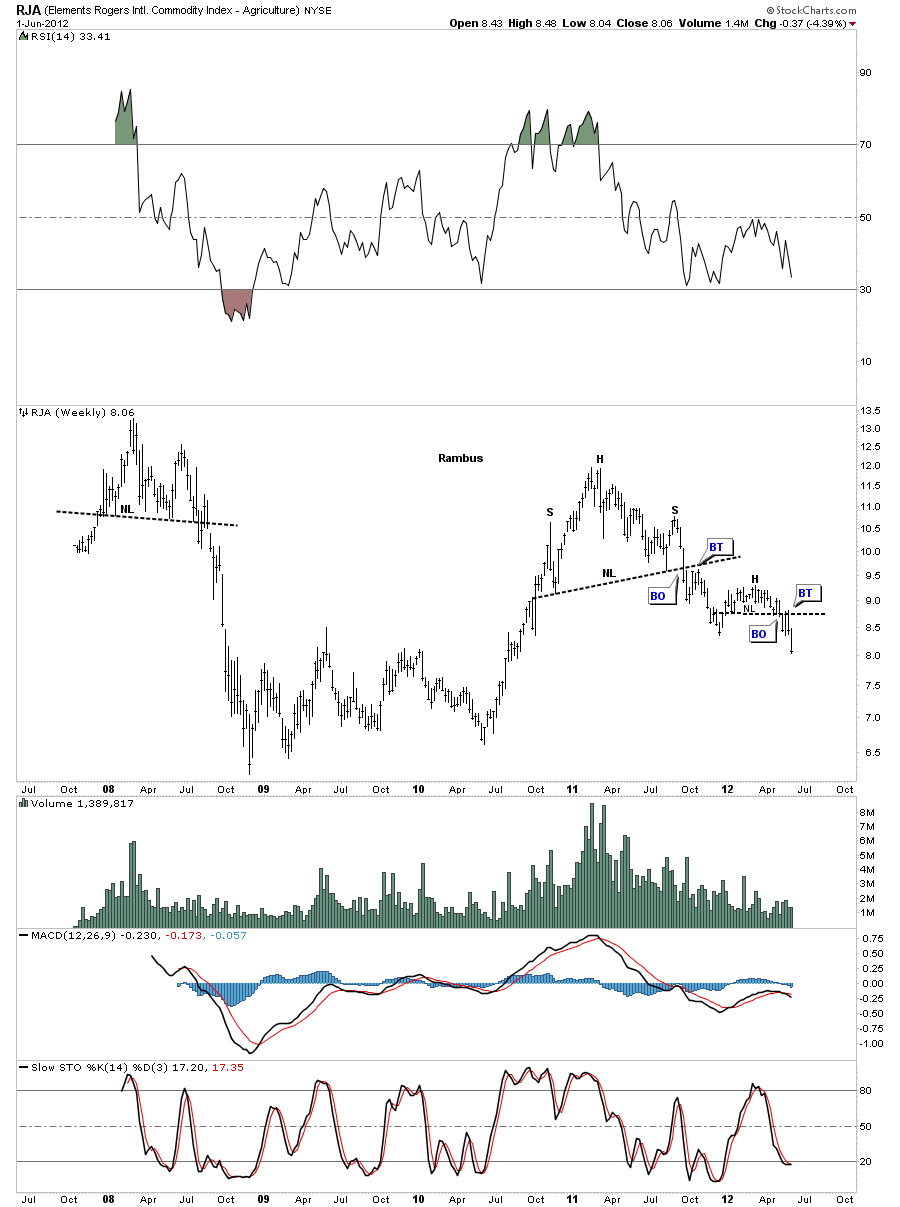
Lets now look at a couple of agriculture etfs. After topping out in 2011 with a H&S top RJA has been in decline mode. It has just broken out of a smaller H&S consolidation pattern about 4 weeks ago.
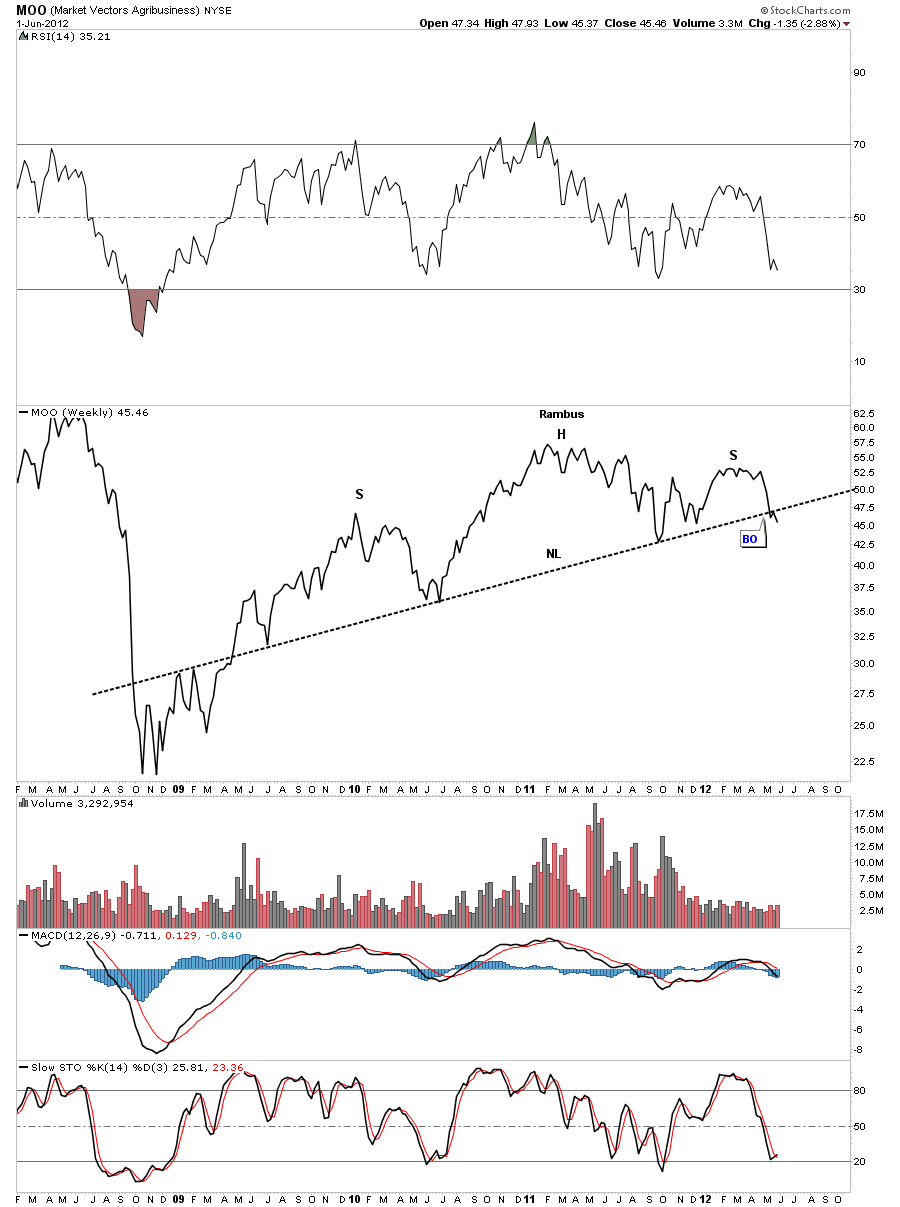
Below is a weekly line chart for MOO which is another agricultural etf that is showing a very large slanted H&S top in place. It just recently broke out and had a small backtest to the neckline.
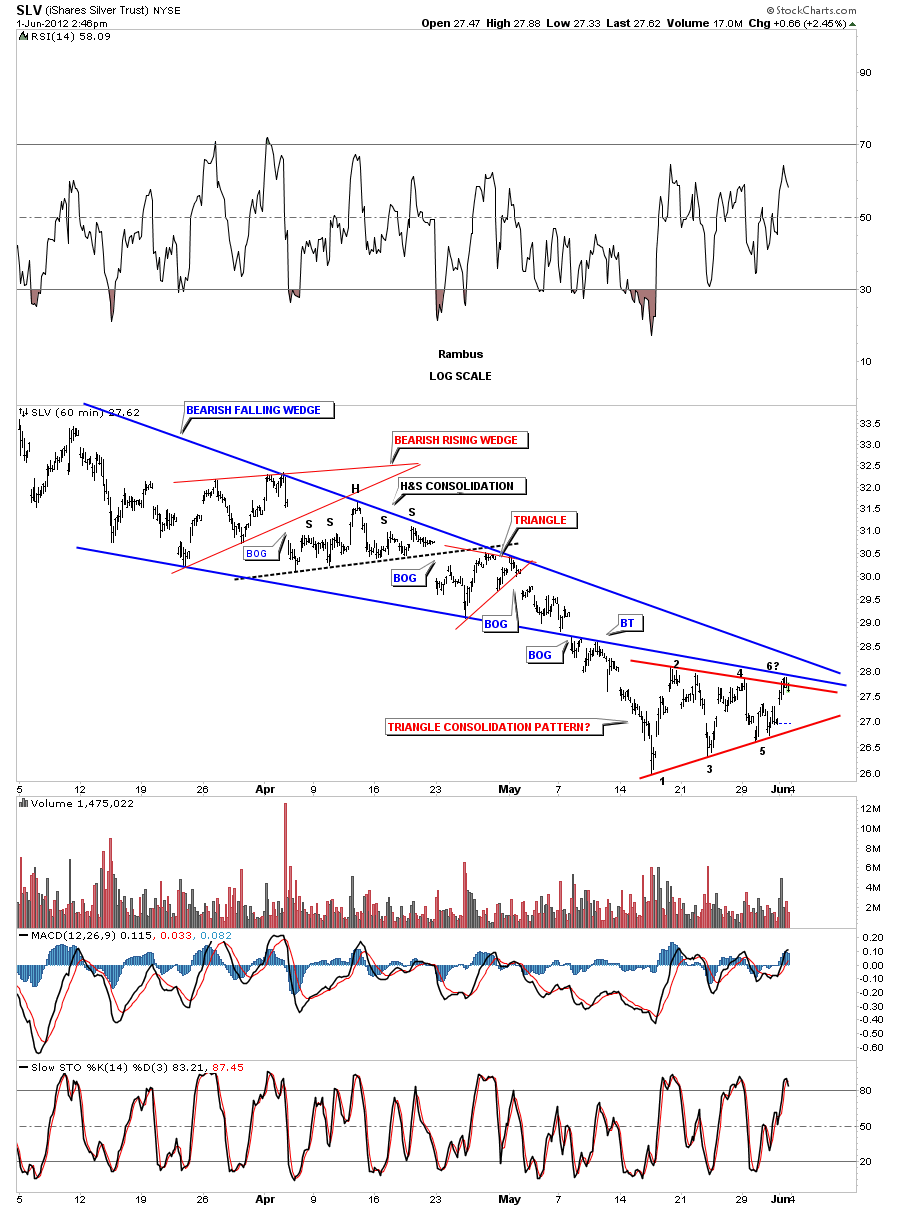
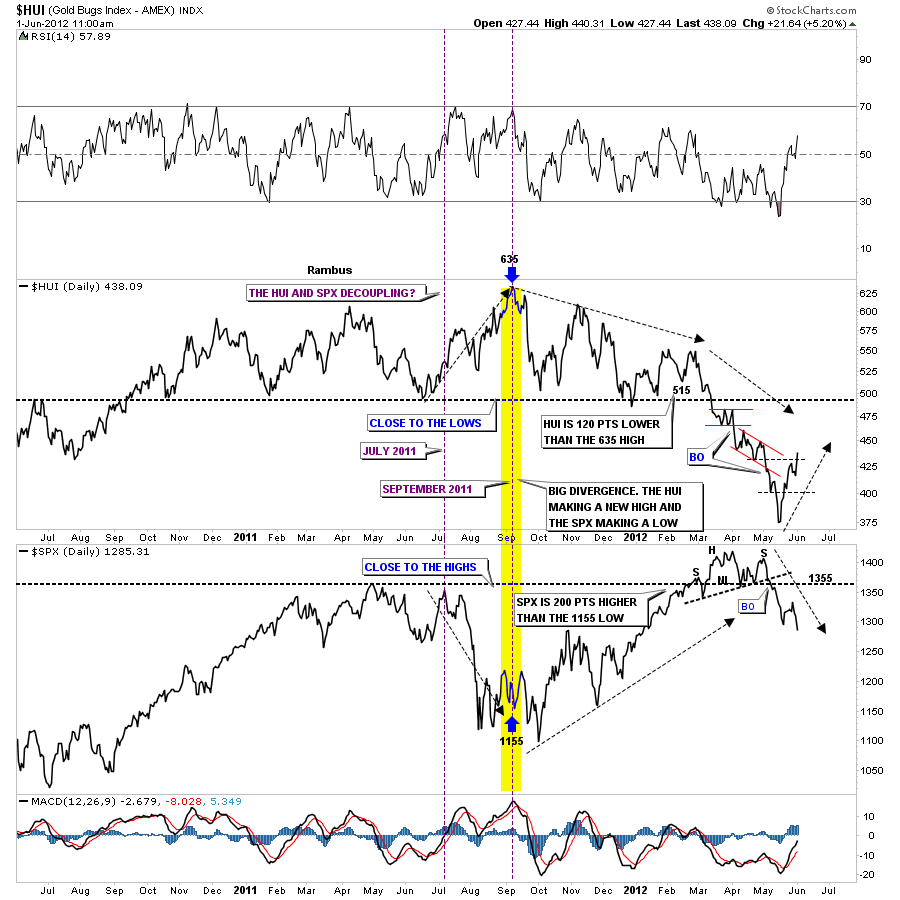
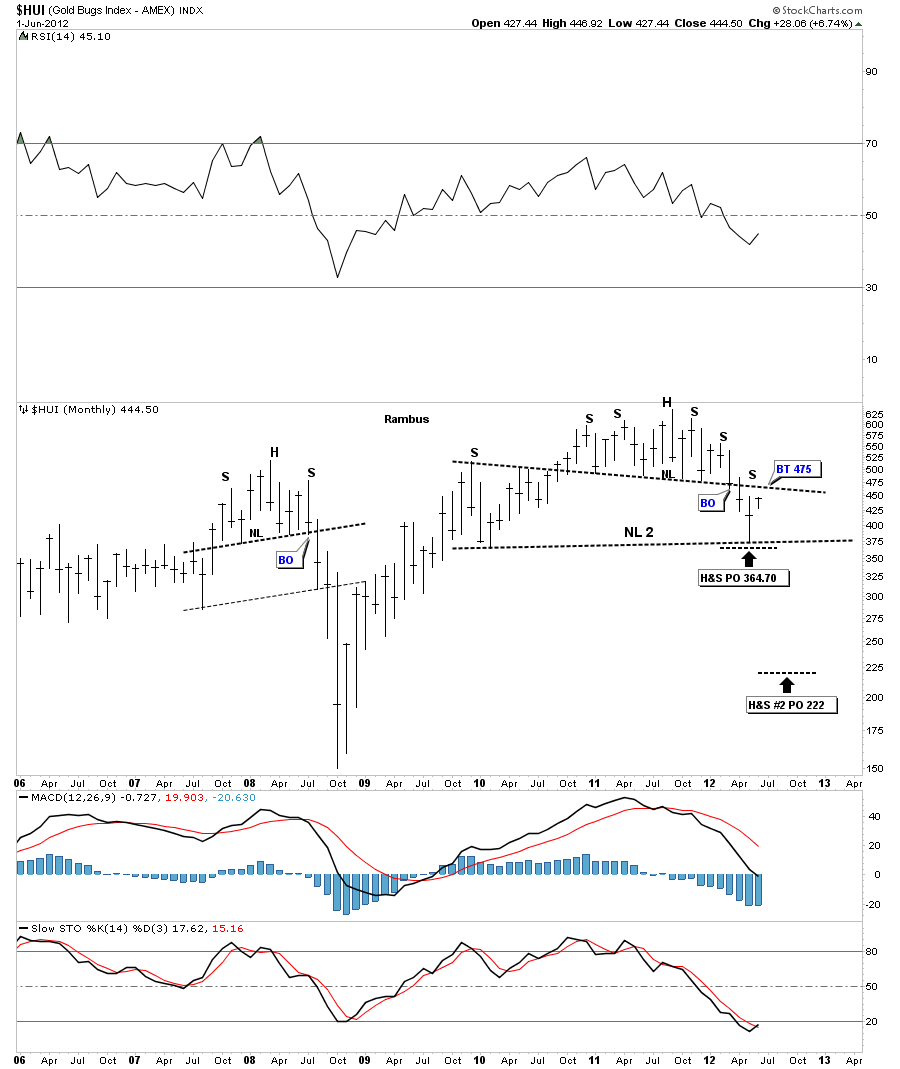
Lets finish off this report by looking at some precious metals stock indexes. The PM stocks have been leading the way down by breaking out of their H&S tops long before most of the charts above show. They also got a good bounce while everything has been decline over the last several weeks. This counter trend rally is working its way back up to the necklines that once held support. This is going to be a critical backtest. It will tell us if the recent move off the bottom is just a short covering rally or something more like a flight to safety. We won’t know the answer to that question until we can take out the necklines to the upside. The Monthly look at the HUI shows where the price action will encounter the neckline at 475 or so. This will be a big deal as to how it interacts with the neckline.
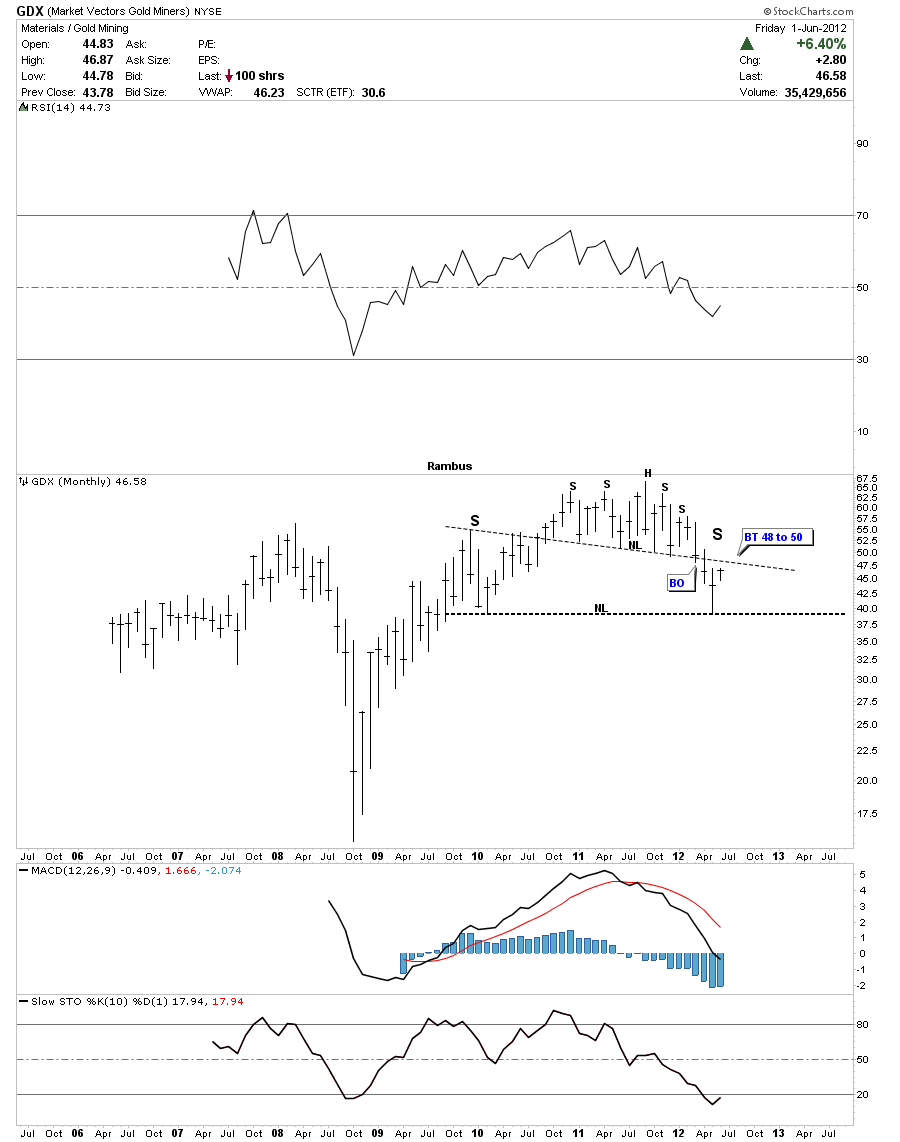
GDX is getting close to backtesting it’s neckline at the 48 to 50 area.
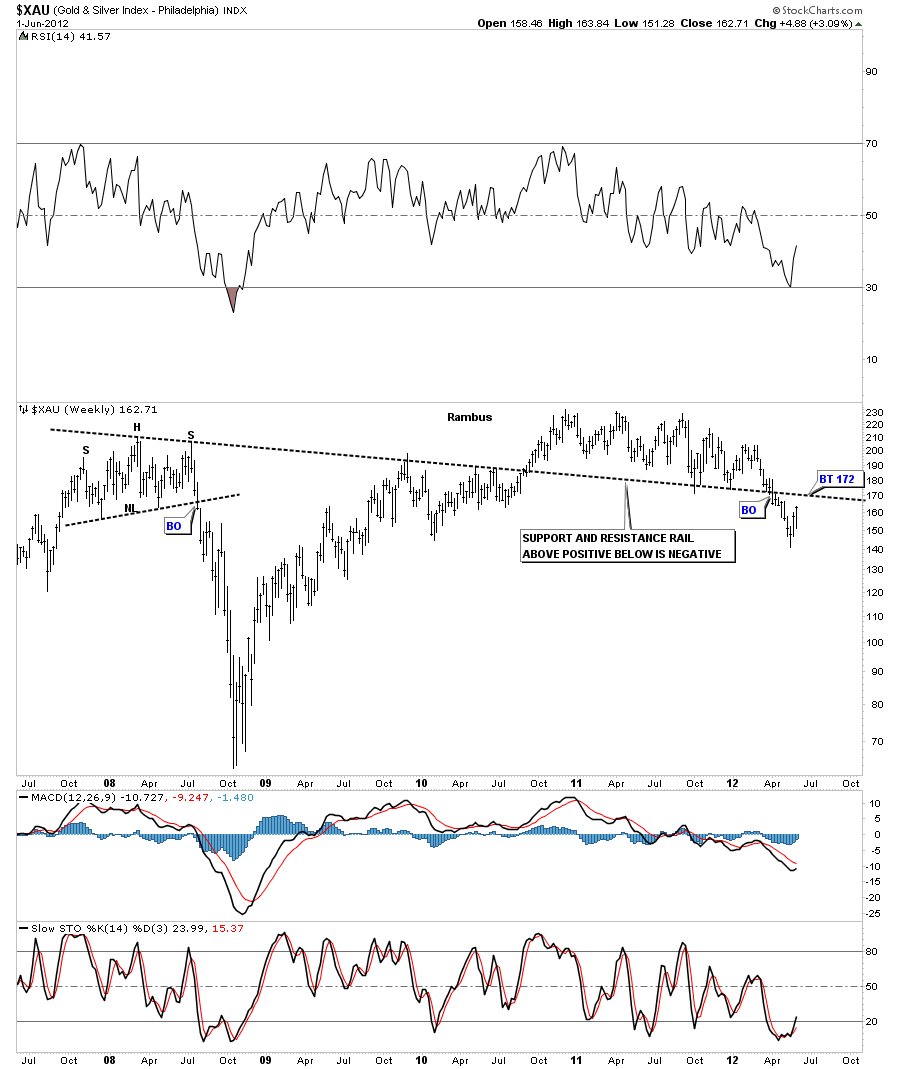
I want to show you a slightly different look to the XAU. I could draw this support and resistance rail on the HUI and GDX as well. This support and resistance rail has been key in determining support and resistance points since the 2008 H&S top. The rule of thumb is, above the S&R rail is positive and below is negative. Until these PM indexes can trade back above these critical lines in the sand we have to be on the cautious side for the time being.
It looks like just about every area of the markets are being affected by some type of deflationary event that seems to be well on its way. All the fundamental news is tied up in these chart patterns. These chart have been telling us now for about 3 months or so that something is in the wind. What exactly that something is will present itself when the time is right. If you add part 1 of the article, Global Stock Markets H&S tops to the charts above, I believe they paint a very clear picture of what is coming our way. For right now we wait, positions taken, for the event to come to light. All the best.. Rambus


