Tonight I would like to get you caught up on a few charts of gold I haven’t shown in awhile. As you well know we are finally getting some serious strength in gold that is moving the price action up and into some critically important resistance points around the 1660 area. Lets start with a daily gold chart so you can get a good overall picture of where we are and where we are likely to be going over the near to medium term.
The gold chart below shows the most important pattern that gold has been trapped in since last September when it made it’s initial break off the all time high at 1920. That first bottom, setup the first reversal point in the 265 point rectangle pattern, point #1. I’ve labeled the reversal points within the big rectangle with red numbers. The fifth reversal point was most important because it represented either a rectangle consolidation pattern to the downside or the 5th reversal point was making the rectangle a reversal pattern to the upside. Two very different outcomes. As of right now we can rule out the rectangle as a consolidation pattern to the downside and say its a 5 point rectangle reversal pattern to the upside. Until something changes that scenario this is the way we have to trade now.
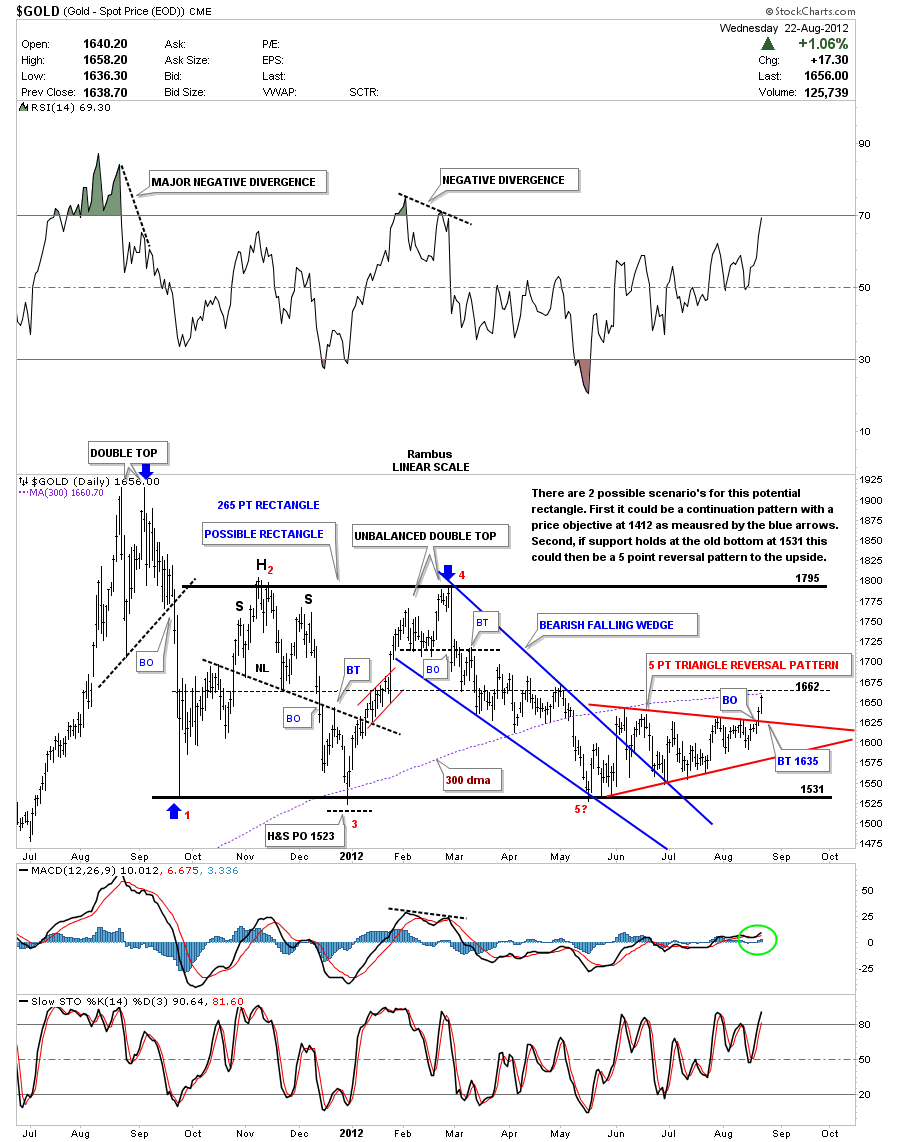
There are still several more important things to look at, on the daily chart above, that helps let us know where we are relative to the last year of trading. On the shorter term look the 5 point red triangle reversal pattern is the most important chart pattern in play right now. As you can see on the chart above gold finally broke out of the 5 point morphing triangle yesterday with some nice follow through today. We are now approaching two critical resistance points and they both intersect at roughly the1660 area. The first one is the horizontal thin dashed black center rail of the big rectangle and the other one is the 300 dma which came in today at 160. After alittle backing and filling around the1660 area the red 5 point triangle strongly suggests gold in going up to test the top of the rectangle at 1795. For right now 1660 is the area to watch.
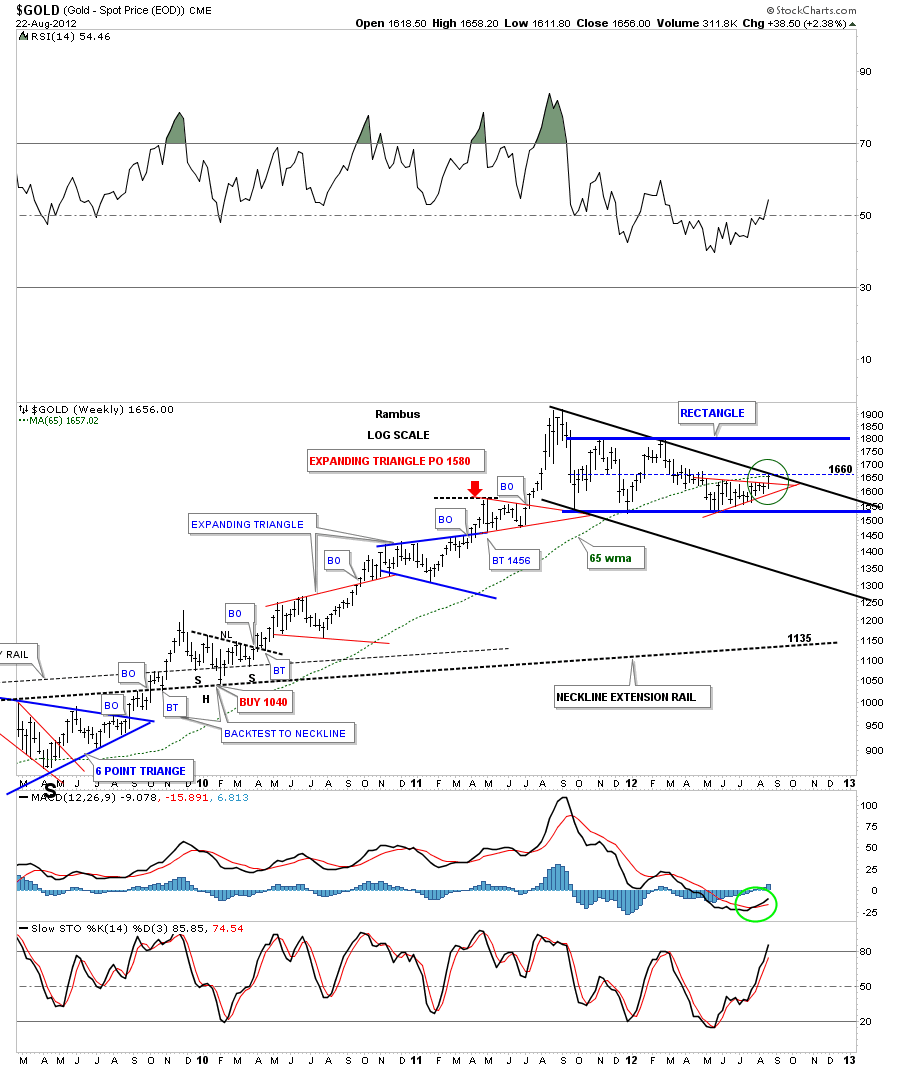
The weekly chart below shows again why the 1660 area might offer up some resistance before the gold price can work its way higher, green circle. We have the 65 week moving average that is now at 1657. Gold is also approaching the top rail of the downtrend channel that seemed so far away just a week or two ago. If gold can takeout the top black downtrend rail, that will nullify another leg down within the downtrend channel and helps build a stronger case for the triangle consolidation pattern.
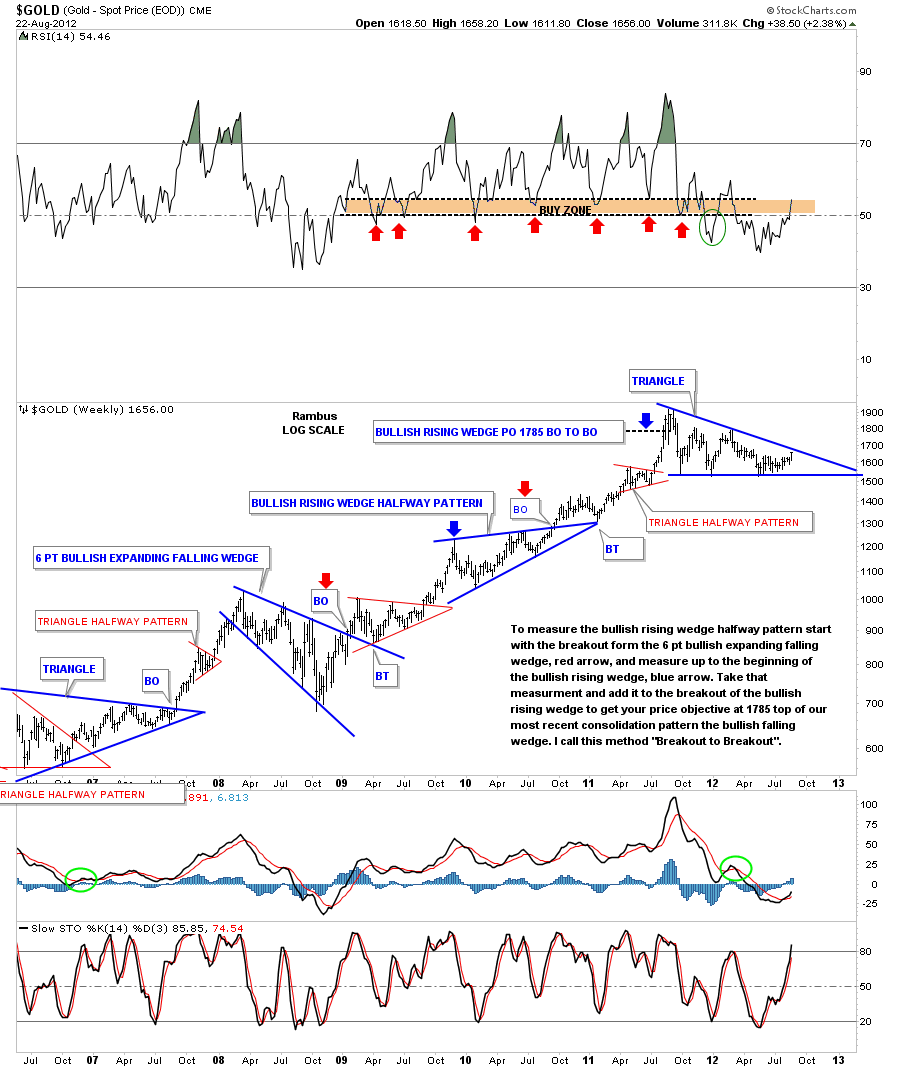
Another weekly chart shows the potential triangle forming that maybe coming to an end if gold can takeout the top blue rail. If you look at the other blue consolidation patterns you can see our current triangle looks very similar in time and price. So from that perspective our current blue triangle could be a mature pattern. Time will let us know if that is the case.
The last chart I would like to show you is a 30 year look at gold. When looking at the bull market that stared in 2000 our latest consolidation pattern looks like it fits right in as just another consolidation pattern in the ever growing bull market.
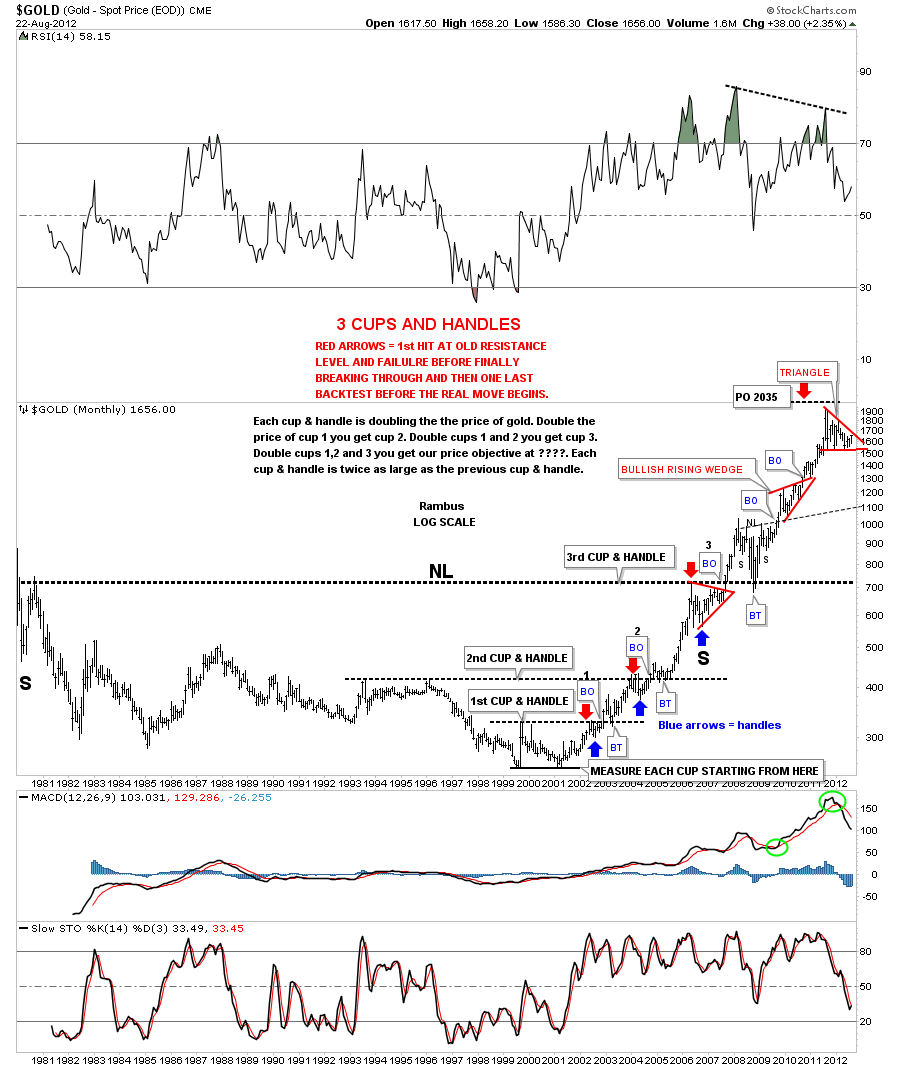
We know from looking at the charts above that the 1660 area represents some key resistance points gold will have to overcome to enter it’s next impulse leg higher. With the breakout of the 5 point triangle reversal pattern gold answered a few very important questions for us. Most importantly is that the bottom at 1530 is a very key support and will likely hold into the future. Also the breakout from the 5 point triangle strongly suggests that gold at a minimum is headed back up to the top of the rectangle at 1795. So now we wait and see how gold trades around the all important resistance area at 1660. All the best…Rambus
EDITOR’S NOTE :
Rambus Chartology is Primarily a Goldbug TA Site where you can watch Rambus follow the markets on a daily basis and learn a great deal of Hands on Chartology from Rambus Tutorials and Question and Answeres .
Most Members are Staunch Goldbugs who have seen Rambus in action from the 2007 to 2008 period at www.goldtent.org and now Here at Rambus Chartology since early 2012 .
To review his Work and incredible calls from the 2007-2008 period click on the top right sidebar in the “Wizard of Rambus” ….”What If !!” Post
To Follow Rambus Unique Unbiased Chart Work and participate in a Chartology Form with questions and answeres and learn the Art and Science and Mindset of a Pro Trader please Join us by subscribing monthly for $29.99 at
www.rambus1.com
We have many subscribers from all over the world who are glad they did as they enjoy the many daily updates and commentaries provided at this exciting new site
As you will see Rambus (Dave) has prepared us for this difficult period by being one of the only ones to see and warn about this incredibly debilitating PM smackdown as early as Jan 2 2012 …click on the” HUI Diamond in the Rough” Post in the “Wizard of Rambus” top right
You will find Rambus to be a calm humble down home country tutor with an incredible repitoir of all the TA based protocols tempered with his own one of a kind style…simply put…He wants to keep his subscribers on the right side of these crazy volitile and downright dangerous markets
See you at the Rambus Chartology
…………………….