GLD

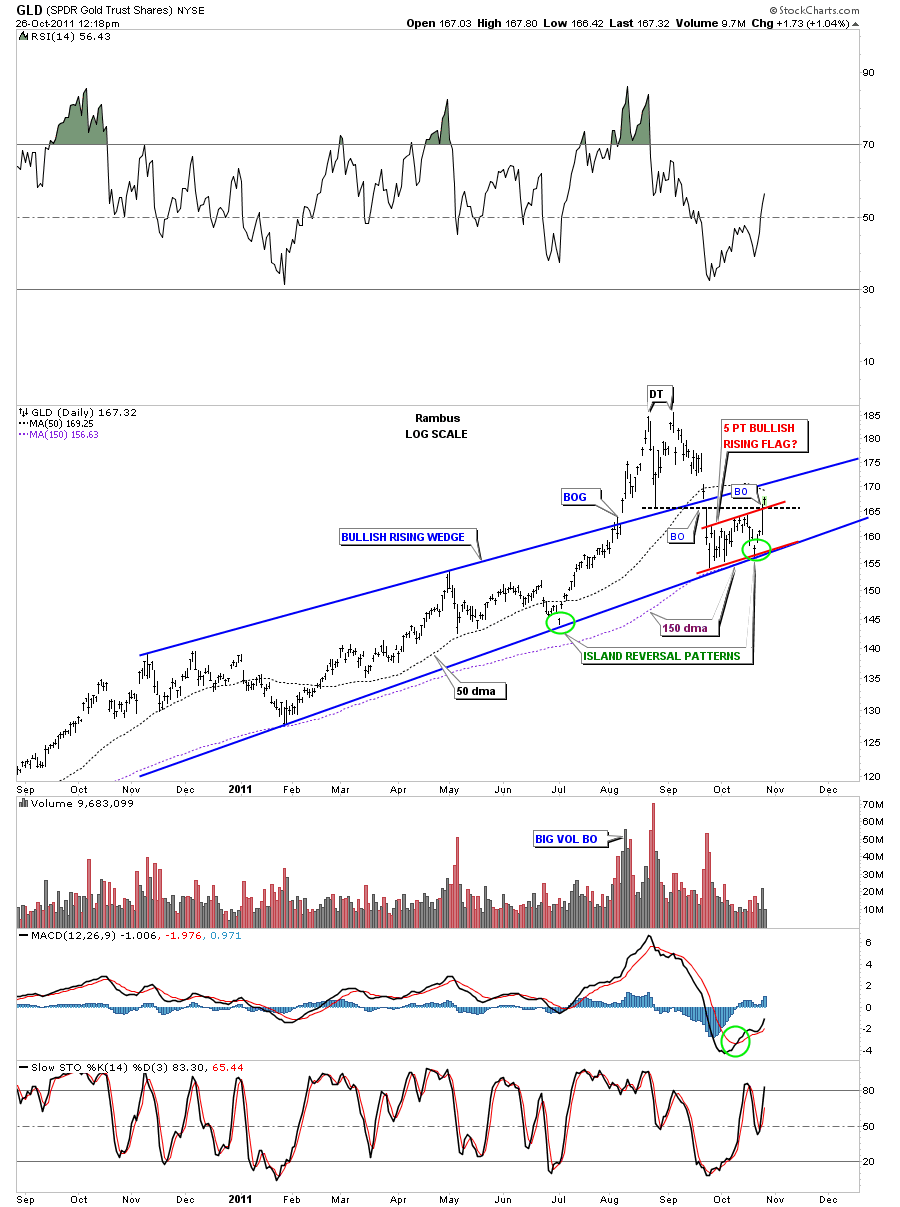
Yesterday we looked at alot of short term, 60 minute charts, to see how our month long consolidation patterns have been progressing. Today I want to put our little 5 point bullish rising flag into perspective on the daily look for GLD. So far GLD is doing everything right for a positive resolution to the upside. This morning we took out two critical resistance rails, one being the black dashed horizontal rail that marked the breakout from the double top. We also took out the top rail of the 5 point bullish rising flag. As you can see the two rails intersected right at today’s price action. If GLD was weak it probably would have failed at that critical resistance point. The fact that we are trading above that resistance is a good sign. I have circled in green two little Island reversal patterns that formed right on the bottom rail of the bullish rising wedge. This is also a positive. The next positive thing about the daily GLD chart is we once again have bounce off the 150 dma which has held any correction for the last two years or so. One more positive sign is how the bottom rail of the bullish rising wedge has held support during this correction. That takes care of the positive stuff. As you can see on the chart below we have 2 more resistance rails just above today’s action. One is the 50 dma and the other is the top rail of the bullish rising wedge. If we can get thru those last 2 resistance points then GLD should be go to go for awhile. Stay tuned as these are interesting times in the precious metals complex.

GLD daily look.
GLD update

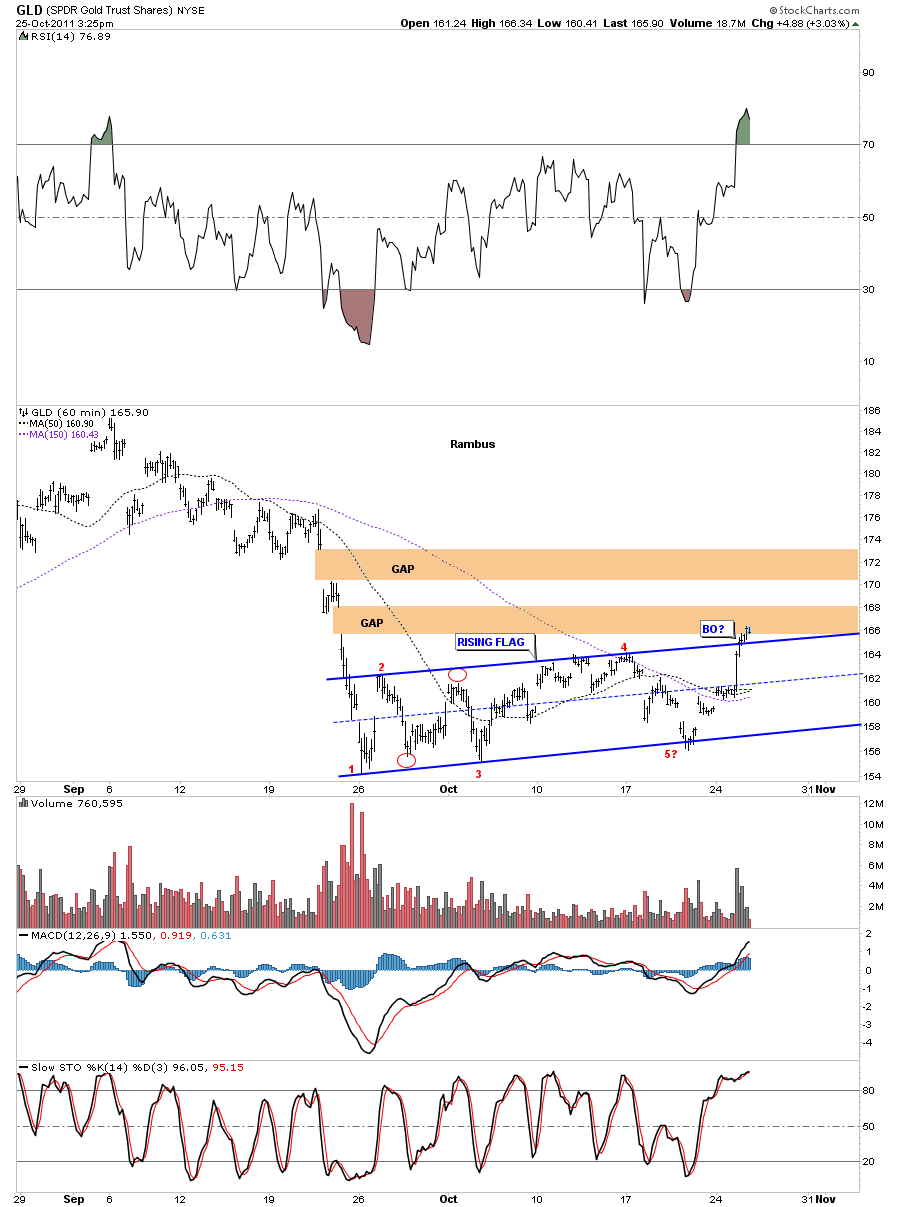
Just like SLV the GLD also has been consolidating for the last month chopping in a tight range. Below is a 60 minute chart showing the 5 reversal points and today’s breakout above the top rail. We had nice volume on today’s rally that makes the breakout more satisfying from a Technical Perspective. It will be interesting to see how we inter act with the two big gaps that are just north of where we are currently trading. We should get a backtest to the top rail now that should pave the way for higher prices. As I stated earlier today, if we get back into the rising flag we would have to go back to a neutral reading and await further developments. Keep your fingers crossed.

GLD 60 minute look.

XAU update

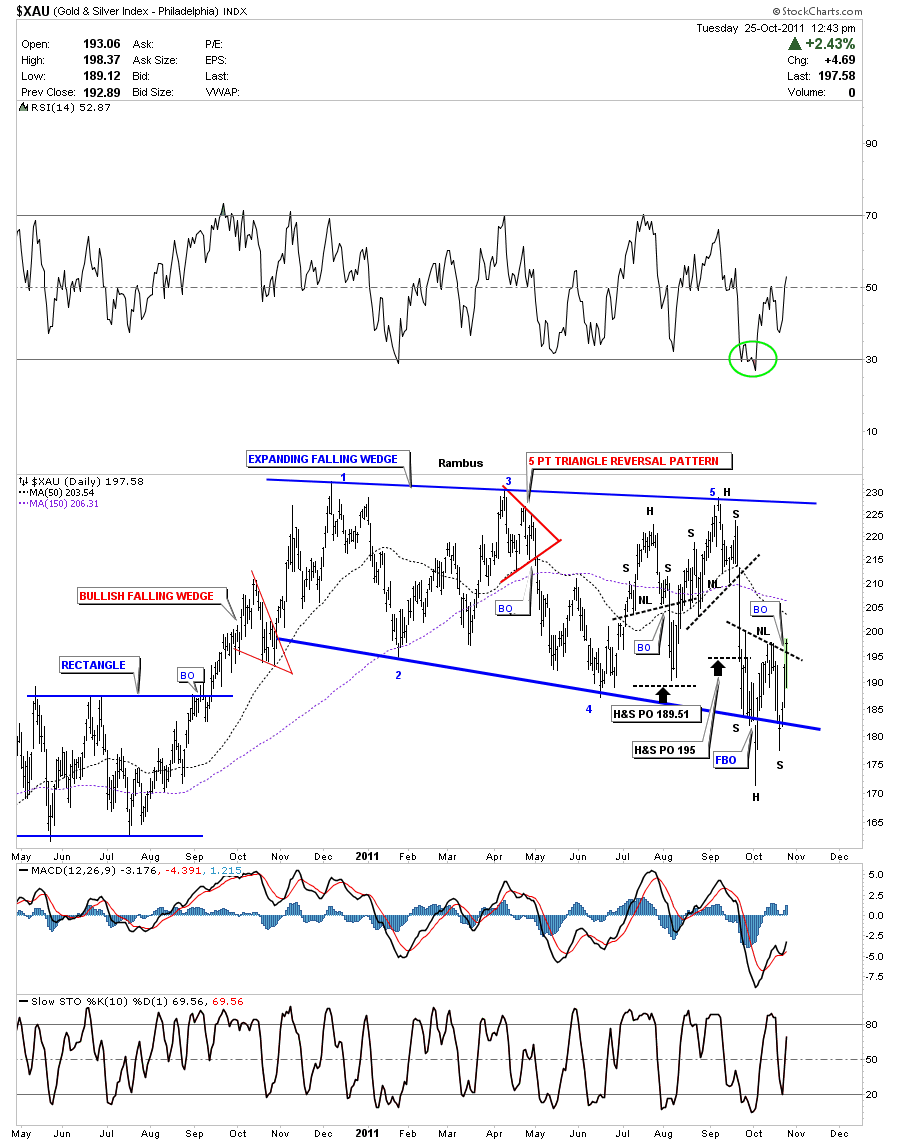
The XAU is one step ahead of the smaller cap index GDXJ as it’s breaking the neckline today signaling the completion of it’s H&S base. As I showed yesterday, on the HUI 60 minute chart, whenever you get a false breakout and then the price action takes you back into the original pattern, chances are it was a shakeout just before the big move gets underway. The specialist, market maker, will clear his books of all the stop loss orders which resides just below an importing support zone. He will then sell his bounty to the Johnny come latelys later on when the impulse leg becomes mature. This is just typical market action.

XAU daily H&S breakout.

GDXJ update

If you have been riding the juniors roller coaster ride you may have gotten sick to your stomach several times during this bull market in precious metal. There is a beautiful H&S bottom that is forming on the junior index, GDXJ that could be telling us the ride is going to get much better. This H&S bottom is also showing up on many individual junior stocks. Its past time to get your shopping list ready for execution. We have been buying into this weakness based on all the reversal patterns we have been seeing.

GDXJ daily H&S bottom.


SLV update

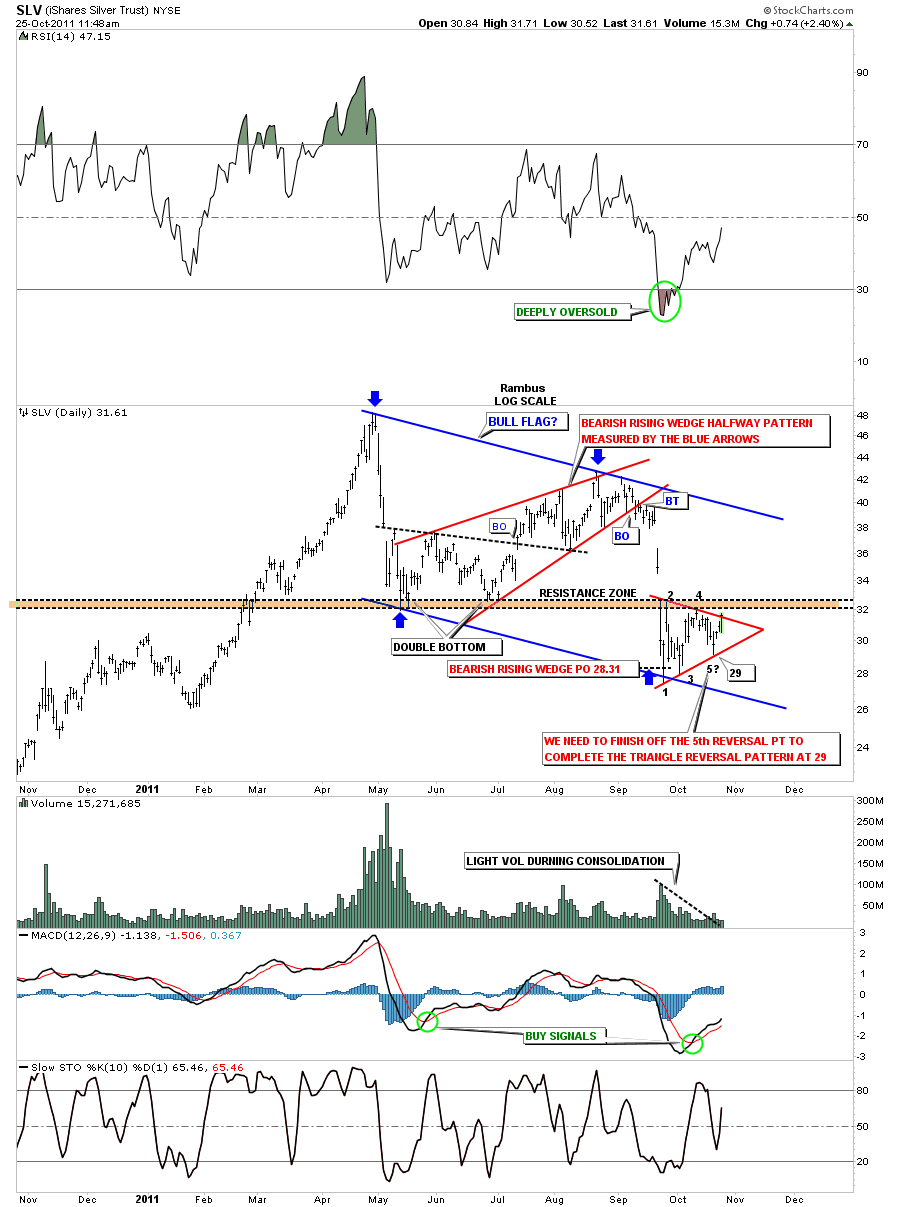
SLV has been consolidating in a triangle pattern for the better part of October. My view has been that this triangle needs to have 5 reversal points within the top and bottom rails to form a reversal pattern. This morning we hit the top rail completing the 5th reversal point. Does that mean the pattern is complete now? The answer is no. We could go back down to test the bottom rail again which would then put the triangle back into the consolidation pattern mode completing a 6th reversal point. Again, an even number of reversal points equals a continuation pattern in the same direction as the move coming into the pattern. A reversal pattern has an odd number of reversal points. As it stands right now we have completed the 5th reversal point and with alittle luck we will break the top rail of the triangle to complete the reversal pattern to the upside. Stay tuned as there are is a mounting body of evidence that this correction, we have been in for most of October, is getting ready to end and the next impulse leg up is close at hand.

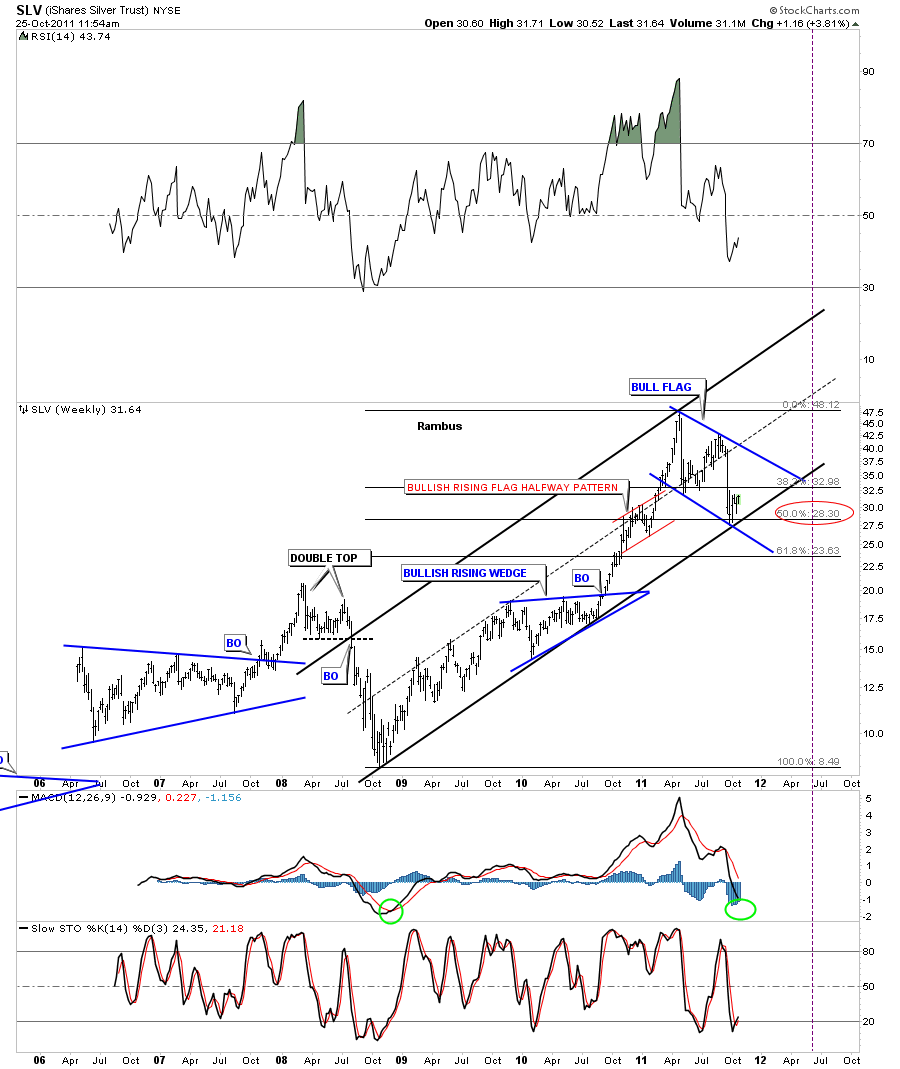
Here is a weekly look at the bigger picture. If you are a bear you better not go into hibernation as you might miss some serious fireworks to the upside.

SLV weekly bull flag.

STOCK MARKETS BREAKING OUT

A couple of weeks ago I wrote an essay on why I thought the stock markets were on the verge of breaking out. Today’s action is now showing us a breakout to the topside is in progress. We looked at alot of long term charts to get rid of some of the noise from the short term look. Sometimes you have to step out of the forest to see the trees. I also said that the rally for the stock markets would be good for the precious metals stocks and bad for the dollar. So if you were looking for all the stock markets to crash and the world to end as we know it you may need to rethink what inflation is going to do to just about everything you can think of including the stock markets going up when emotionally thinking says just the opposite. Anyway today’s action is very positive IMHO.

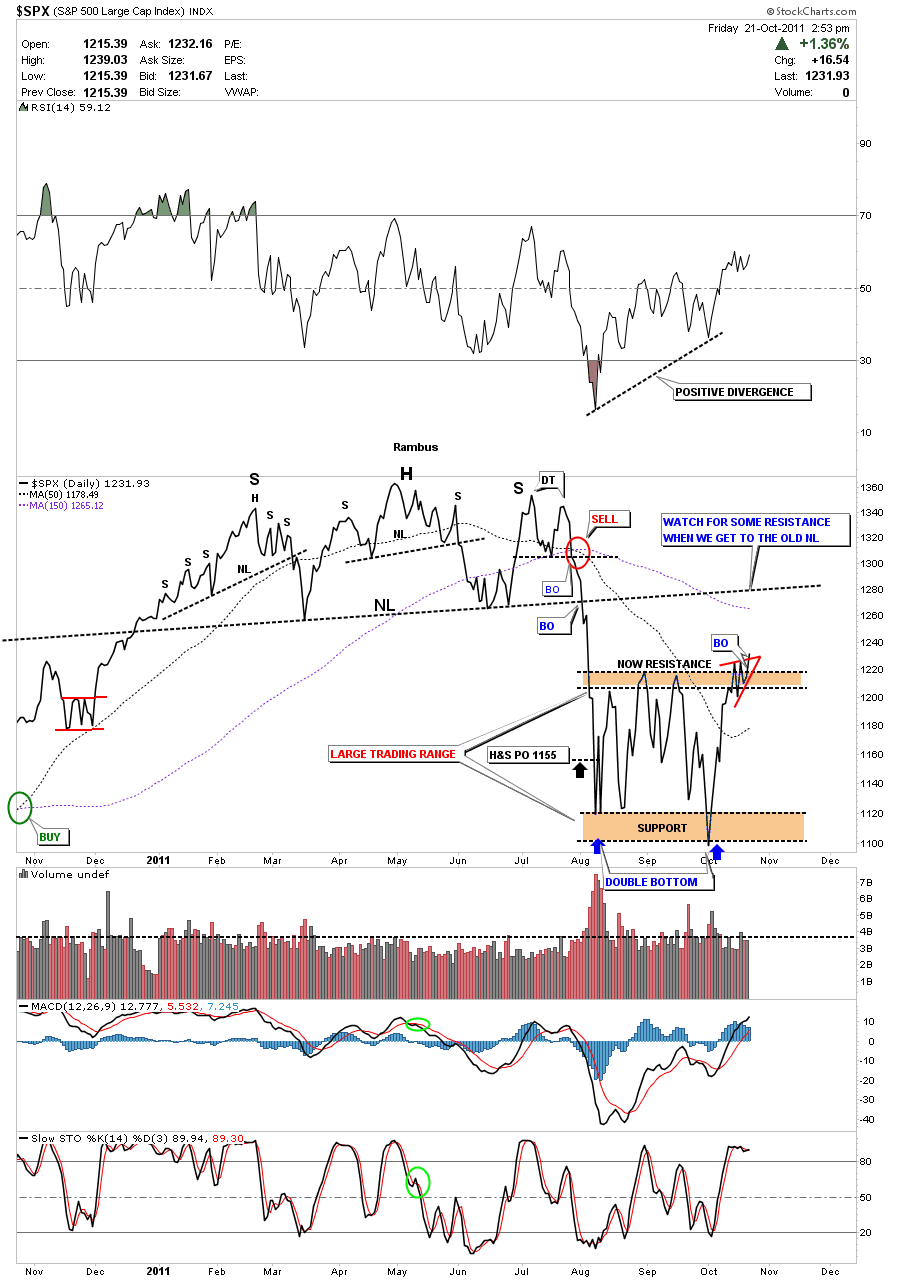
Below is a daily line chart of the SPX showing the volatile trading range we have been in since we broke the neckline back in August. Note that we did hit the H&S price objective on the first leg down at 1155. Sometimes using a line chart helps takeout alot of the noise that a bar chart can show especially when there are inter day breaks of support and resistance zones. I’m going to classify our trading range as a double bottom at this time. To measure a double bottom or double top you just measure the distance from the bottom to the top of the range and add that distance to the top of the range to get your price objective for the double bottom in this instance. We should get some resistance at the old neckline where we might form some kind of small consolidation pattern. Note the positive divergence on the RSI above the chart.

HUI daily look

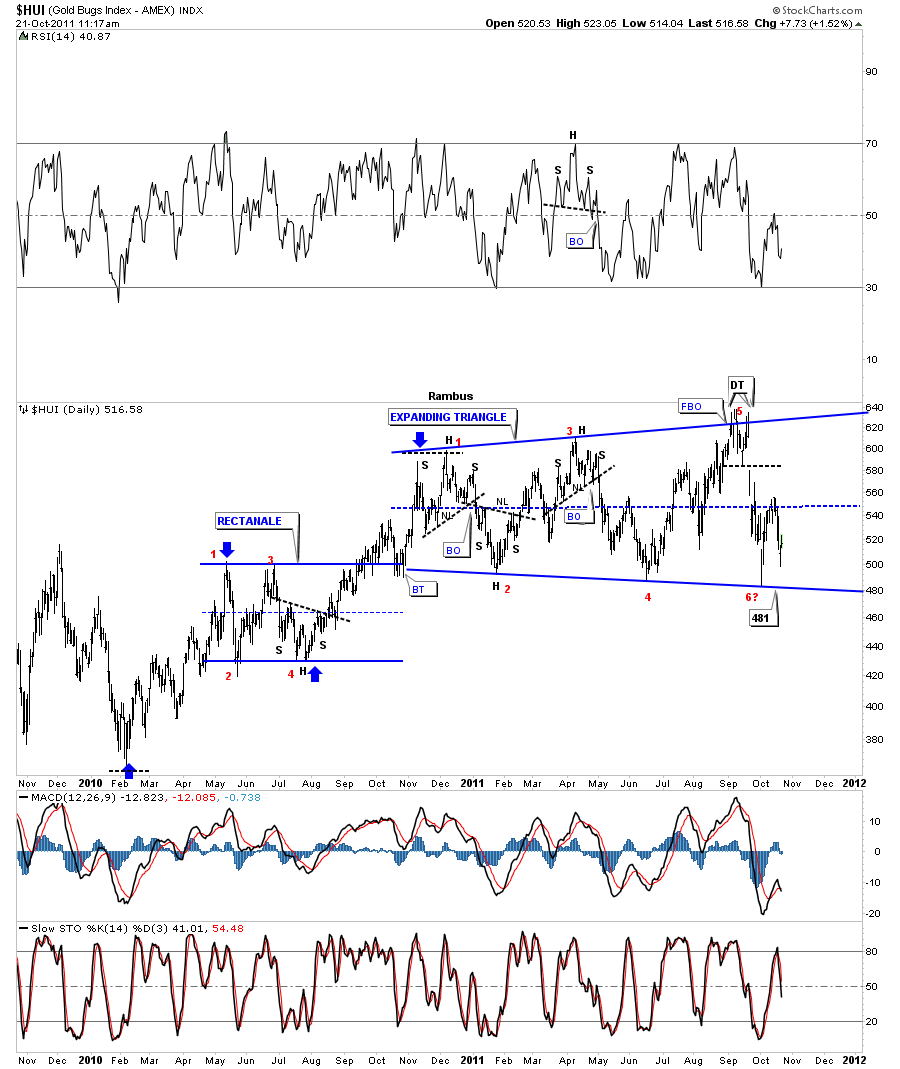
Below is a chart of our ever expanding triangle that has been forming for a year now. These type of patterns give you alot of false buy and sell signals by breaking out above the previous high only to reverse back inside the pattern with the same thing happening at the bottom of the trading range. Whipsaw city. What we do know is the expanding triangle is complete after it hit the top rail at point #5. You can see the double top at point 5 that led to our last leg down that finished at the bottom rail with a slightly lower low than the previous low back in June.. Our latest bounce off the bottom rail took us to the center of the consolidation pattern, dashed blue rail, where the rally petered out. In a big trading range like we are in you can see how most reversals within the expanding triangle were accompanied by some kind of reversal pattern, such as a H&S or double top or bottom. This is one reason I would like to see us touch the bottom rail one more time to complete a rather large double bottom that would call for a move all the way back to the top of the pattern. What we want and what we get can be two different things. Bottom line is we know the boundaries of the trading range and can act accordingly.

HUI daily look.