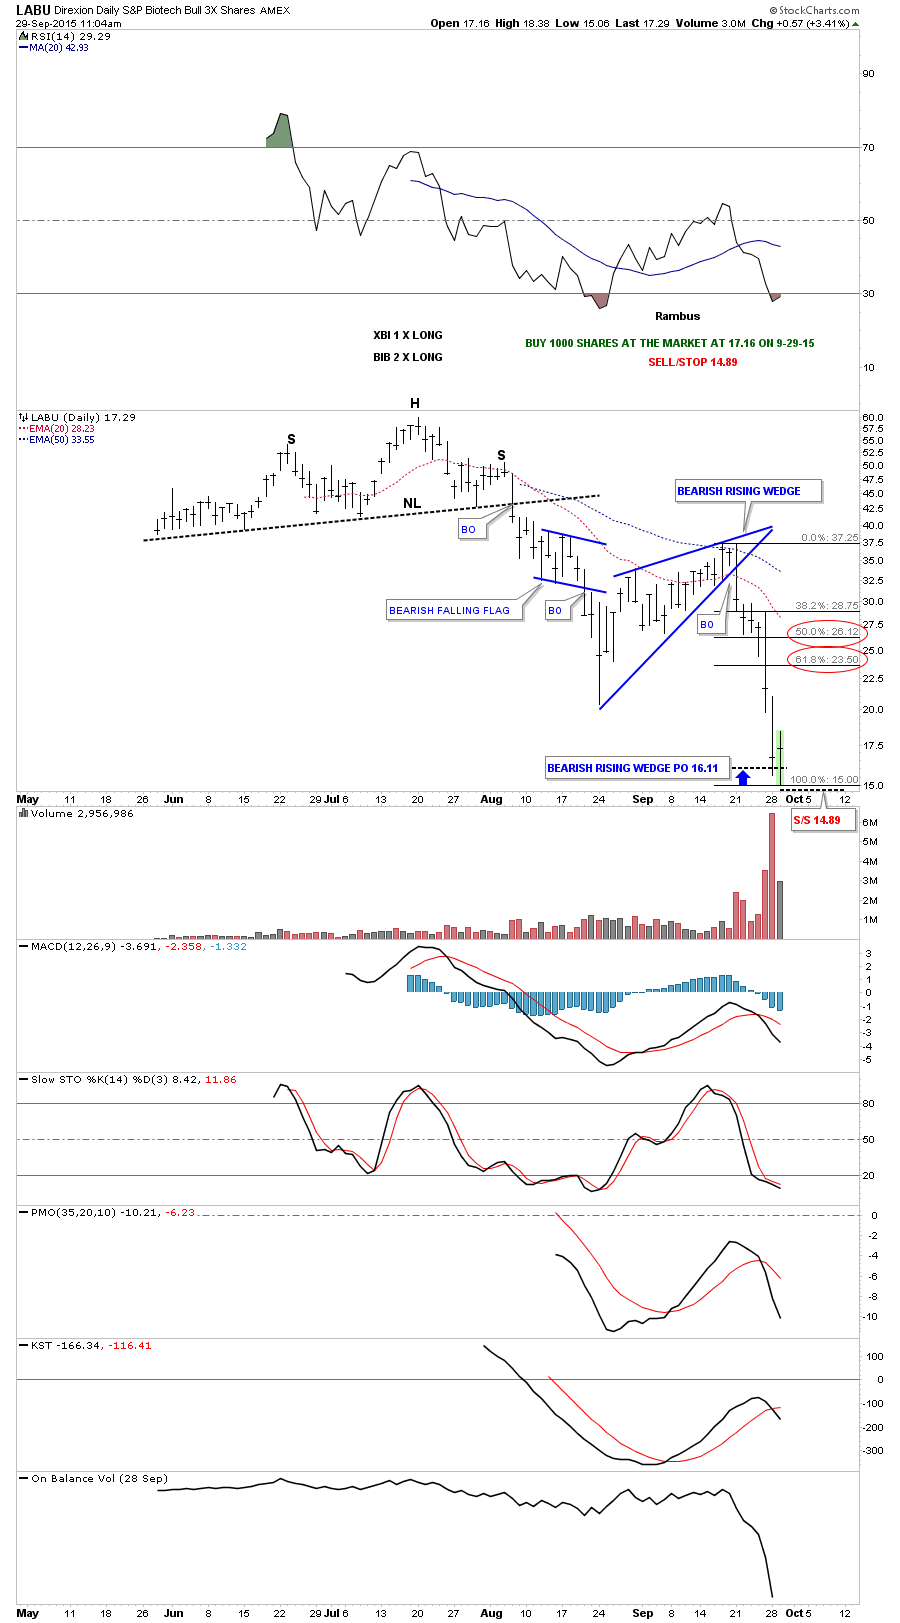
LABU reached my price objective yesterday at 16.11. This is an area where we can expect to see a reversal or consolidation pattern to begin forming. I’m going to buy 1000 shares at the market at 17.16 with the sell/stop at 14.89 just below today’s low. As of today I’m just expecting a relief rally of some kind to one of the fib retracements.
HUI & GLD Combo Chart…
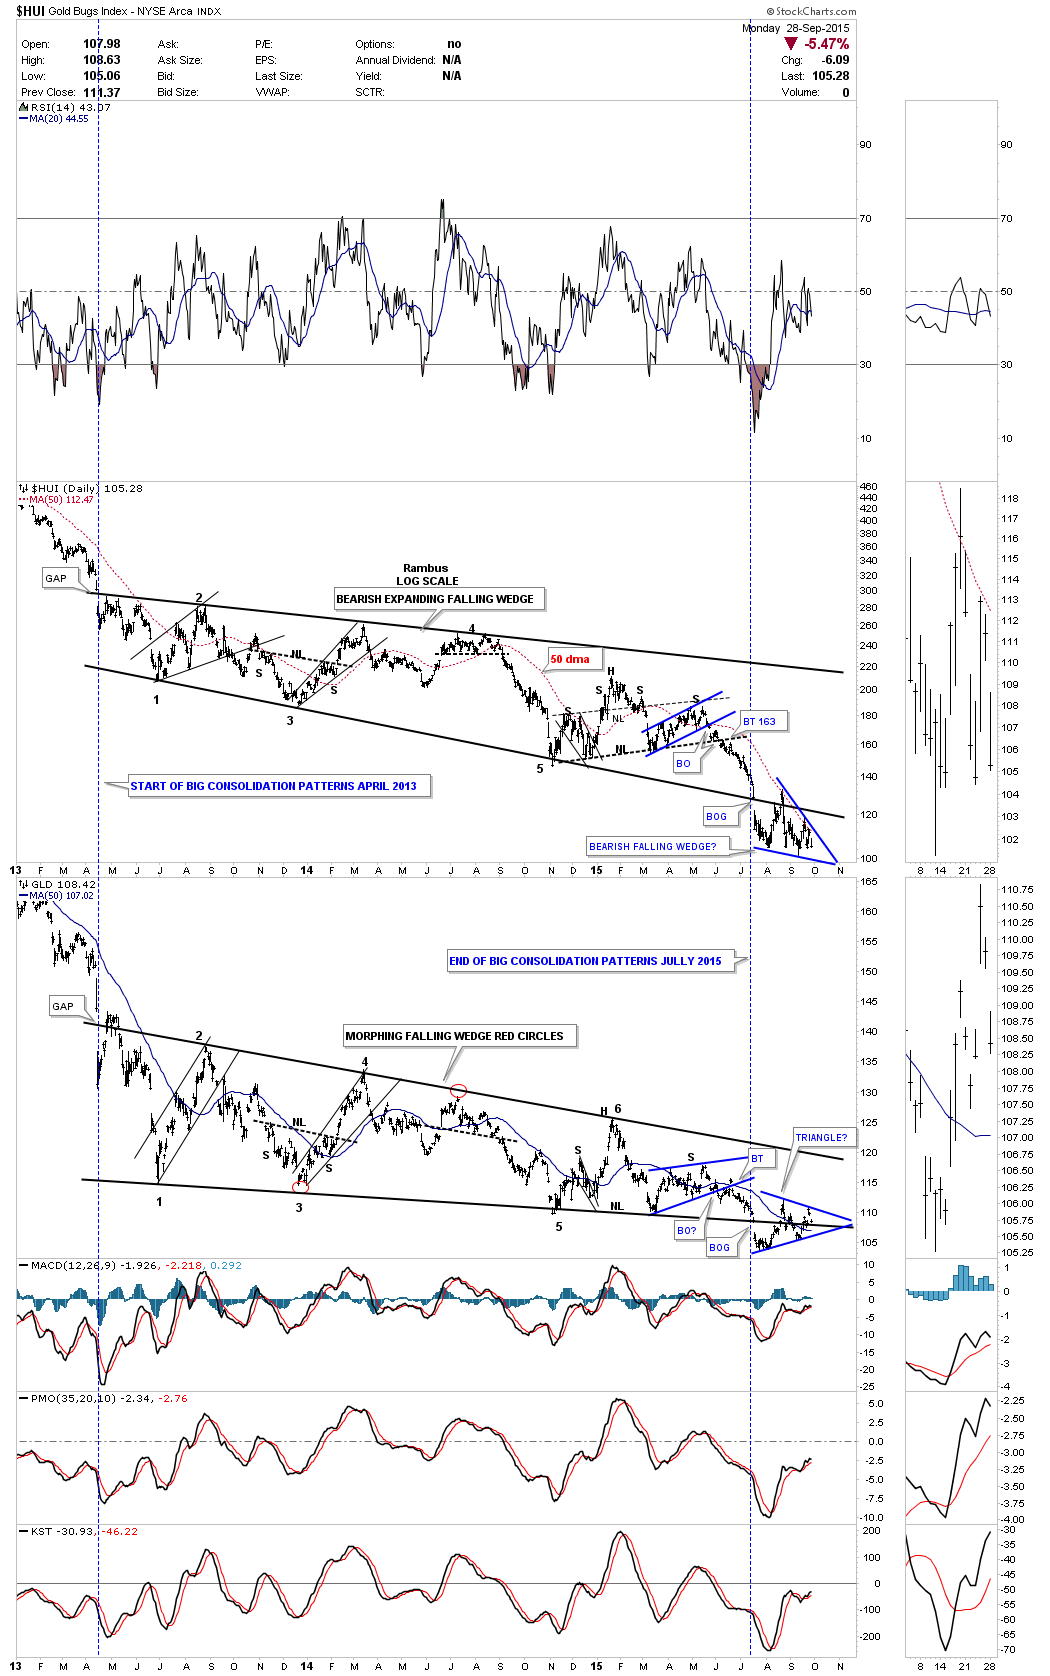
Below is the combo chart we’ve been following very closely that has the HUI on top and GLD on the bottom. This charts shows the big 2 plus year consolidation patterns for each stock. On the left side of the chart you can see how they both began building out their big consolidation patterns with a big gap down in April of 2013. Then they both broke below their respective bottom rails in July of this year also with a huge breakout gap. Since the big breakout in July of this year they both have been forming smaller consolidation patterns at their breakout points. As the HUI has been weaker than GLD it’s forming a small blue bearish falling wedge just below the bottom rail of its 2 plus year consolidation pattern. GLD on the other hand has been stronger and is forming a blue triangle consolidation pattern right on its bottom trendline of its 2 plus year consolidation pattern. They’re both working on their fourth reversal point within their small blue consolidation patterns. It wouldn’t surprise me if we see them both break below their bottom blue rails on the same day which will be confirmation that the next impulse move down is truly beginning. It has been a long time coming but we’re ever so close.
GDXJ Update…
SPX Update…
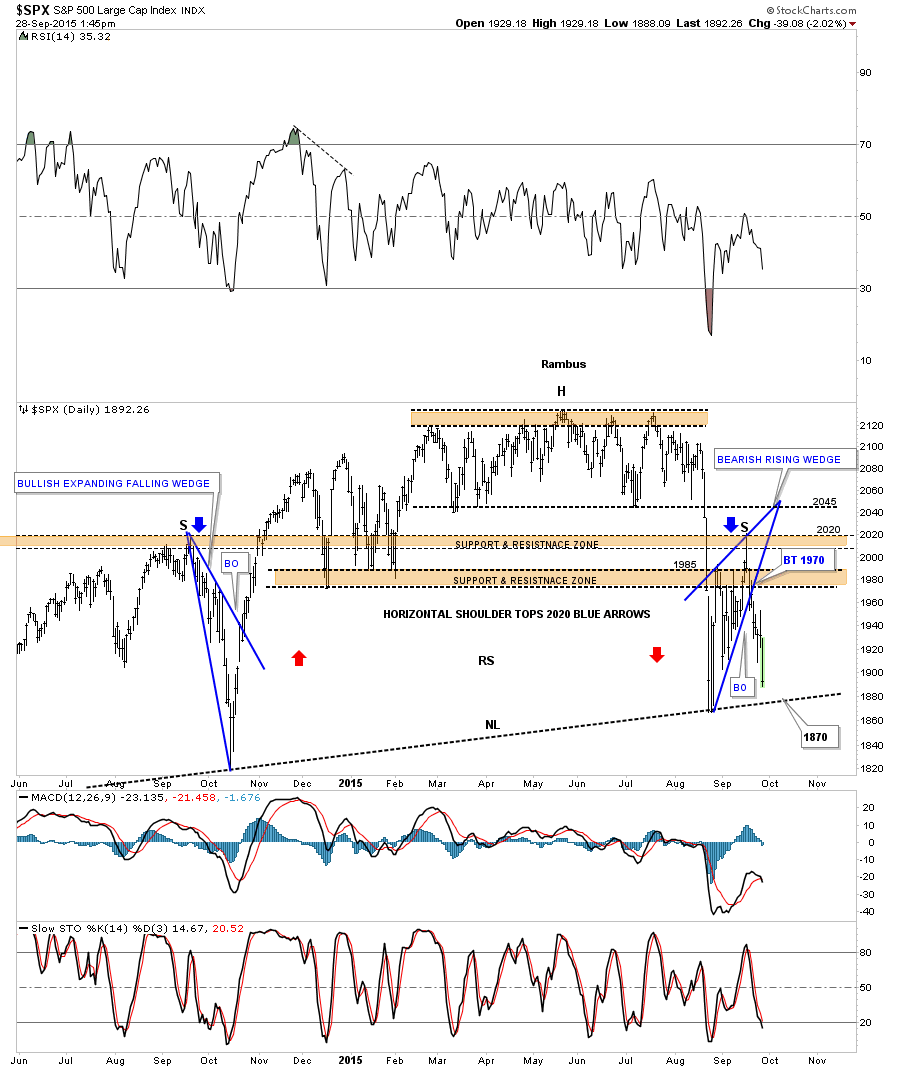
Below is the daily chart for the SPX we looked at last week that is showing the potential H&S top. What I’m most interested in is how the price action inter acts with the possible neckline around the 1870 to 1875 area. If the neckline is valid we could see an initial bounce followed by a break below the neckline or we could see a gap below the neckline without any bounce. The potential neckline is the most important trendline on this chart right now.
HUI, GLD, and SLV Combo Chart…
COMPQ Update…
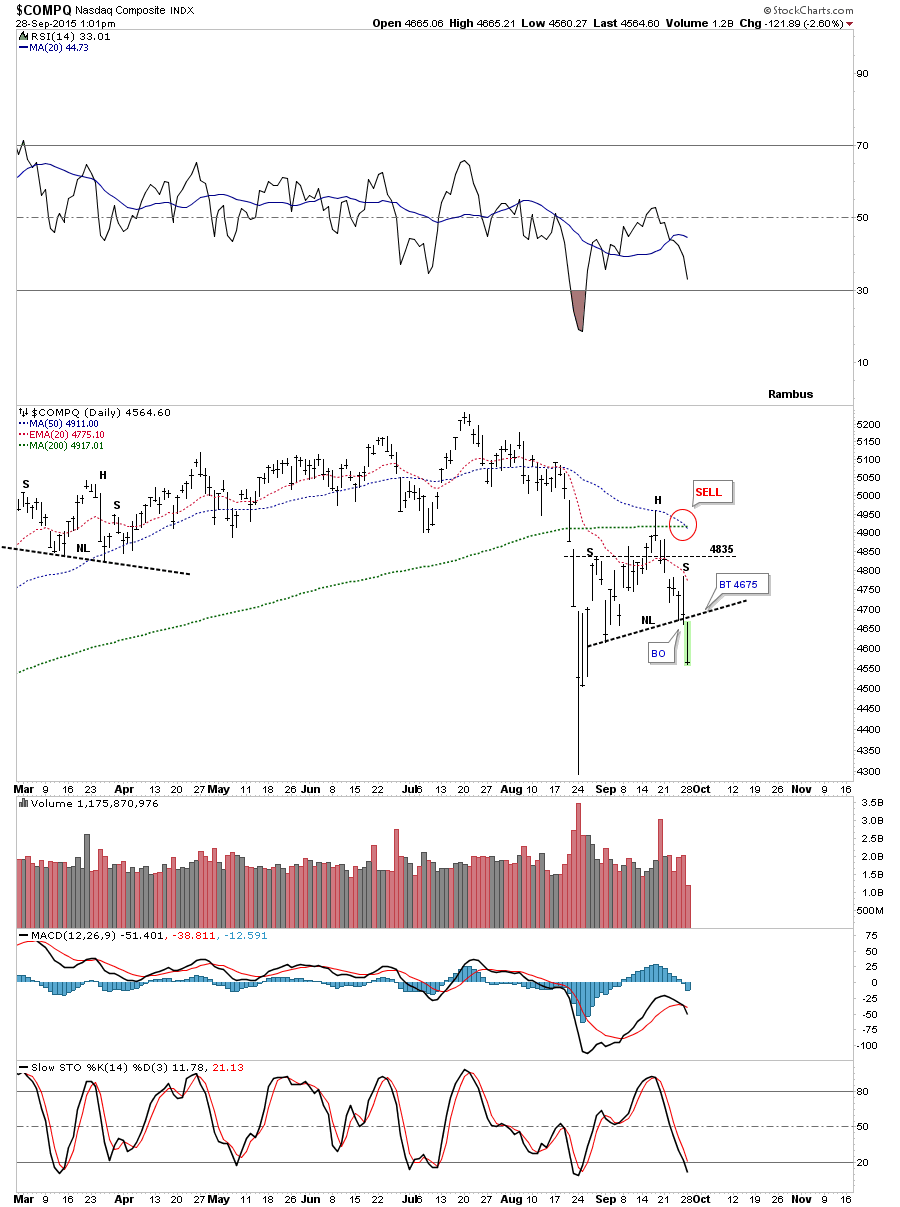
Below is a slightly different look at the COMPQ which I’m showing a H&S consolidation pattern instead of the bearish rising wedge which is also valid. If the COMPQ gets a counter trend rally I will use the backtest to the neckline at 4675 to go short. Note the 50 dma is now crossing below the 200 dma. I’ve been hesitant to put on a lot of positions until our website is up and running at full speed. I’ve been holding alot of cash. I will keep monitoring all the different markets and if you see something that catches your eye go for it.
JDST Trade Setup…
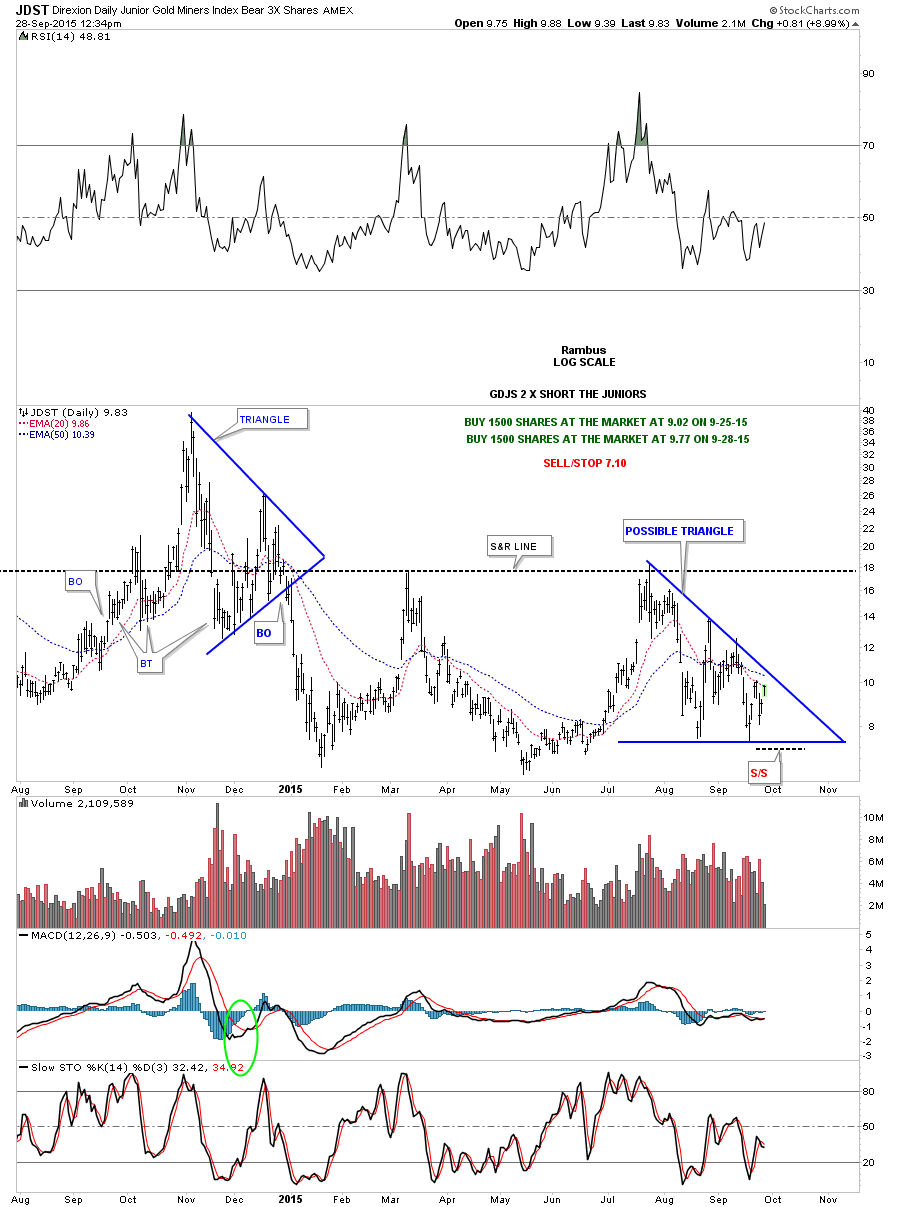
I’m going to take another small position in JDST and buy 1500 shares at the market at 9.77 using the same sell/stop for now. The more conservative traders may want to wait for the price action to break above the moving averages and the top rail of the potential blue triangle. GDJS is a 2 X short the juniors etf.
DUST Trade Setup…
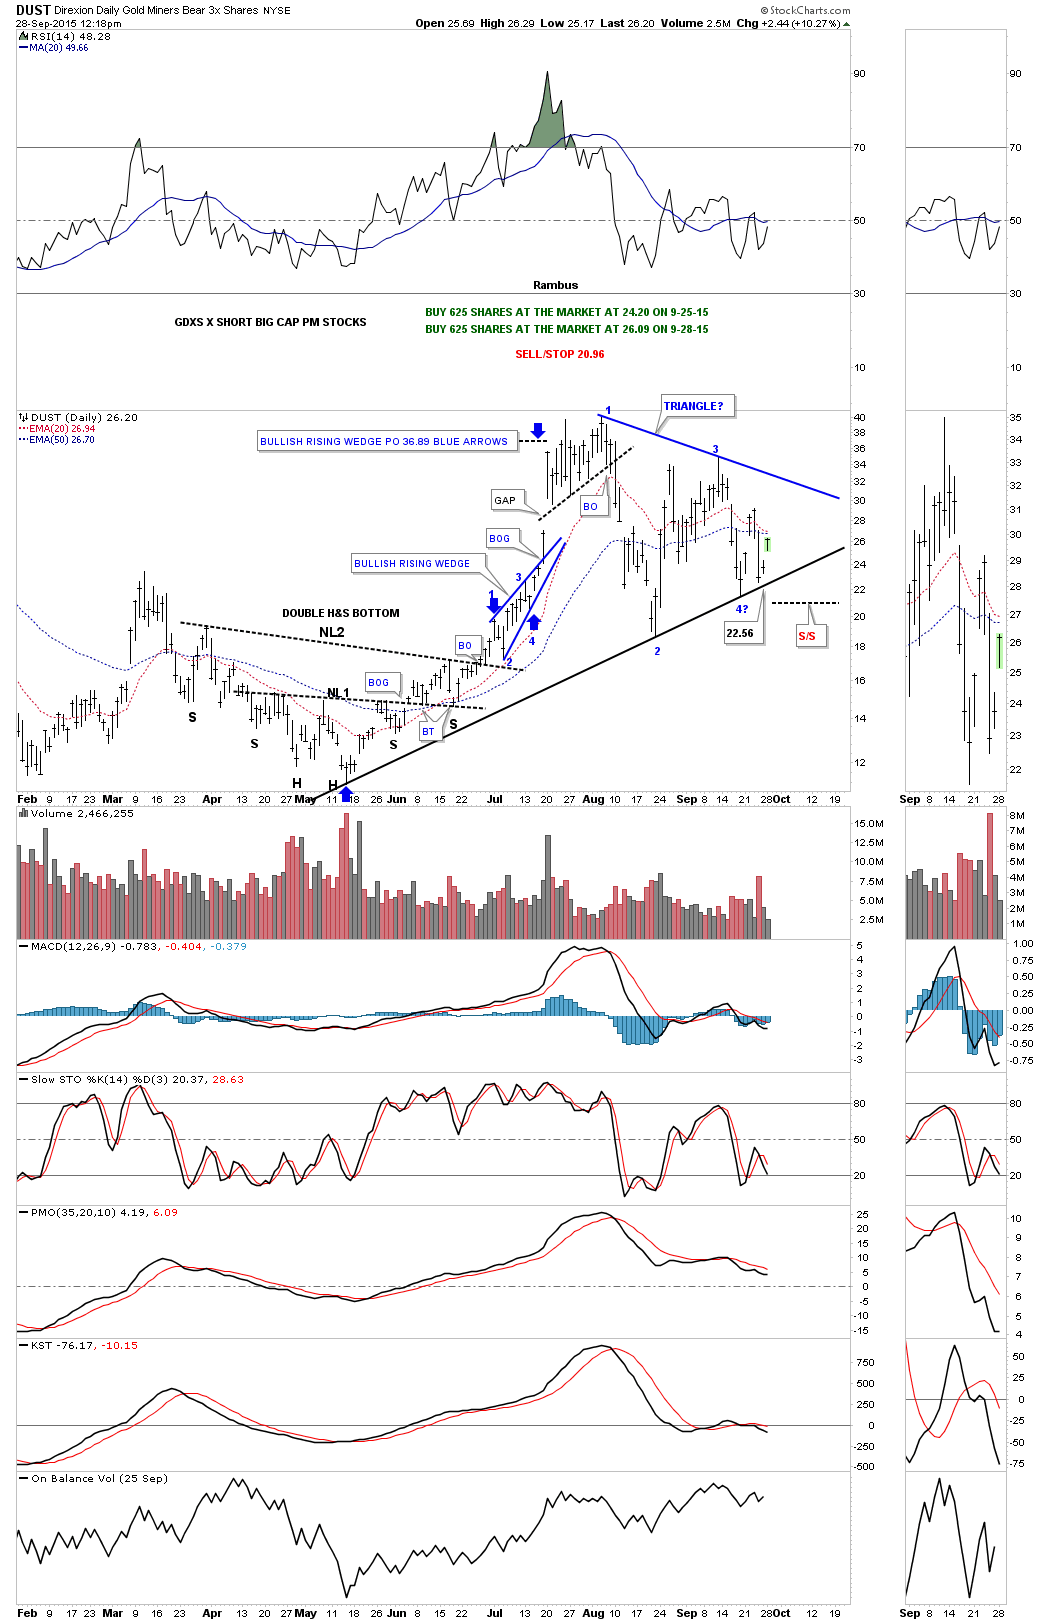
I’m going to take another small bite and buy another 625 shares of DUST at the market at 26.15 using the same sell/stop for now. The more conservative investors may want to wait for the price action to trade above the 20 and 50 ema’s before entering into this trade. GDXS is a 2 X short the big cap PM stock index.
GDM Update…
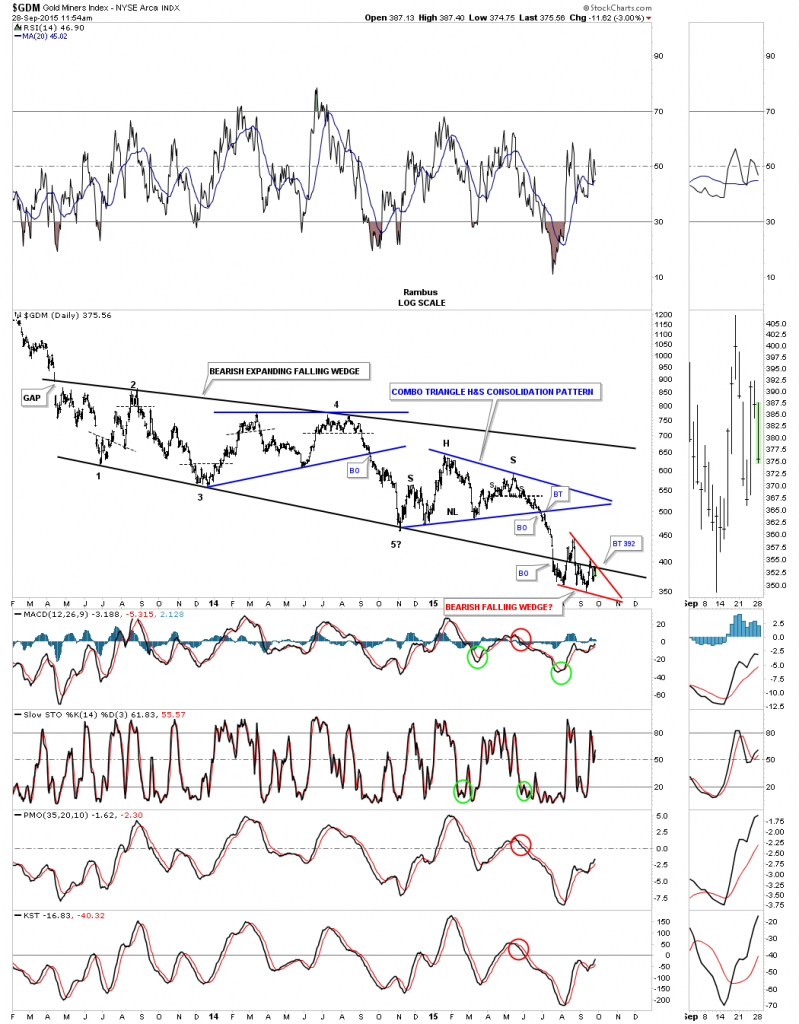
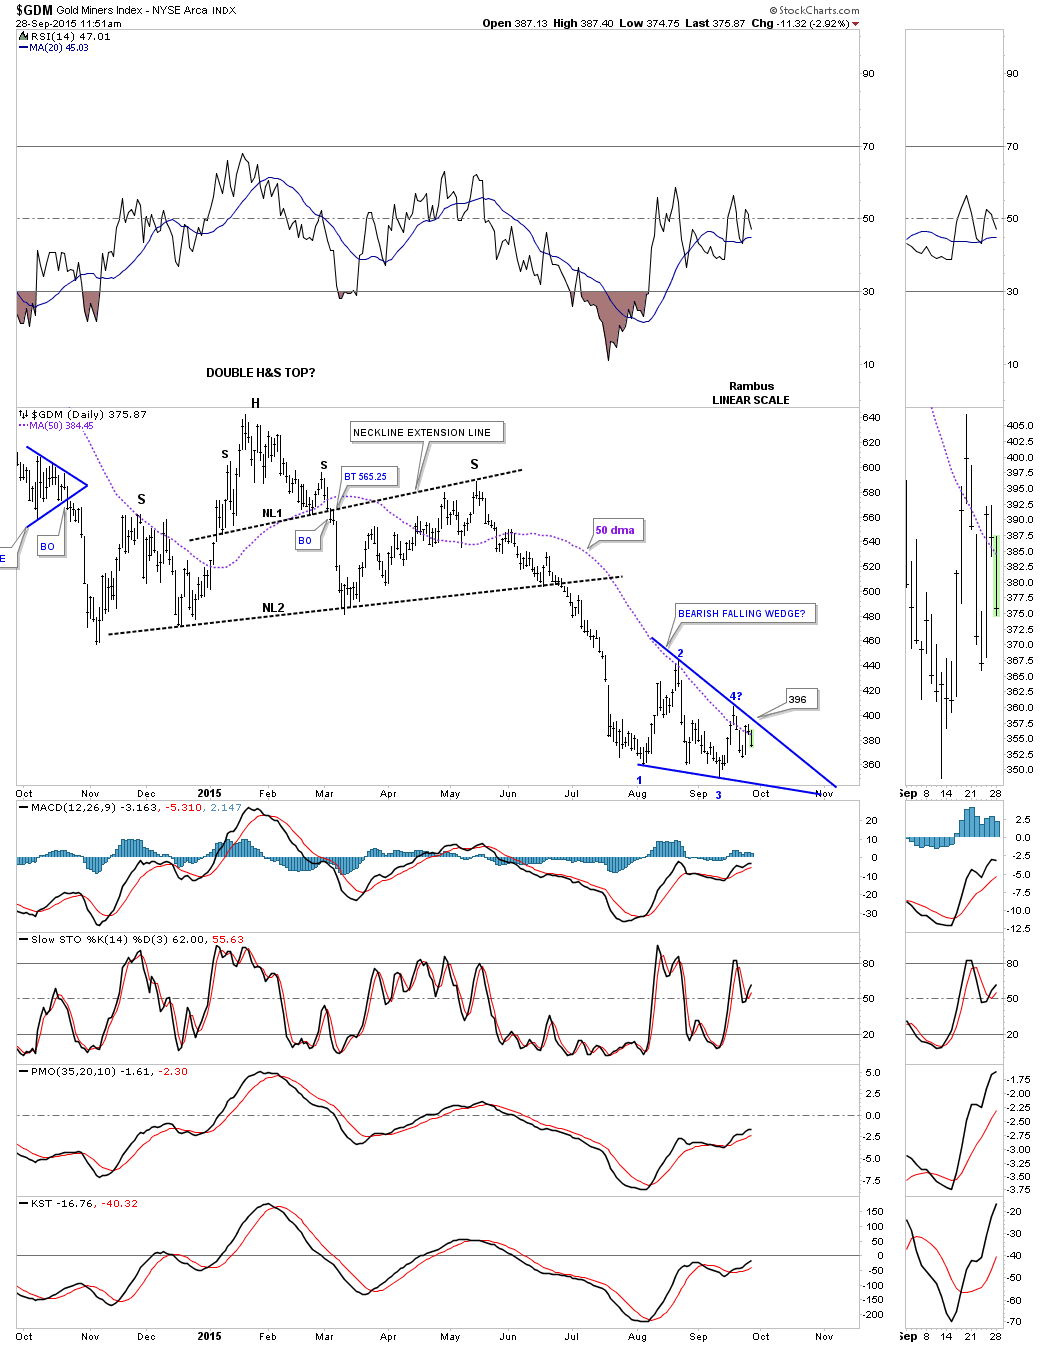
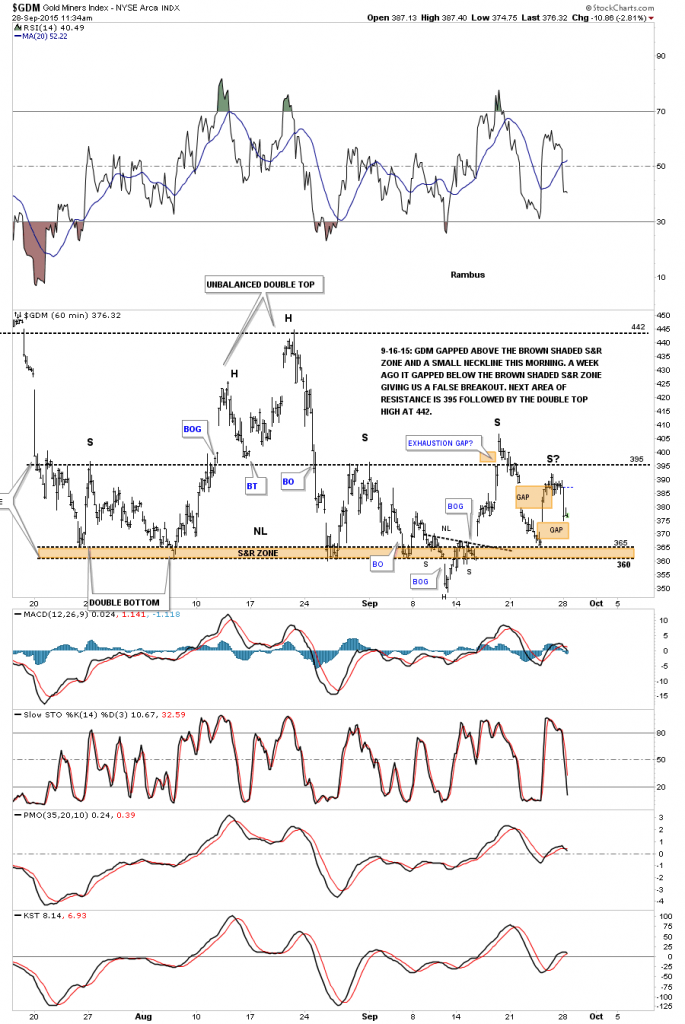
Just a quick update which shows the GDM is now testing the top of a big gap made last week. It’s still possible that it could be forming an unbalanced H&S consolidation pattern with 2 right shoulders and one left shoulder.
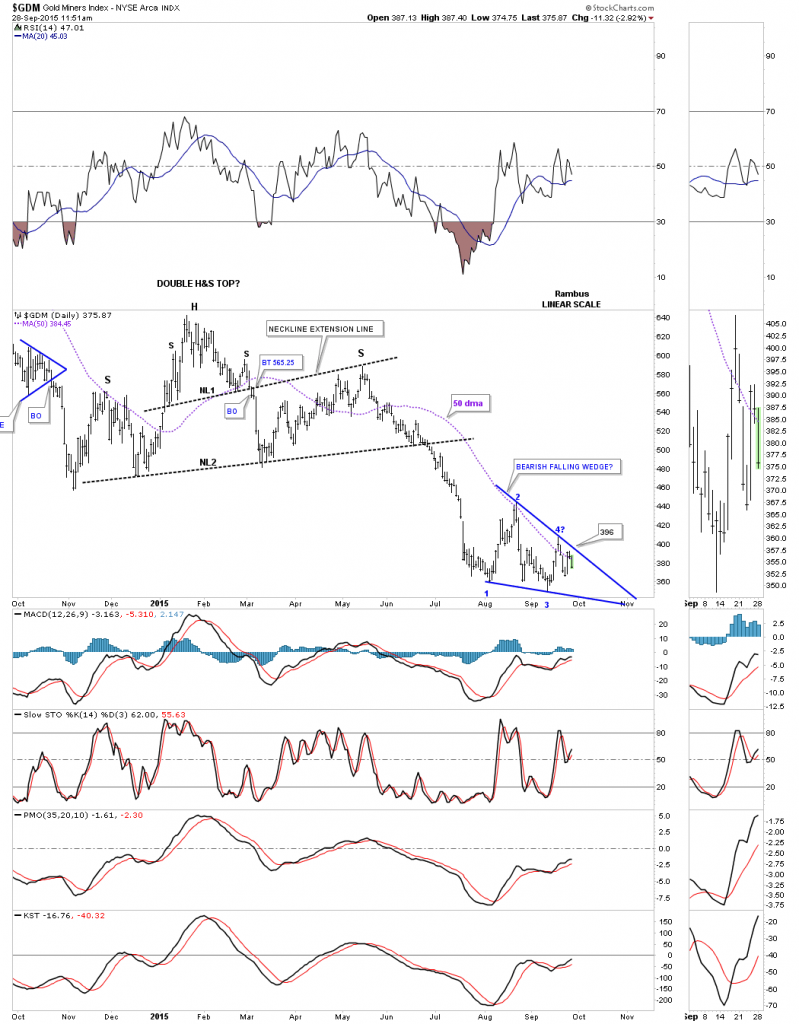
Last week I showed you this potential bearish falling wedge that is working on its fourth reversal point to the downside with the 50 ma holding resistance.
This long term daily chart for GDM is the most important chart to keep a close eye. We have the massive 2 plus year bearish expanding falling wedge in black that is made up of several smaller blue consolidation patterns. You can see how the bottom rail of the black expanding falling wedge and the top rail of the possible red bearish falling wedge are intersecting at 392 or so. I have shown you many times, and you’re probably getting tired of me telling you, but when you see a smaller consolidation pattern form just below an important trendline, bottom rail of the 2 plus expanding falling wedge, this is generally a bearish setup. This could very well be our last really low risk entry point to short the precious metal stock indexes using whatever short etf that matches your risk tolerance. The next place to add shorts will be if the bottom rail of the red bearish falling wedge gives way.