It appears we maybe entering into another bout of deflation by the looks of some of the charts I’ve been looking at. The US dollar will be the key driver if this second leg down is going to take hold. Many of the commodities charts are looking pretty heavy right now along with some of the commodities based currencies.
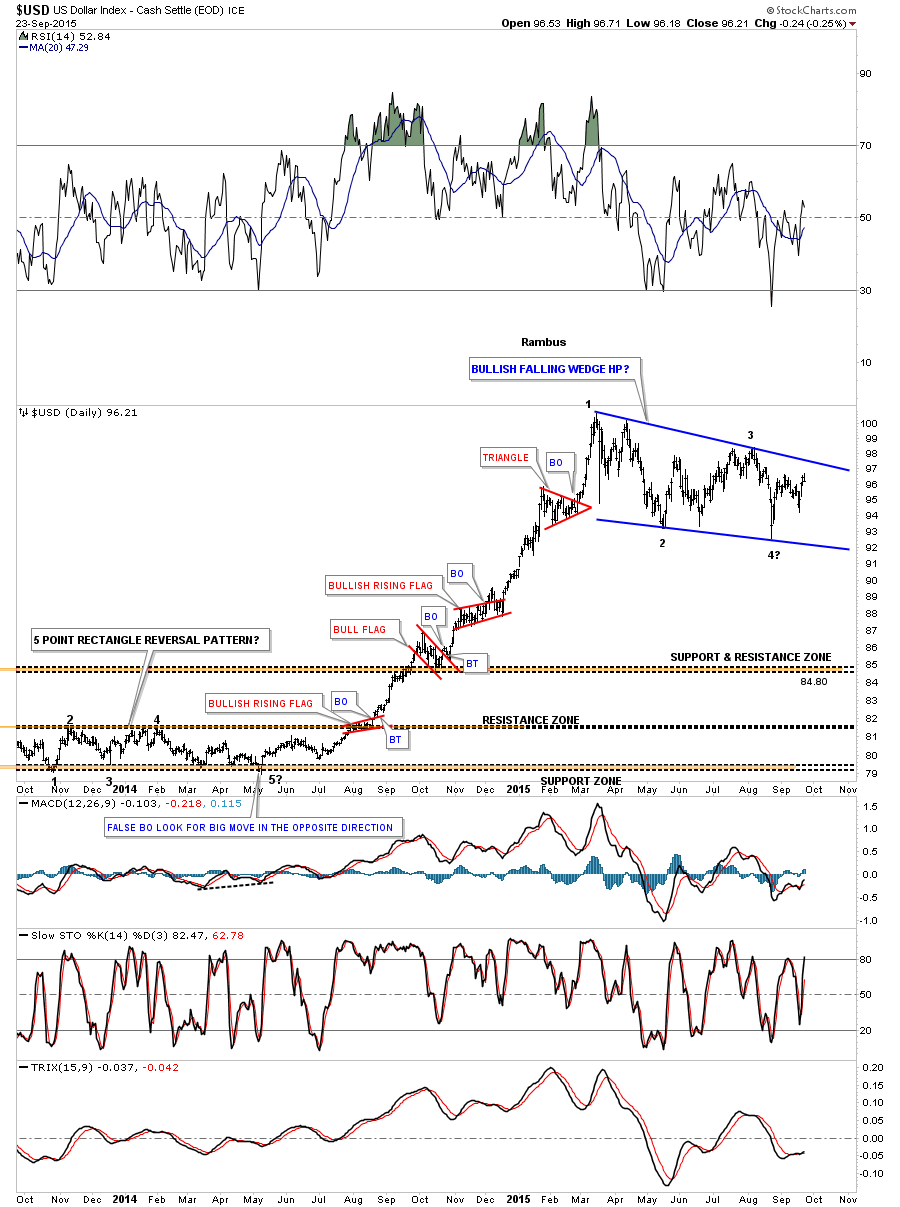
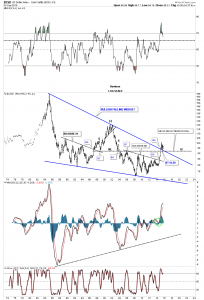
Lets start by looking at the most important currency in the world the US dollar. We’ll start with a two year daily chart for the US dollar that shows the big impulse move up that began last year in July and ended in March of this year. That big impulse move up was made up of four small red consolidation patterns two of which were bullish rising wedges which tells us the move is strong. Note how much bigger our blue bullish falling wedge consolidation pattern is vs the smaller red consolidation patterns that made up the impulse move. This is a perfect place for the US dollar to consolidate those big gains made last year. From a Chartology perspective this is exactly what you would like to see. The US dollar is working on its fourth reversal point that won’t be complete until it touches the top rail. At that point the pattern will be complete but we’ll still have to wait for the breakout to occur.

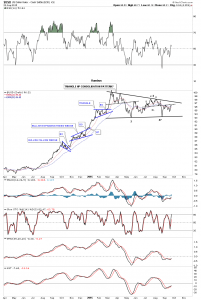
The daily line chart for the US dollar gives us a nice perspective on the development of the six month consolidation pattern which is showing up as a triangle. It’s currently testing the neckline made at reversal point #3 which is offering some short term resistance. A break above the little neckline will bring the top rail of the black triangle into focus. One step at a time.
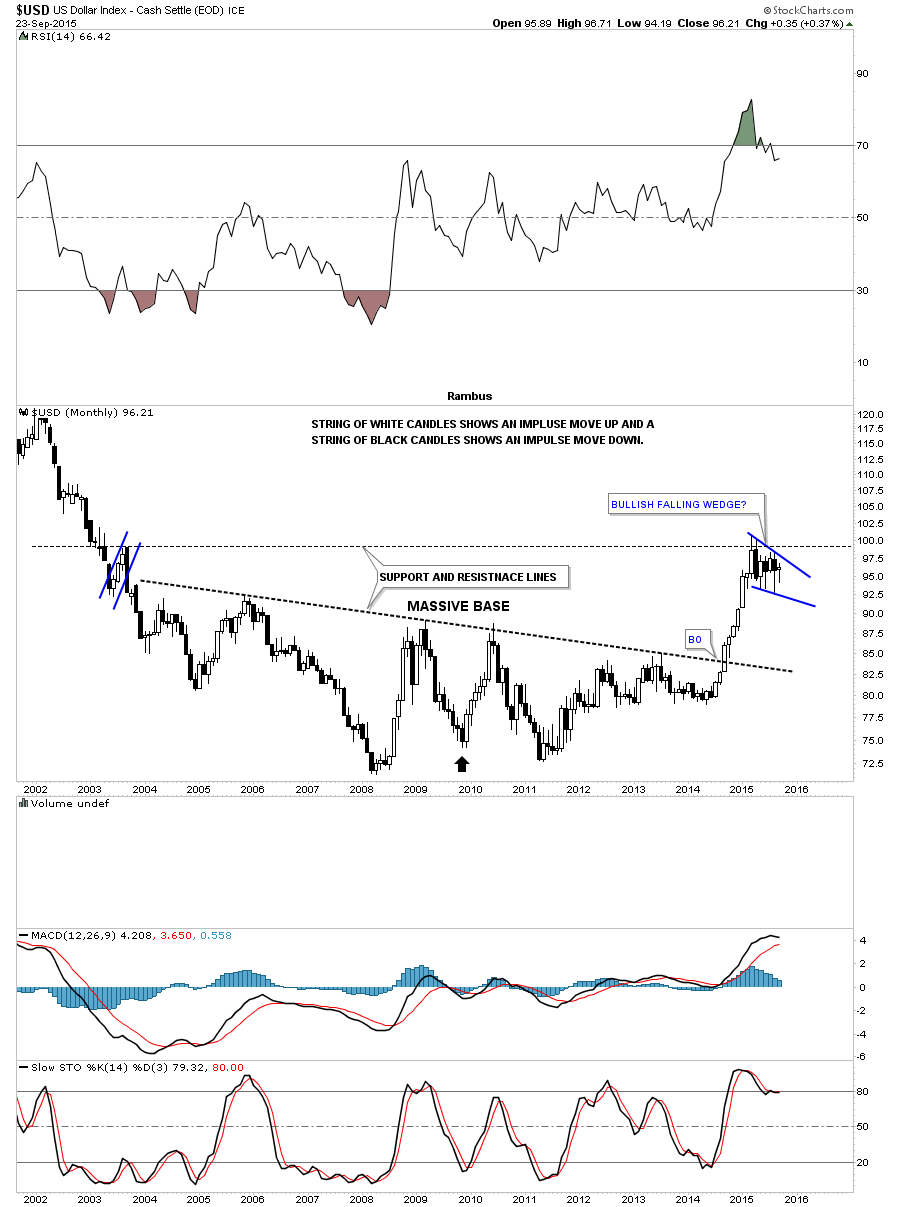
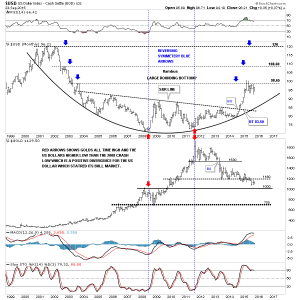
Lets now look at some long term monthly charts for the US dollar so you can see why I’m so bullish on the US dollar. This first monthly chart shows the big base that was built over a ten year period or so. Note the string of white candlesticks that shows us how strong that impulse move out of the big base was. The blue bullish falling wedge formed at the previous high made way back in 2003. This chart also shows you some nice reverse symmetry. How a stock comes down is often how it goes backup if the move down was very strong. I put a black arrow at the center of the chart just above 2010. Reverse symmetry is not a perfect science but it does give you a place to look for support or resistance when the trend changes. When you look at the chart below think of the black arrow as the center of a piece of paper. If you fold that piece of paper from the right side of the page to the left side you can see how similar the downtrend was to our current uptrend. Again the correlation isn’t perfect but you can see how the right side of the chart matches roughly the left side of the chart starting at the black arrow.

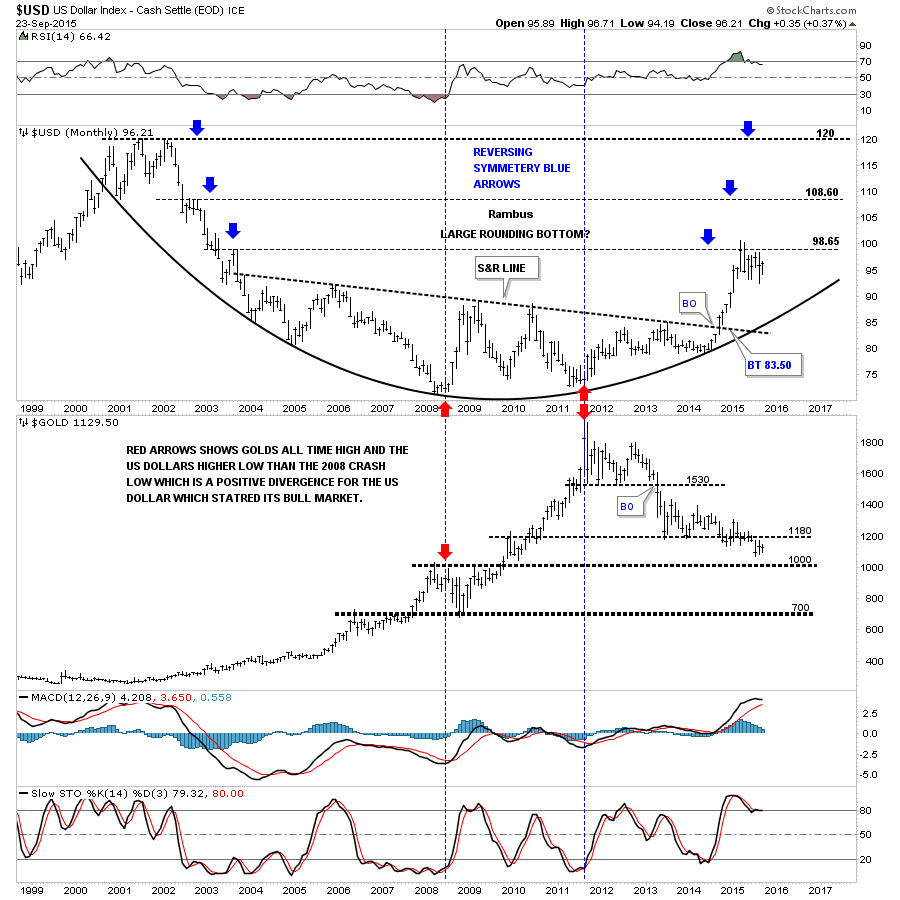
The next chart is a combo chart that has the US dollar on top and gold on the bottom. If the reverse symmetry keeps playing out we should expect the US dollar to breakout above the most recent high and rally up to the next area of resistance which was the high made back in 2002. This would most likely affect the PM complex and commodities in a negative way.
Lets look at one last long term chart of the US dollar which shows the massive bullish falling wedge that began to form back in 1984 or so. The big base we’ve been looking at on the charts above is labeled big base #2 on the chart below. That rally out of big base #2 was also strong enough to takeout the 30 year top rail of the bullish falling wedge. I’ve been showing this chart since the day the US dollar broke out above the top rail of that 30 year triangle. That breakout area just above the top rail of the falling wedge is our smaller bullish falling wedge we looked at on the daily chart above. Over the last six months or so that top rail has reversed its role to what had been resistance to now support. This chart shows why I think another down leg in the deflationary spiral maybe getting close at hand. The smaller daily falling wedge will show us the way when it finally breaks out.
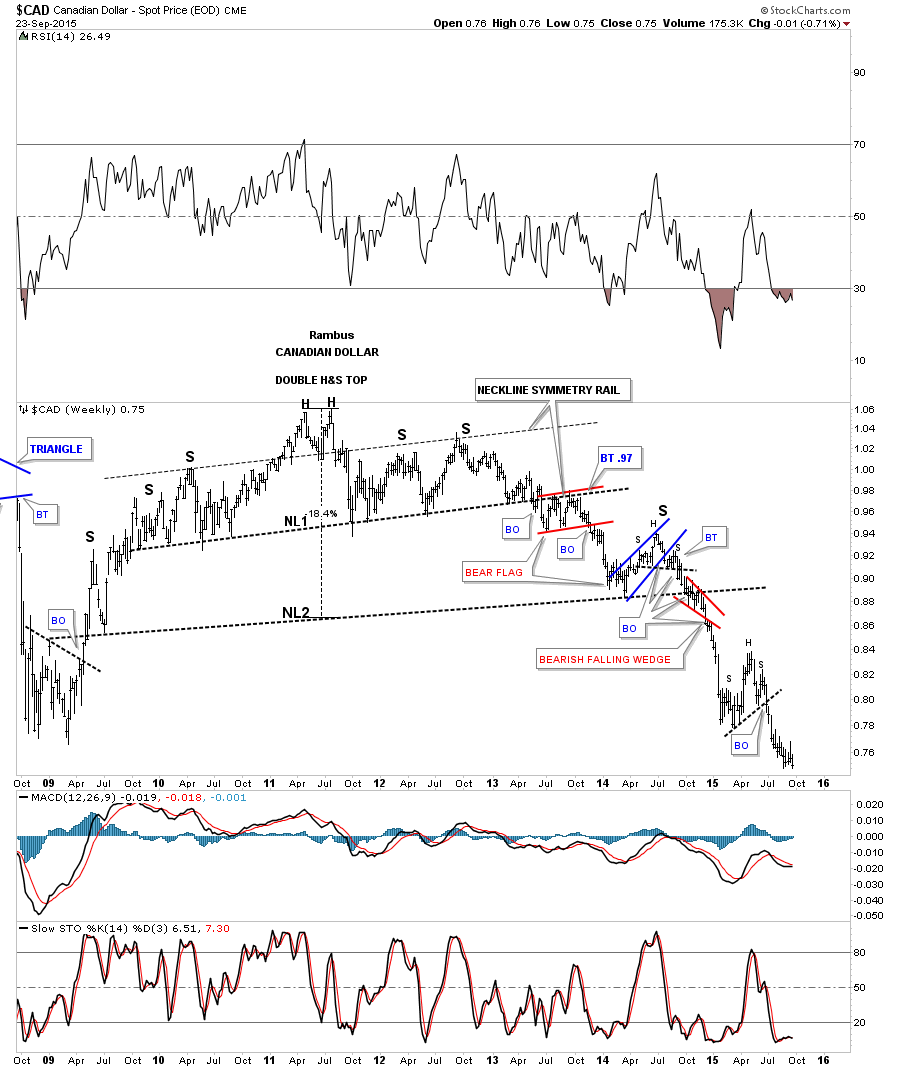
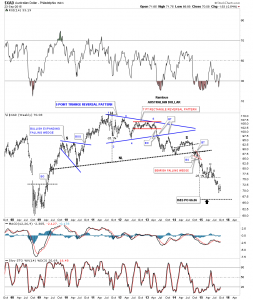
If the US dollar is going to rally to new highs it would make sense that most of the other important currencies of the world will look just the opposite to the US dollar by showing a bear market. The weekly chart for the Canadian dollar shows a huge topping pattern that took over five years to complete. It’s now trading at multi year lows.

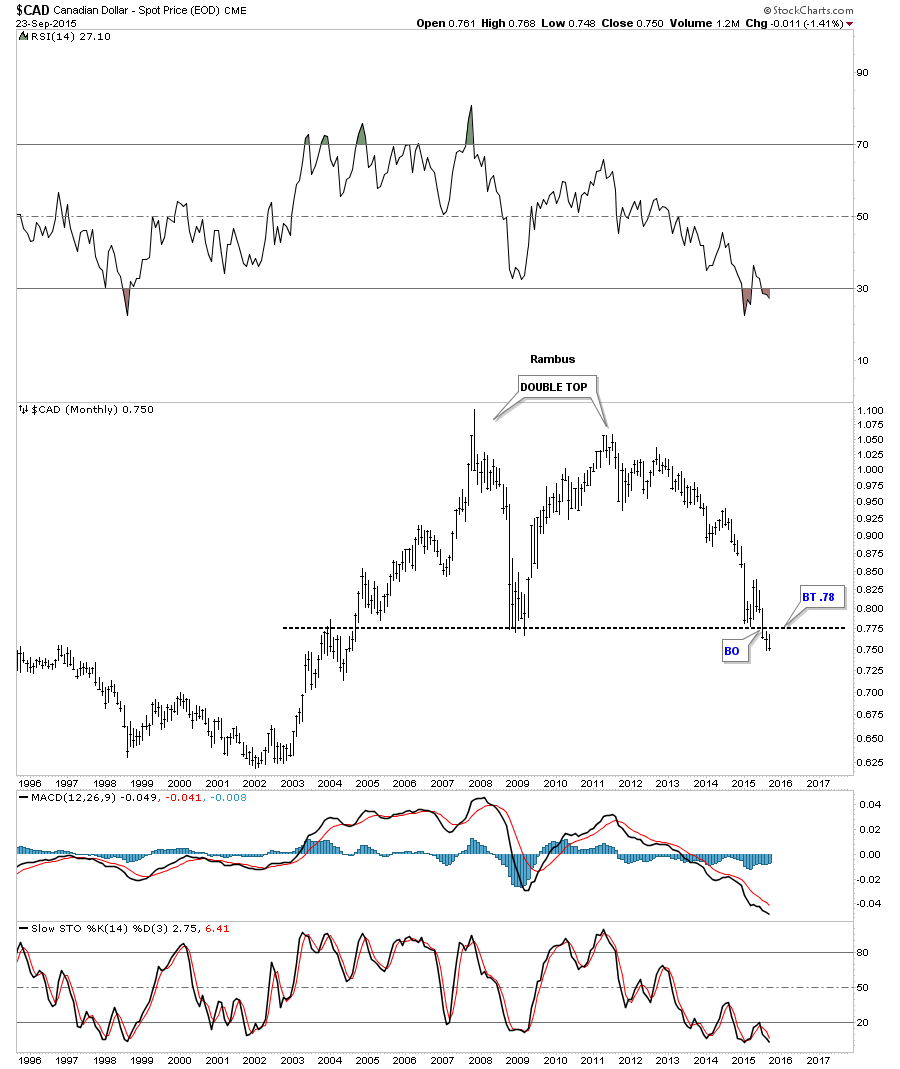
The 20 year monthly chart for the Canadian dollar shows it’s now just breaking below a double bottom trendline creating a huge 10 year double top. There is a lot of room for this currency to move lower.

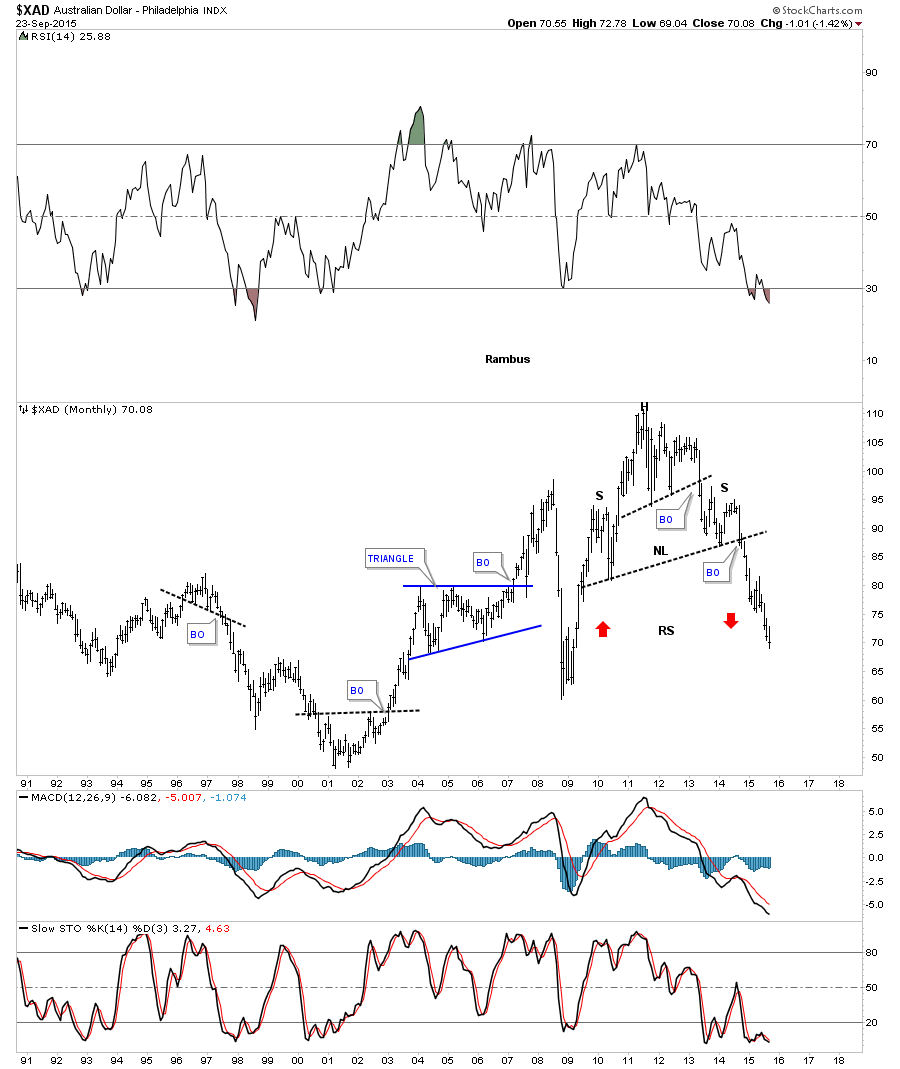
The Australian dollar is another commodities based economy that has put in a massive H&S top and is currently in its next impulse move down. Some of the longer term members may remember that little red bearish falling wedge that formed just below the neckline when the breakout occurred.
The long term monthly chart shows the Australian dollar forming a massive H&S top and is currently reversing symmetry to the downside as shown by the red arrows.

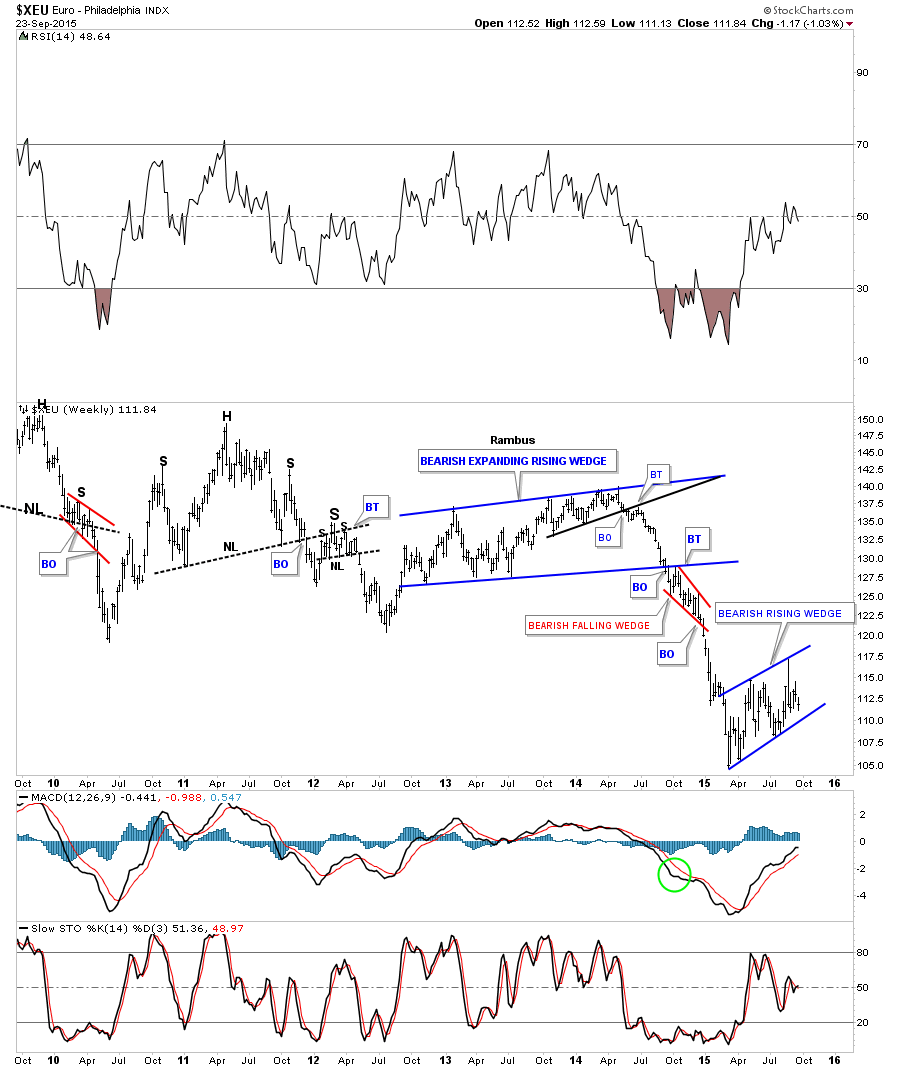
The euro is the most important currency to follow if you want to know what the US dollar is up to. In the first chart tonight I showed you the US dollar was in the process of building out a potential bullish falling wedge. If the US dollar is building out a bullish falling wedge then there is a good chance that the euro is building out a mirror image pattern of the US dollar which would be a bearish rising wedge. Like the US dollar the euro is also working on its fourth reversal point which won’t be complete until the bottom rail is hit.
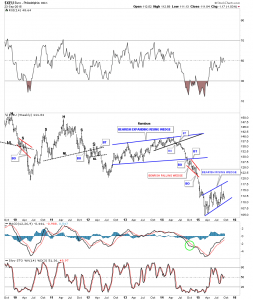
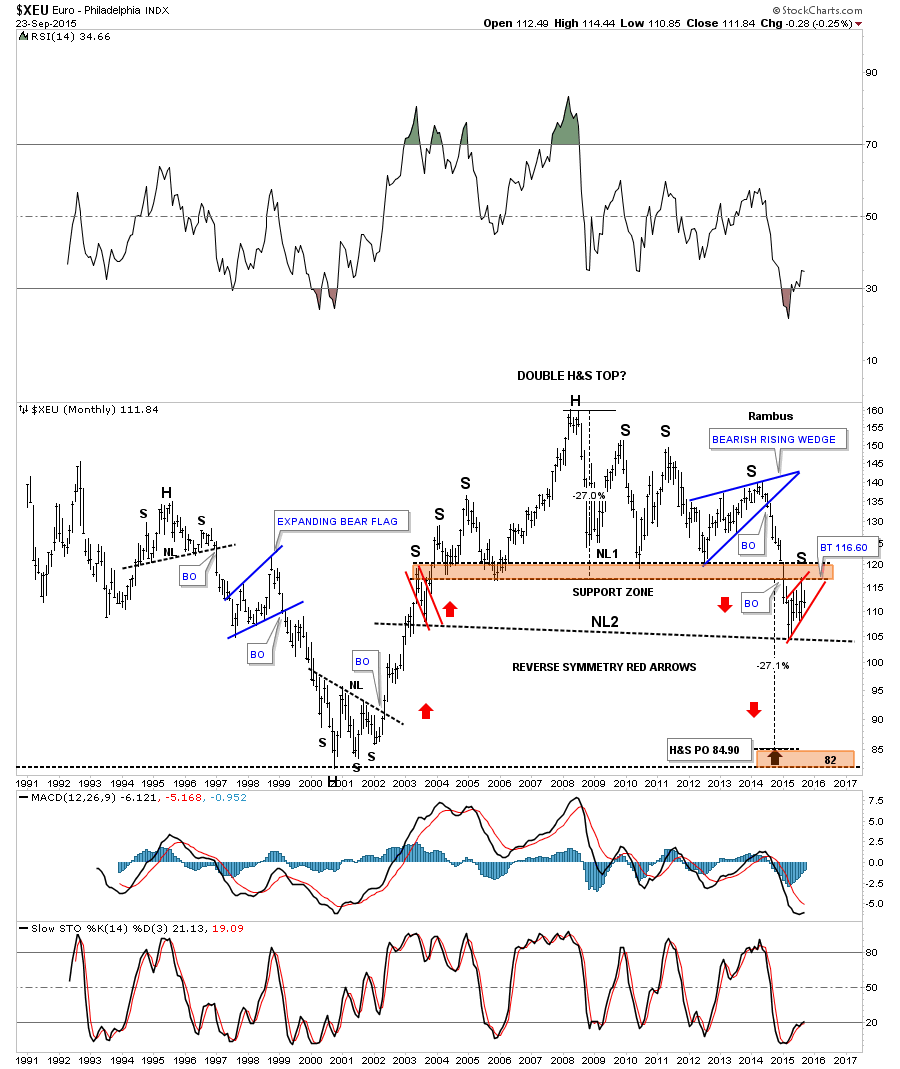
The monthly chart for the euro shows it has built out a massive double H&S top which would be an inverse look at the US dollars big base. During the last six months or so the euro has built out the little red bearish rising wedge just below the brown shaded S&R zone or neckline #1. Here again you can see the reverse symmetry is alive and well as shown by the red arrows. From a Chartology perspective this is a pretty but ugly looking chart for the euro.
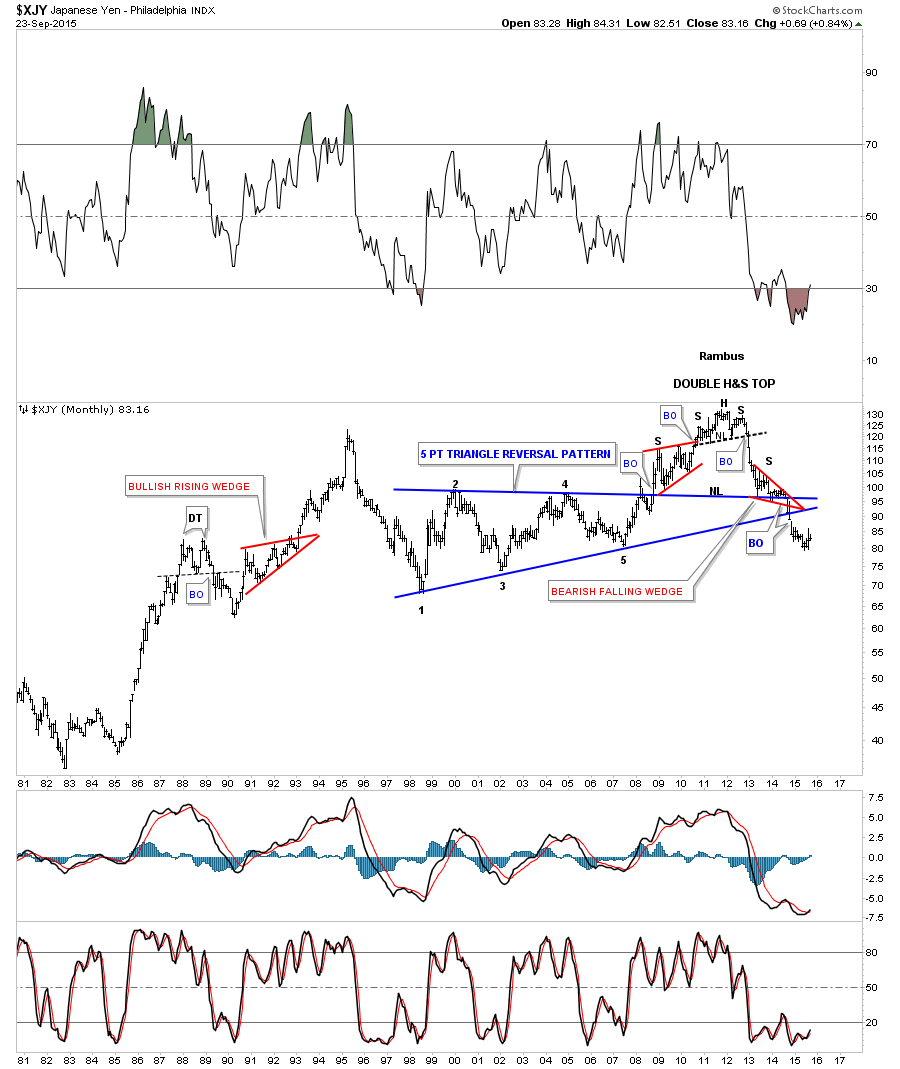
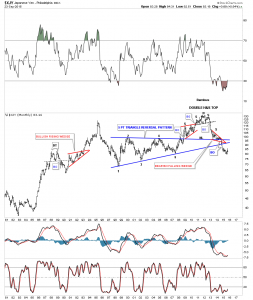
Lets look at one last important currency the $XJY, Japaneses yen. This long term monthly chart shows some nice Chartology. Note the H&S top that ended the yens bull market. The two smaller red consolidation patterns are forming the left and right shoulder of a much bigger H&S top. The little red bearish falling wedge led to an end around move of the apex of the large blue multi year triangle which is bearish.
The shape of most of the important currencies of the world are looking rather negative. Keep in mind these are long term charts so changes don’t come overnight. These charts above also tells us the story of the deflationary event that has gripped the worlds economies. Until these currencies find a bottom and the US dollar finds a long term top there is little hope that inflation will rise up to save the day.
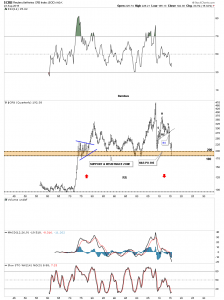
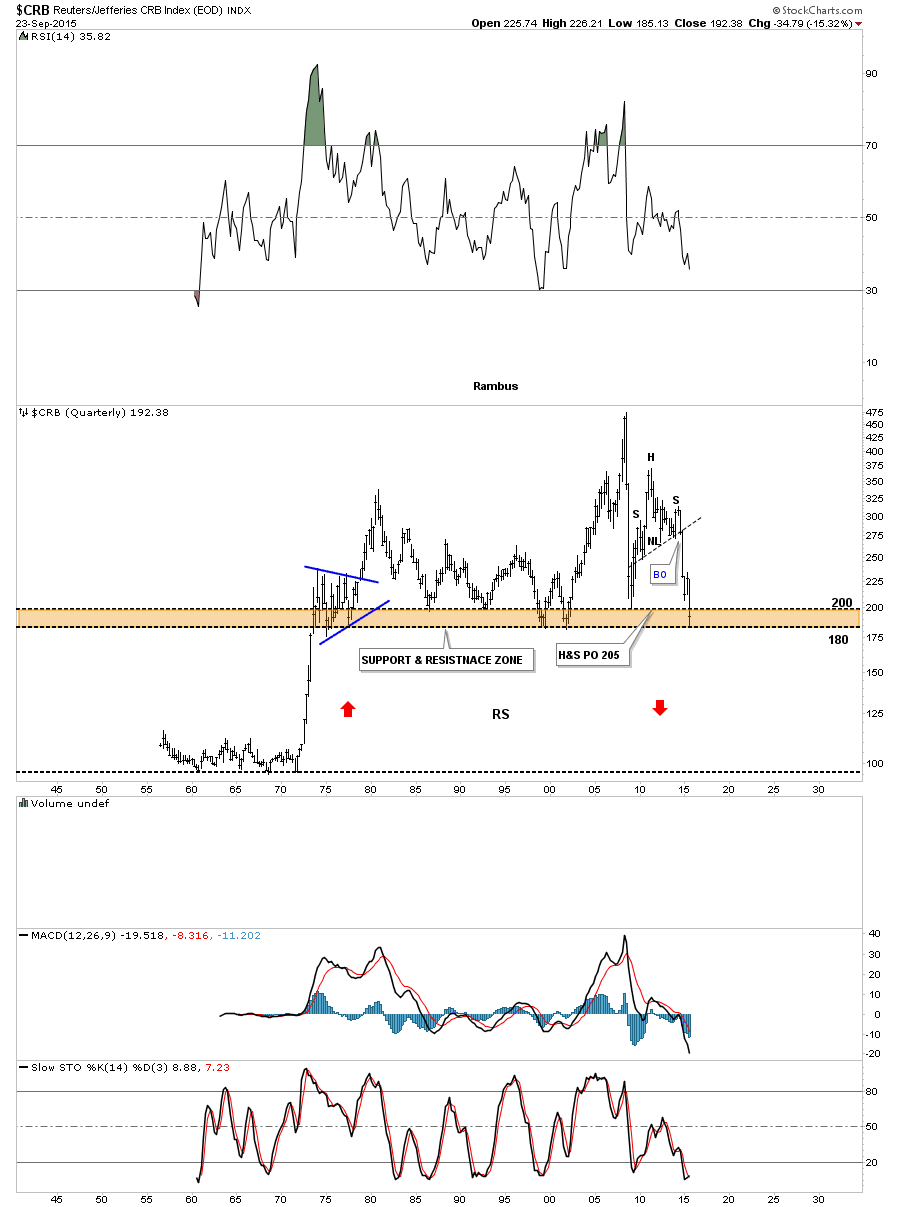
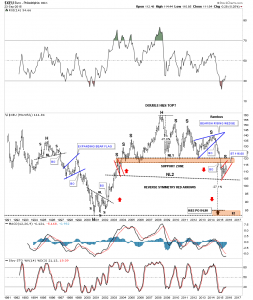
I would like to show you a 60 year quarterly chart for the CRB index that I’ve shown you several times before but it’s worth bring up again. We’ve been looking at some currencies that are showing some reverse symmetry. This quarterly chart for the CRB index is sitting right on a knifes edge as it’s testing the brown shaded Support and Resistance zone that goes all the way back to the early 1970’s. As you can see it got the initial bounce off of the bottom of the brown shaded S&R zone. This is one of those WHAT IF charts. What if the CRB index breaks below the brown shaded S&R zone. As you can see there was a vertical rally that happens back in the mid 1970’s that never paused to form an important consolidation pattern. That is the type of rally that reverse symmetry works the best in. Is it possible that the CRB index is going to crash all the way down to the mid 1970’s low to end this deflationary event that has been going on since the top in 2011? A break of the brown shaded S&R zone would leave all the price action above it as a massive top. All I can say is stay tuned as the next leg down may not be too far off. All the best…Rambus