This content is for Yearly and Monthly members only.
Subscribe
Subscribe
Already a member? Log in here

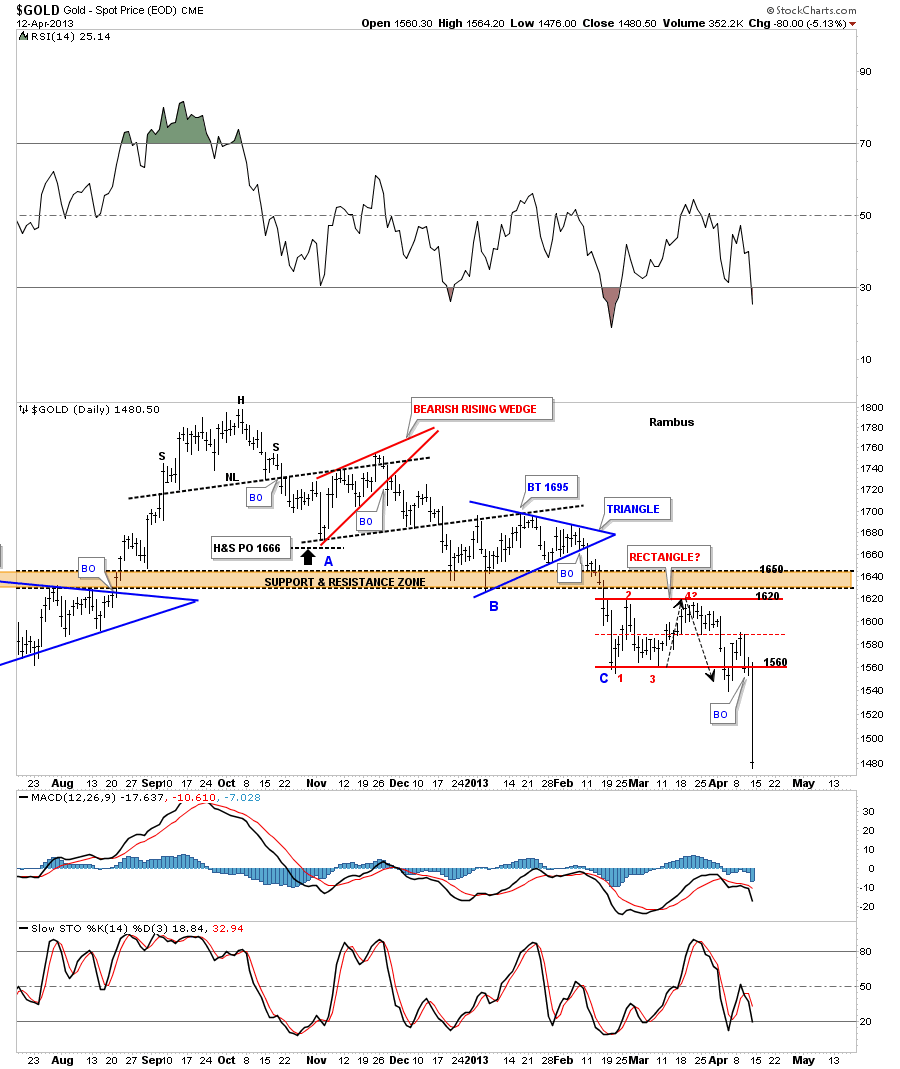
With today’s breakout of the huge 20 month rectangle for gold, tonight would be a good time to take another look, and see what has led up to this important breakout. This first chart is one I posted at the beginning of March when gold was trading at point #3. I put those black arrows on this chart to show you where I thought we should at least get one more reversal up to point #4? that was just below the brown shaded support and resistance zone. Some of you may remember this chart when I was looking for the 1620 area for a possible 4th reversal point. Sometimes the last reversal point in a rectangle will hit the middle of the rectangle before the actual breakout begins, red horizontal trendline As you can see this was the case this week.
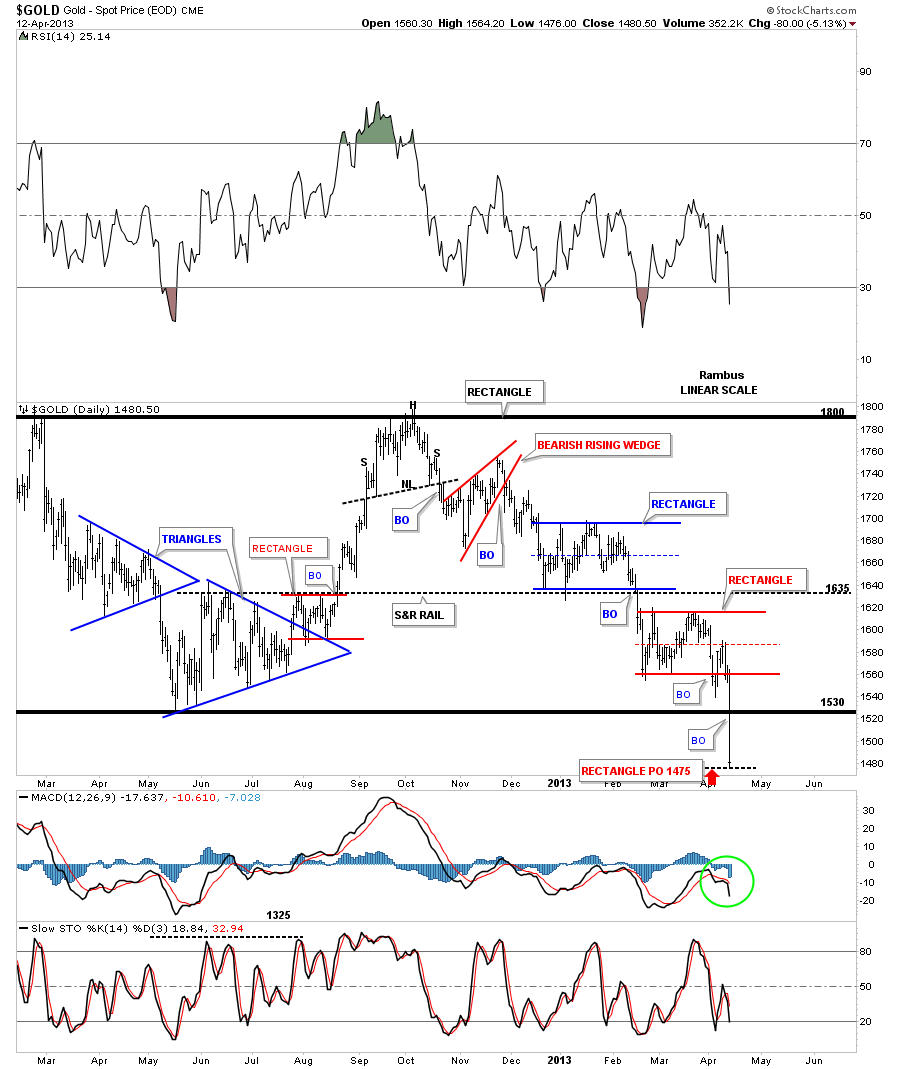
This next chart is a longer term daily look that shows all the consolidation patterns that have formed since the last high at 1800. Today’s price action shows a classic breakout of a major chart pattern, the 20 month rectangle. The red rectangle had a measured move down to 1475 which we hit today. That last red rectangle strongly suggested that the breakout of the big 20 month rectangle was going to happen because the price objective of the red rectangle was roughly 50 points below the bottom rail of the 20 month rectangle. It should not surprise you if we now get a backtest to the underside of the big rectangle at 1530 before the price moves lower. Possible but no guarantee.
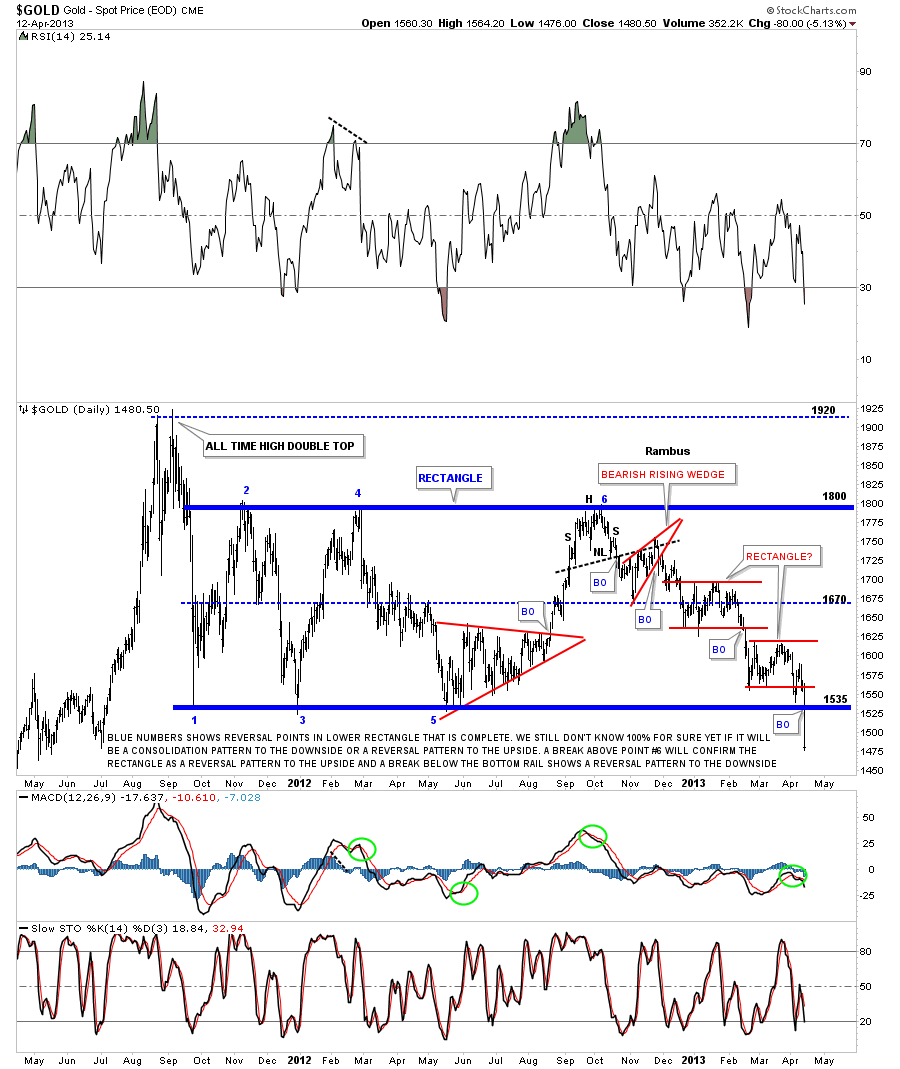
We finally got our answer to the question asked from the chart below.
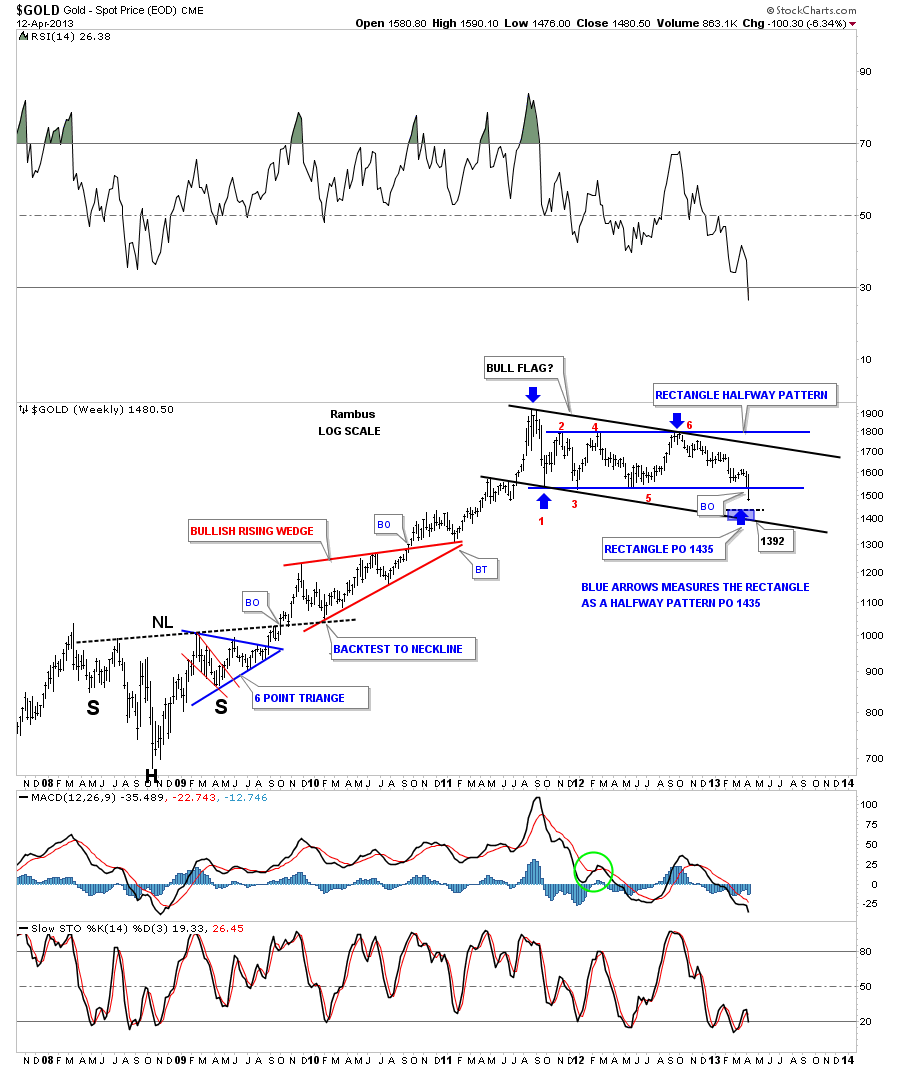
This last chart shows the best case scenario for gold. If the 20 month rectangle is a halfway pattern then the price objective would come in around the 1392 to 1435 area. This is just one scenario of several scenarios that are in the play book right now. Stay tuned as today marks a potential turning point for gold. All the best…Rambus
List of Countries who have subscribers at Rambus Chartology
(39)
Italy
USA
Canada
Japan
Sweden
France
Spain
Finland
Germany
Portugal
Belguim
Channel islands
Gibralter
United Kingdom
Swizerland
Denmark
Netherlands
India
Kuwait
Australia
Singapore
Hong Kong
Tiawan
South Africa
Malaysia
Malta
United Arab Emirates (Dubai)
Lebanon
New Zealand
Nigeria
Nicaragua
China
Mexico
Thailand
Columbia
Hungary
Israel
Brazil
Ukraine
Peru
….. Sir Fully
In this past Weekend Report,” Gold Bulls Do or Die”,
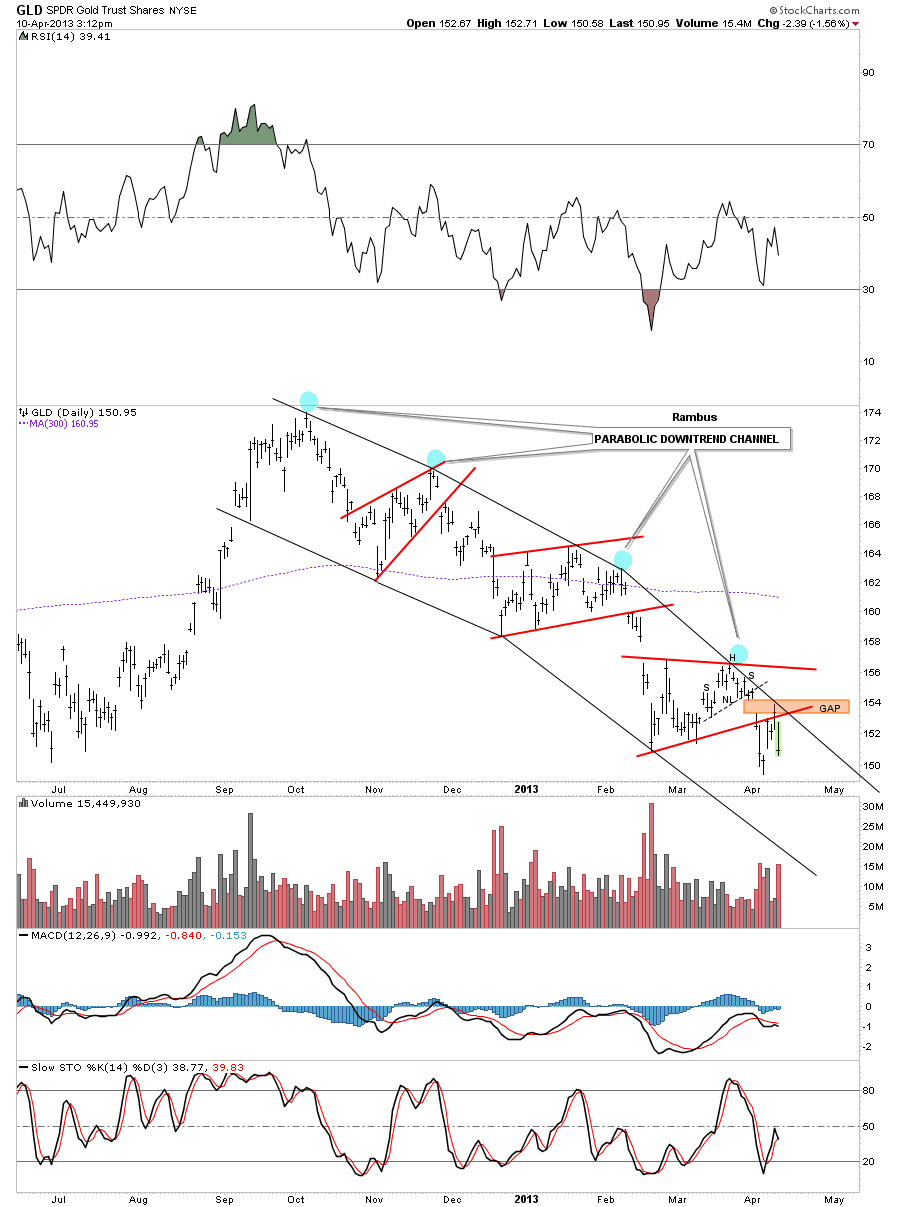
I showed a daily chart for the GLD that showed a parabolic downtrend forming. That was the first time I posted that chart. GLD was in the process of backtesting the triangle that had been forming since the end of February. The backtest was a little strong, which happens sometimes, but with the brown shaded gap area and the latest rail of the parabolic downtrend channel, just above the bottom rail of the triangle, I thought there was a good chance that the GLD would fill the gap and touch the new downtrend rail one last time before the GLD started the next impulse leg down. Below is the undated chart for the GLD that shows yesterday’s price action did in fact trade slightly above the bottom red rail of the triangle, closing the gap and bouncing off the newest rail of the parabolic downtrend channel. I can guarantee you won’t find a chart like that anywhere on the planet just here at Rambus Chartology.
“Sir starr posted an article on the Chartology Forum, “Comex Gold Inventories Collapsed by the Largest Amount Ever on Record.”
Since I began trading the bull market in the precious metals complex, in the spring of 2002, I can’t even begin to count how many articles have been written on why its time to back up the truck because of this reason or that reason. There is no doubt that the precious metals, not so much the pm stocks, have been the best place in which to be invested for the last 12 years or so. Last October (2012) there was a paradigm shift from the precious metals stocks to the stock markets, as I have shown you. Most of these types of articles are written by analysts that will never tell you to sell. All they do is tell you why you must buy and buy right now or you will get left behind and lose a fortune. They are good at what they write and very convincing which is why so many goldbugs are still hanging on to their losing positions right now. You think you felt some pain today. What if you have been riding this decline all the way down from the October highs because some analysis told you the precious metals stocks were going to the moon because of the strong fundamentals. Instead of a moon shot most of the goldbugs have had a trip to hell looking for someone to blame because THEY said the fundamentals were so strong that the precious metals stocks couldn’t go down. If you follow the price action you don’t have to worry about what this analyst or that goldbug guru has to say. You will be able to look right through their bull crap and decide for yourself which is the best way to go.”
Rambus March 9 2013