This content is for Yearly and Monthly members only.
Subscribe
Subscribe
Already a member? Log in here

I had intended to post part III of my interest rate series, however market conditions dictate that I post views on the current market. This market is now communicating that it is at high risk. For two months now, I have been advocating a strategic retreat. Head for the sidelines and watch the action with an unemotional detachment. The market is now sounding the alarm and one should be on high alert for a downside acceleration.
Plunger’s Bullet Points
Here are the main points I have presented over the past few weeks:
The largest financial bubble in history is concluding and one should prepare his bomb shelter and know how to protect oneself.
Supreme Complacency
I am standing on a mountain top and shouting-REDUCE YOUR RISK
Am I calling for a crash? – No, I am not, however conditions exist which would allow a crash to happen. We are now 2 months after the highs put in by the major indexes world wide. This is the timeframe that crashes have traditionally occurred. 1929 and 1987 are classic examples. Complacency reigns supreme as dip buyers are getting lathered up for another romp to the upside. Don’t believe me? Check out this Charles Schwab email I received in my inbox and don’t miss the name of it:
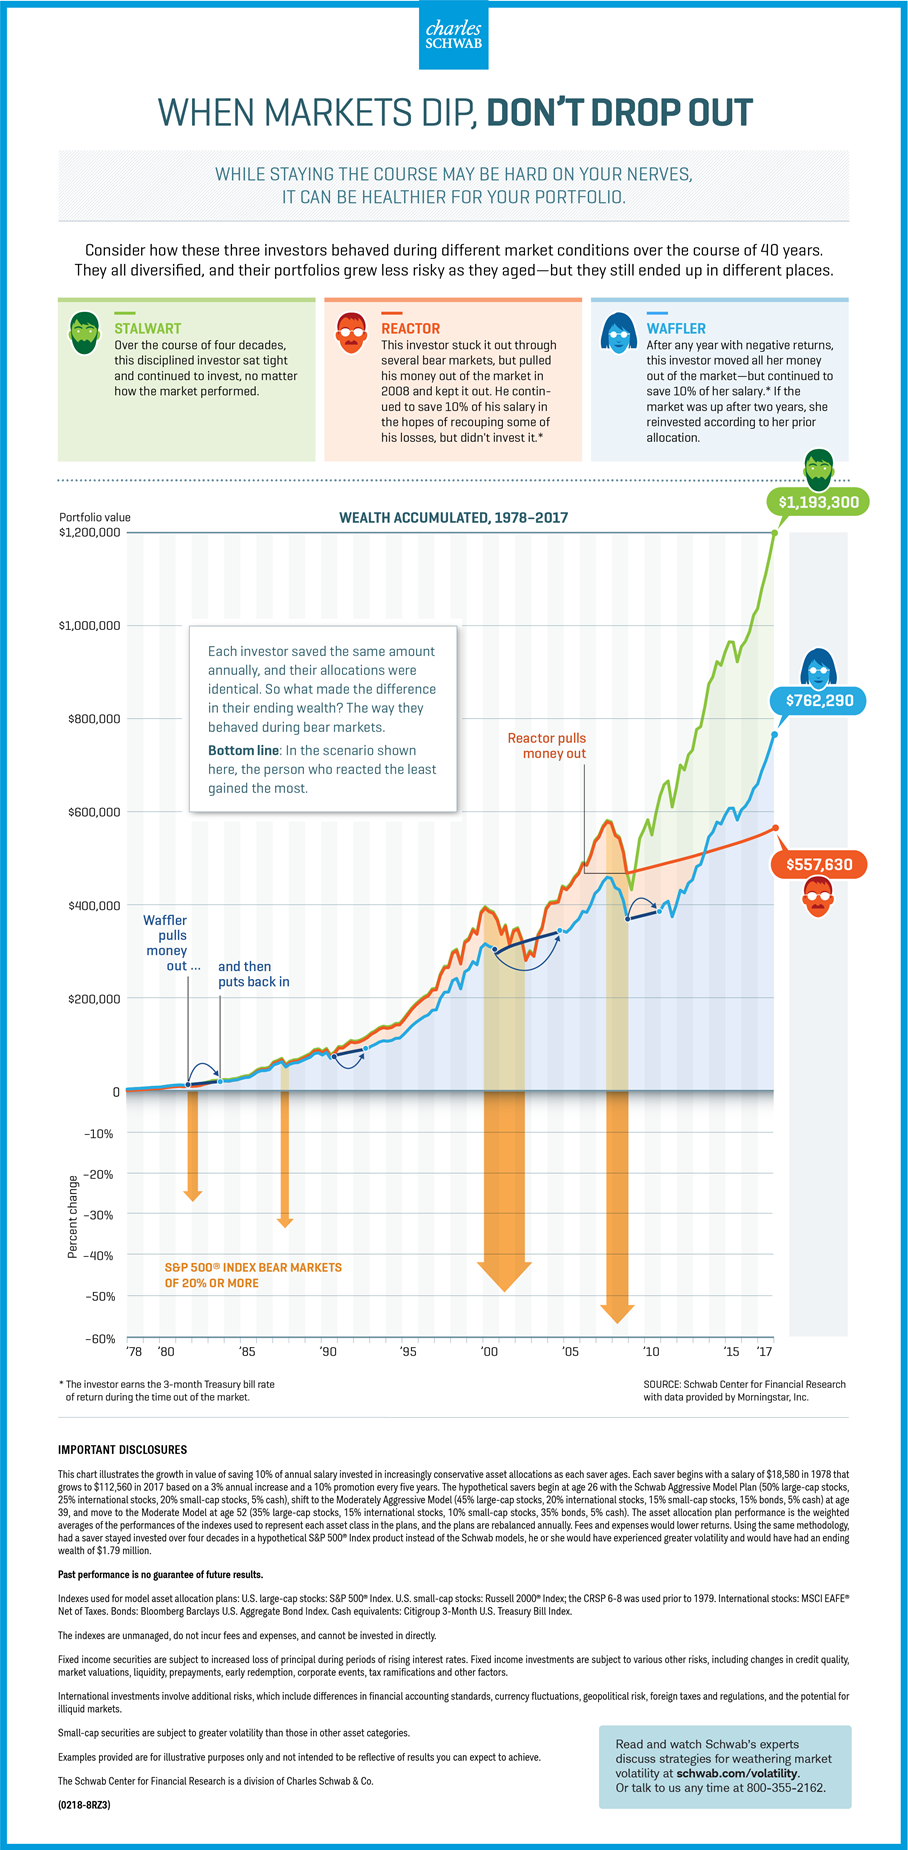
Bullish Investors typically continue buying one third of the way into a bear market, up until the point of recognition. After this point the pain becomes too great and they then retreat.
The arrogance and cluelessness of both the average investor and the financial establishment astounds me. Take the FED, they think they can create $4.5 T of QE and then simply yank $1.8 T of it right out of the market while simultaneously increasing government borrowing by $1.2 T/year, all while threatening the largest buyer of T-Bonds with a trade war! So after years of QE they think they can just turn the dial the other way and reverse it… astounding. Problem is, it doesn’t work that way.
This historic giant bubble is in the process of bursting- it’s now just a matter of time.
But enough of what Plunger has to say, let’s turn our eyes towards the market and listen to its message. You know the line: I report…you decide:
First we will look at the big picture according to Dow Theory, then individual market leadership to include the FANGS and the FAB 4 then we will update our tour around the world. Hang on as its going to be a wild ride…
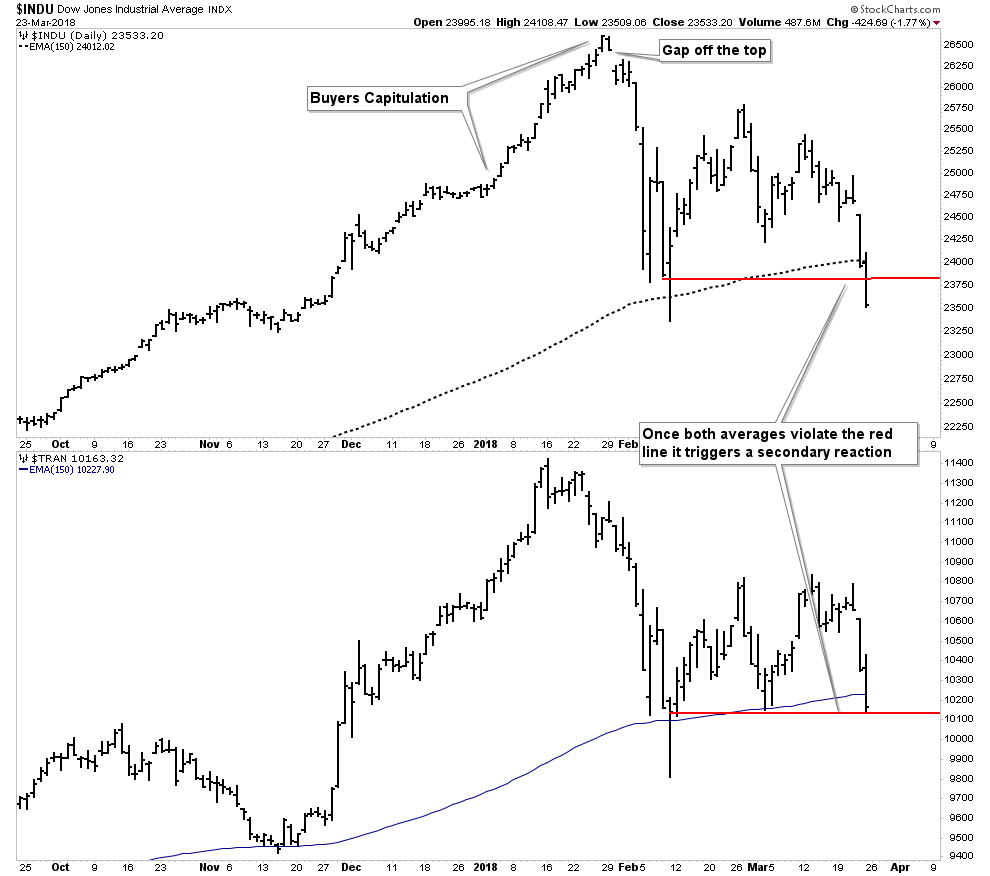
DOW Theory Update
Friday’s action was huge as we now are poised to trigger a secondary reaction in the senior index. I have gone back and reviewed the works of the great DOW theorists and conclude that we will use closing prices, not intraday extremes to determine market action. Therefore the DOW has now violated its February lows and the Transports sit right at the lows. One more closing down day in the transports triggers a SR classification:
Next we see a line chart with intraday prices:
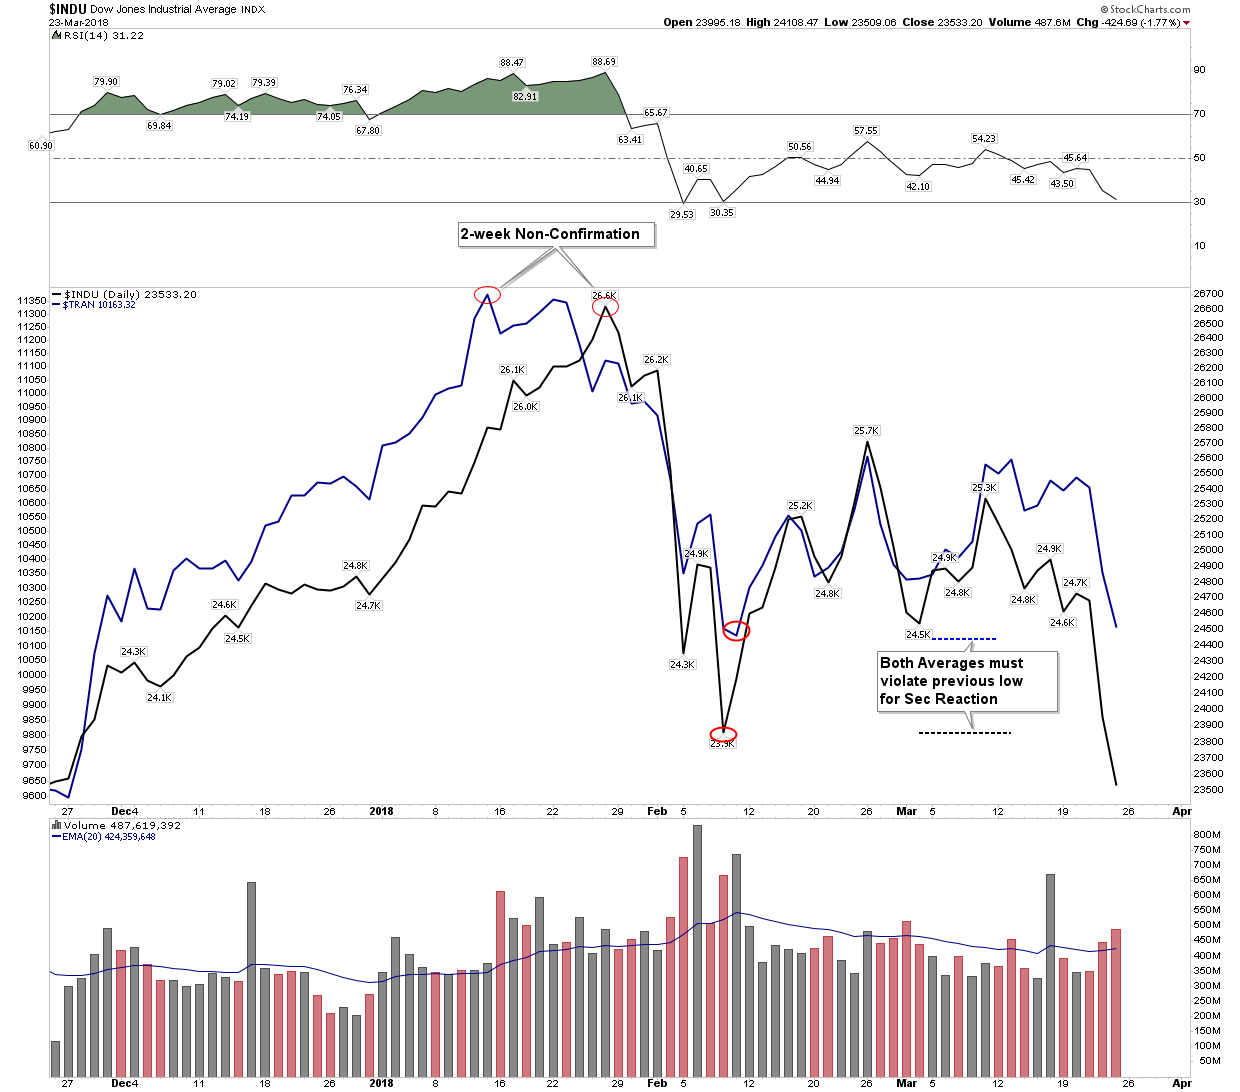
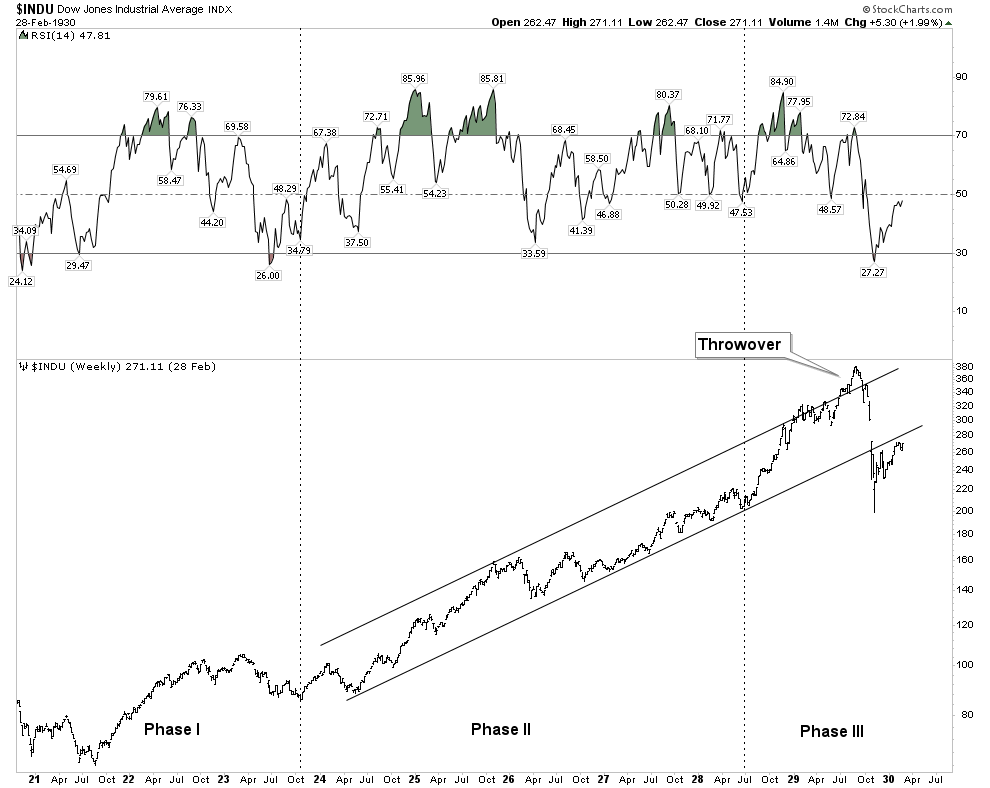
The significance here is in the volume. Note down days are on elevated volume. I have posted numerous times the 10 year chart of decreasing volume throughout this bull market and compared it to the 1932-1937 analog. It is the only bull market that resembles what we have seen from 2009-2018. The 1937 bull market ended with a 50% decline in 12 months.
Now here is the shocker… The throw over top has now broken down into the channel. This is very bearish action judging from past historical outcomes. Don’t forget to review that declining volume! :
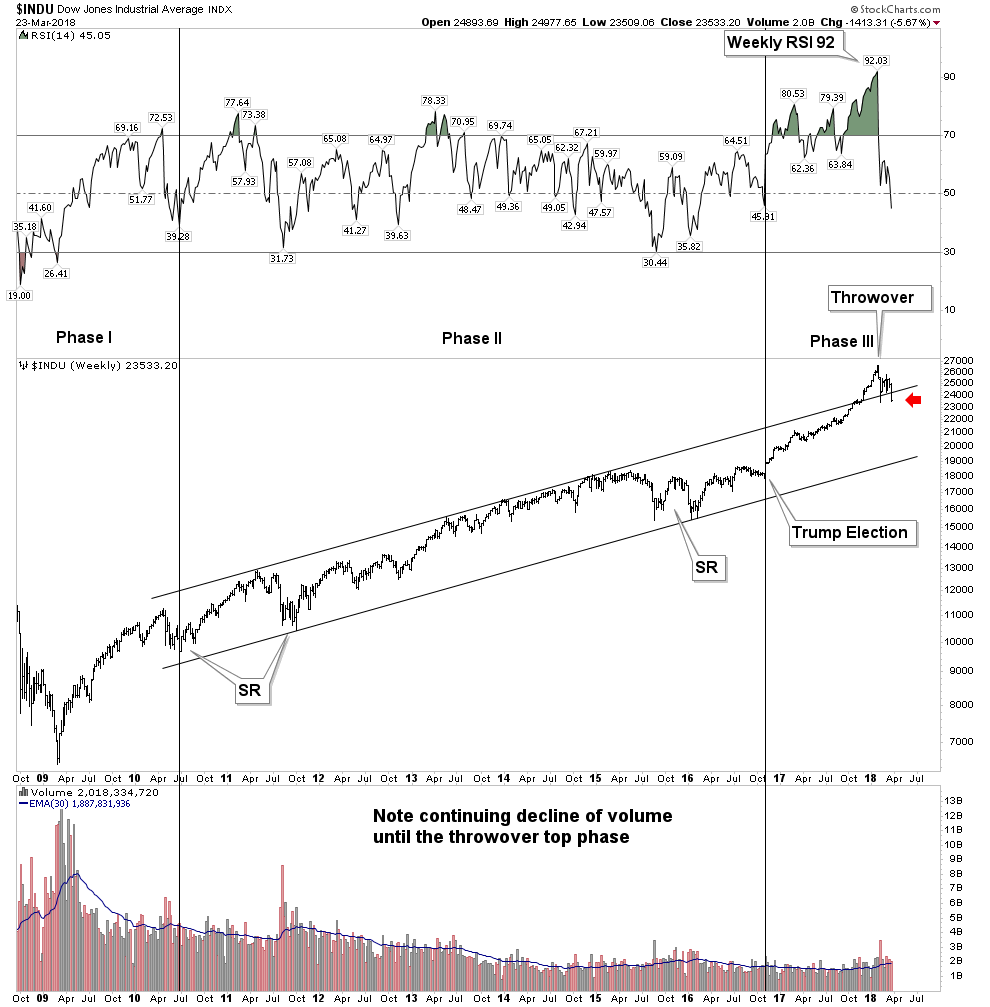
Do I need to remind you of the risk here? Check out what happened in a prior occasion:
The FANGS
Moving on let’s look at everybody’s “I wish I had bought” stocks. First let’s look at Facebook. There will be a special private place in hell reserved for this company and its founder. This company is becoming the poster boy for corporate abuse of its customers. Just check out what Zuck thinks of his subscribers:
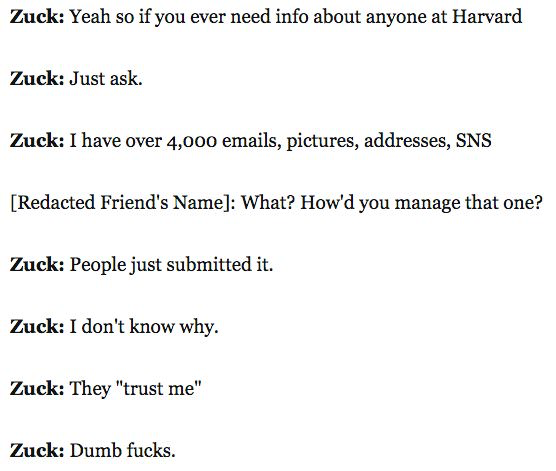
One should be asking themselves in light of recent revelations why would one knowingly volunteer to place oneself into an intelligence gathering operation on oneself?
Plungers recommendation: Cancel your Facebook account if you haven’t done so already. Then short the stock!
Daily chart… keep in mind this has been a market leader for the bull market:
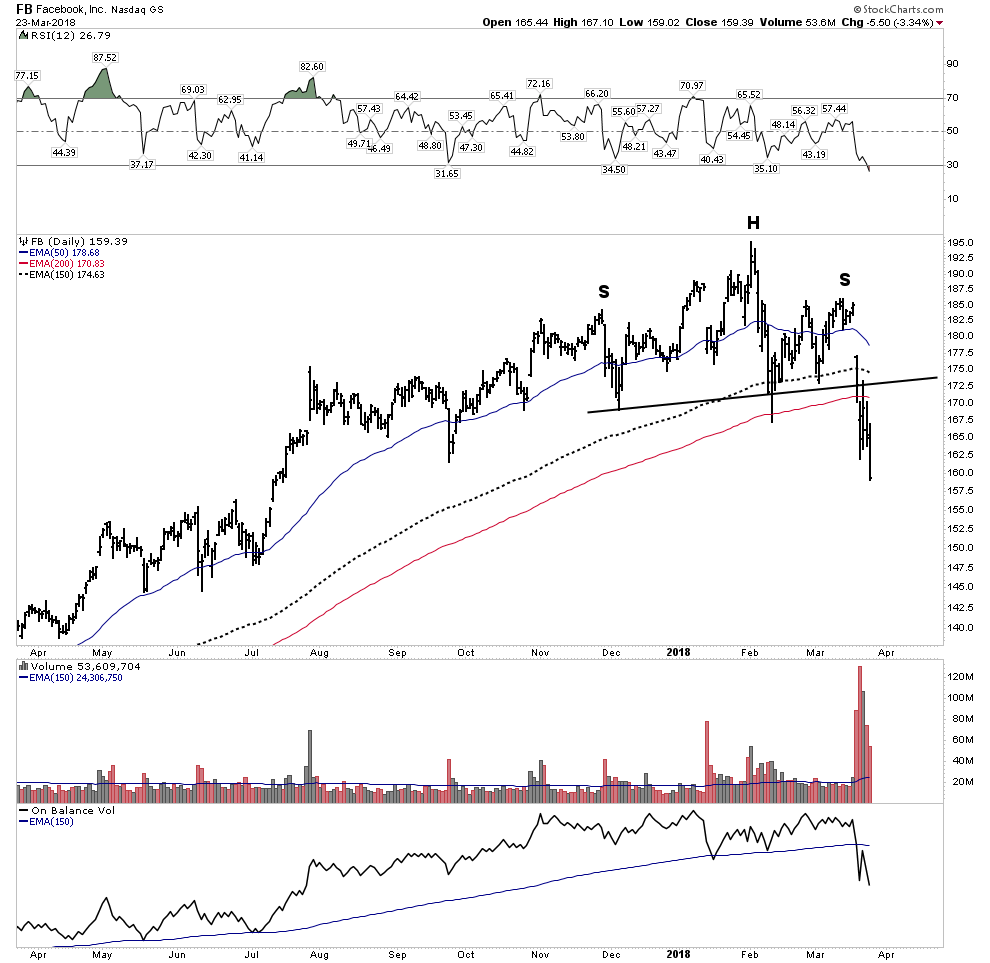
And its not over yet:
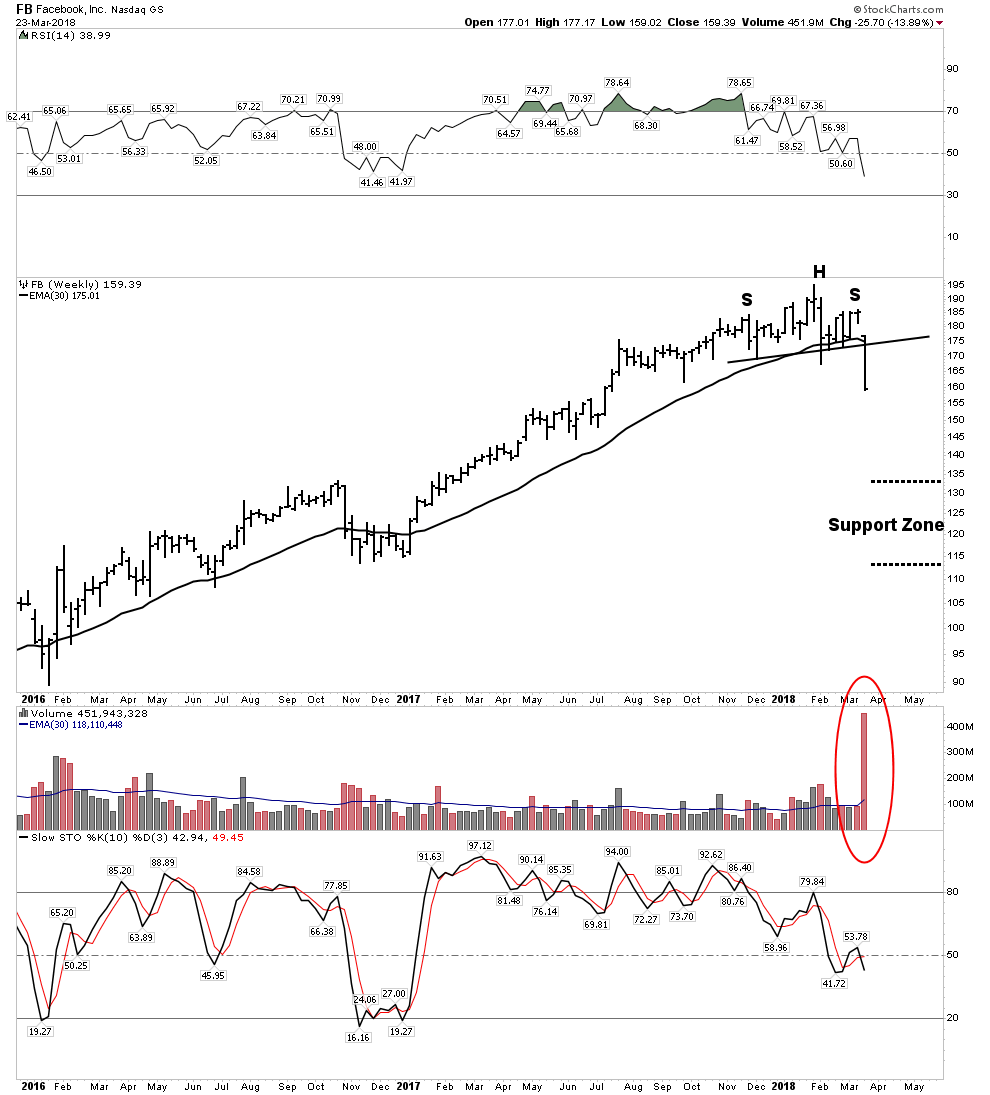
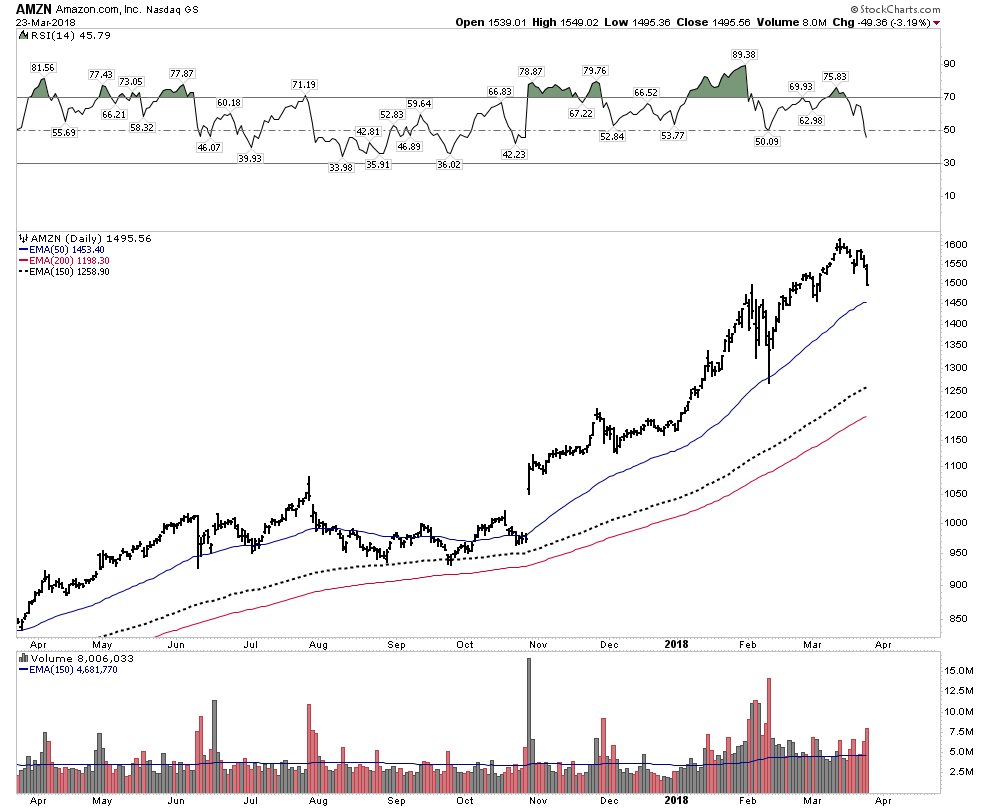
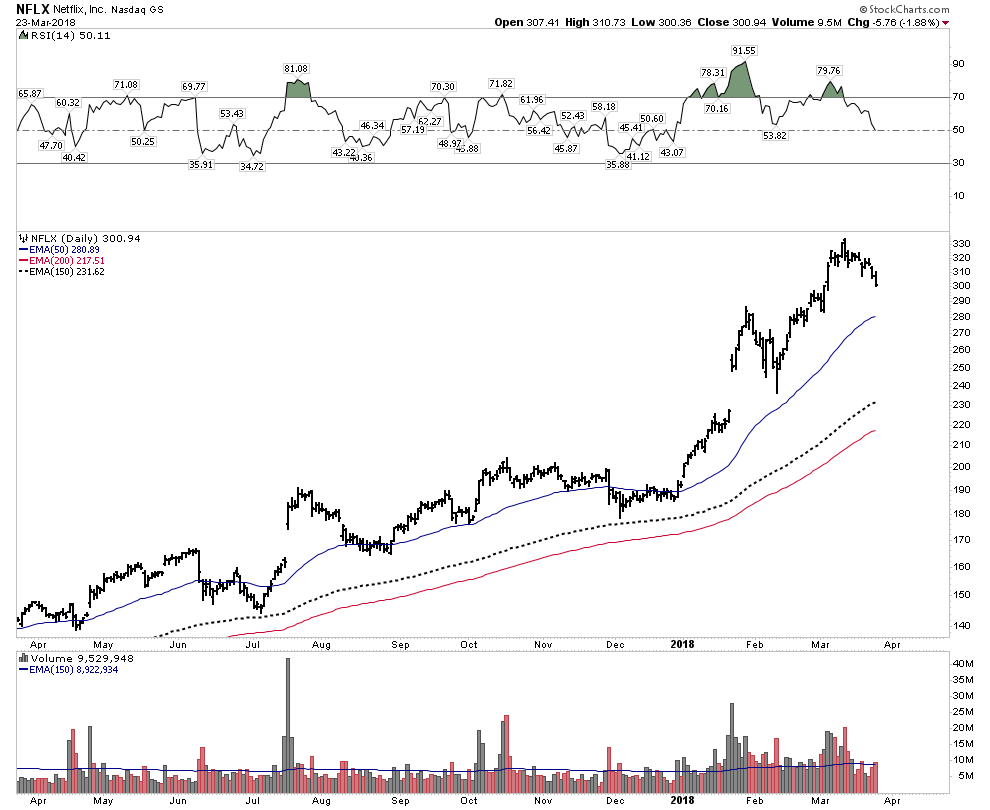
AMZN NFLX GOOG I haven’t marked up these charts, but I leave it up to you to draw conclusions. I would be out of them even though AMZN and NFLX have not broken down yet:

The Fab Four- The generals of the market
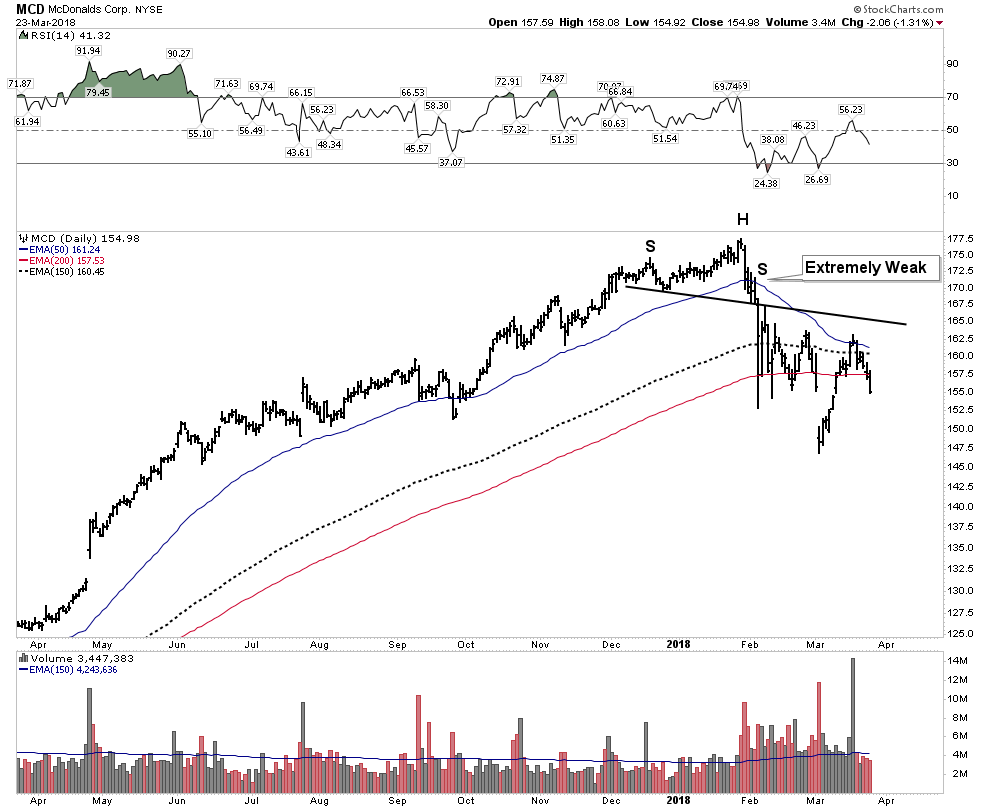
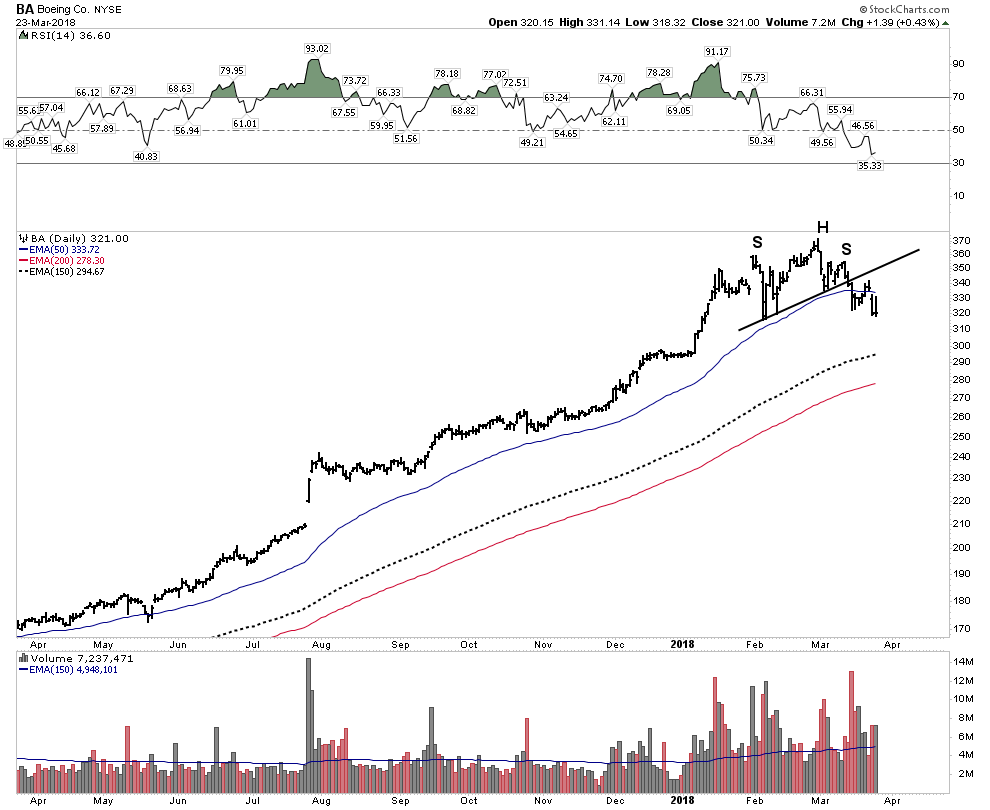
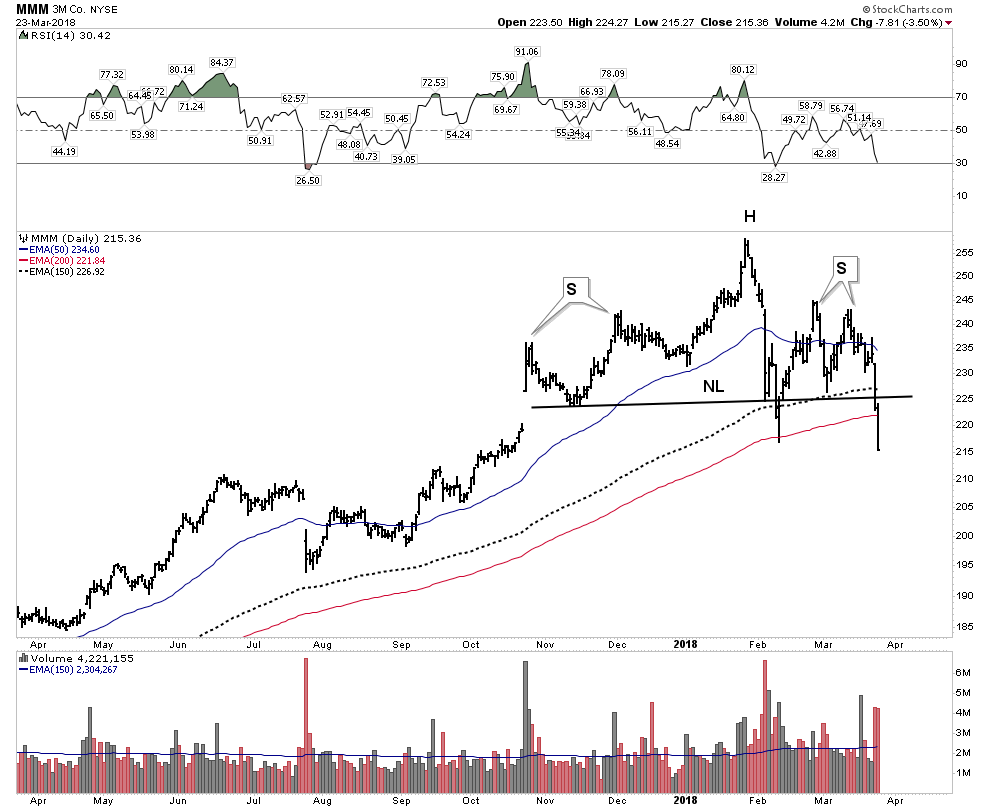
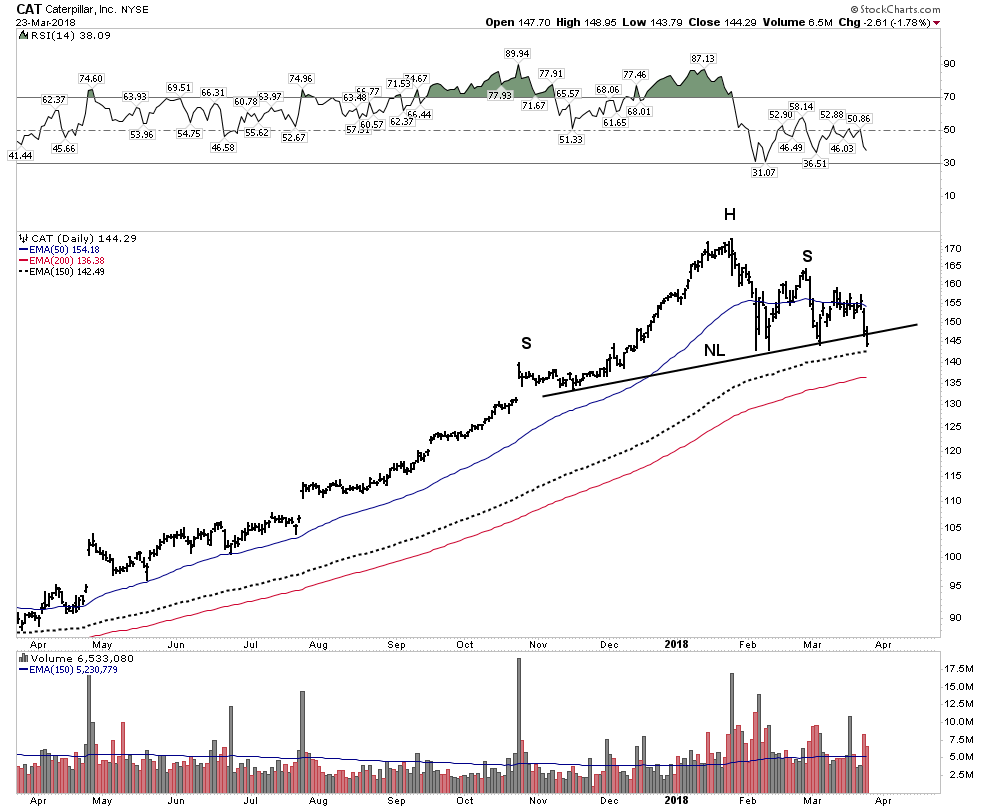
Over the past year the Fab Four (MCD, BA, MMM, CAT) have led the market higher and powered its advance. Every market needs its generals and they were it. Note how these 4 generals are all in the process of breaking down. Once the market broke in early February and the bounce began these stocks should have resumed their advance to a new high due to the flow of money resuming back into them. The fact that this has not happened tells one the market has changed. Worse still they are now in full breakdown mode:
MCD
Boeing
MMM
CAT- Heartland Favorite
Financials
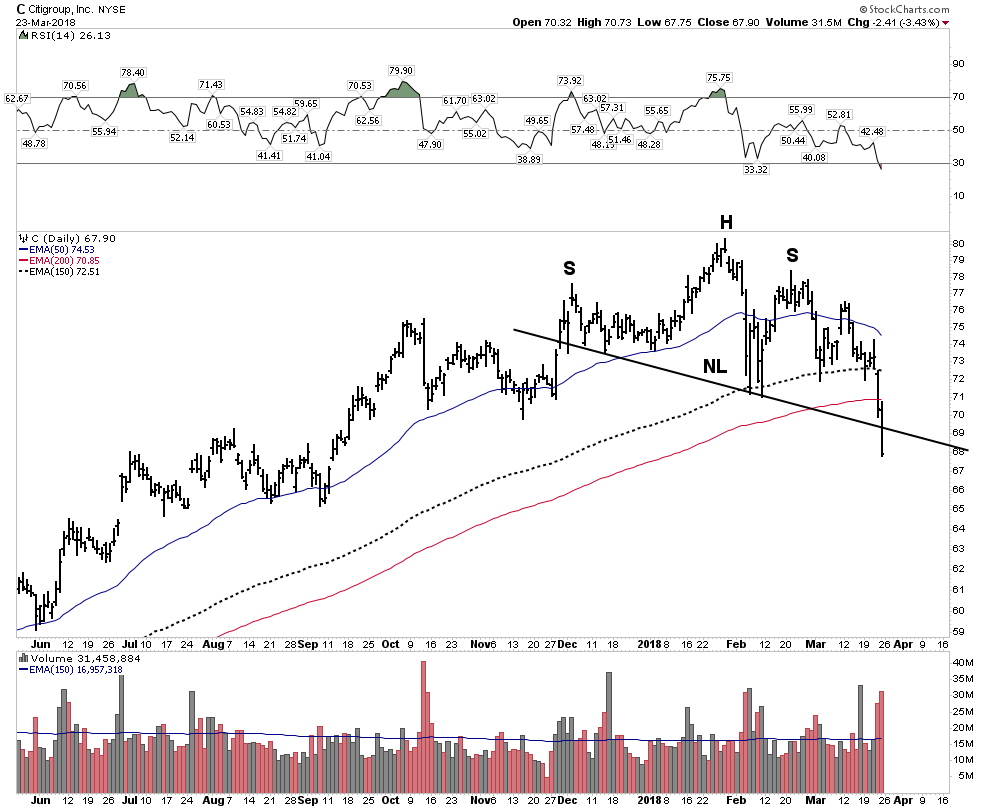
They say a bull market has to have a healthy financial sector. Let’s take a look at the ultimate money center Rockefeller bank:
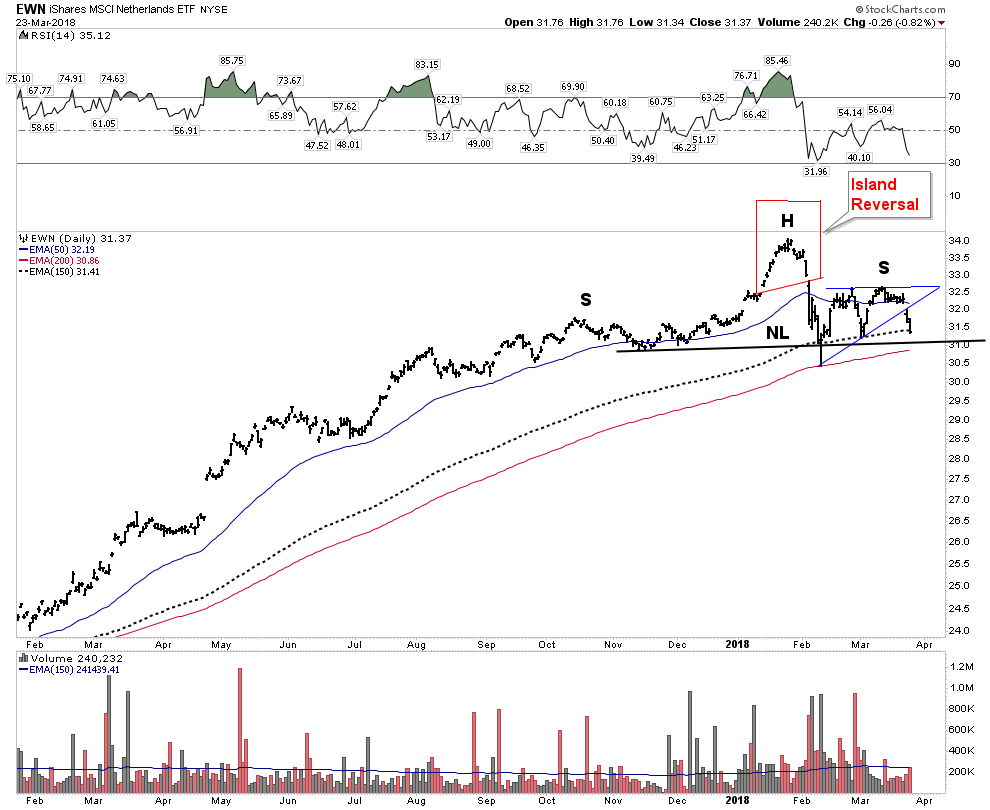
A Trip Around the World- Global markets imploding
In the following series of charts keep your eye trained on the following patters. Upside acceleration from December to January indicating buyers capitulation followed by upside exhaustion. Steeple tops resolving into Island reversals. And finally notice how contracting triangles have built out on the NL of the right shoulder.
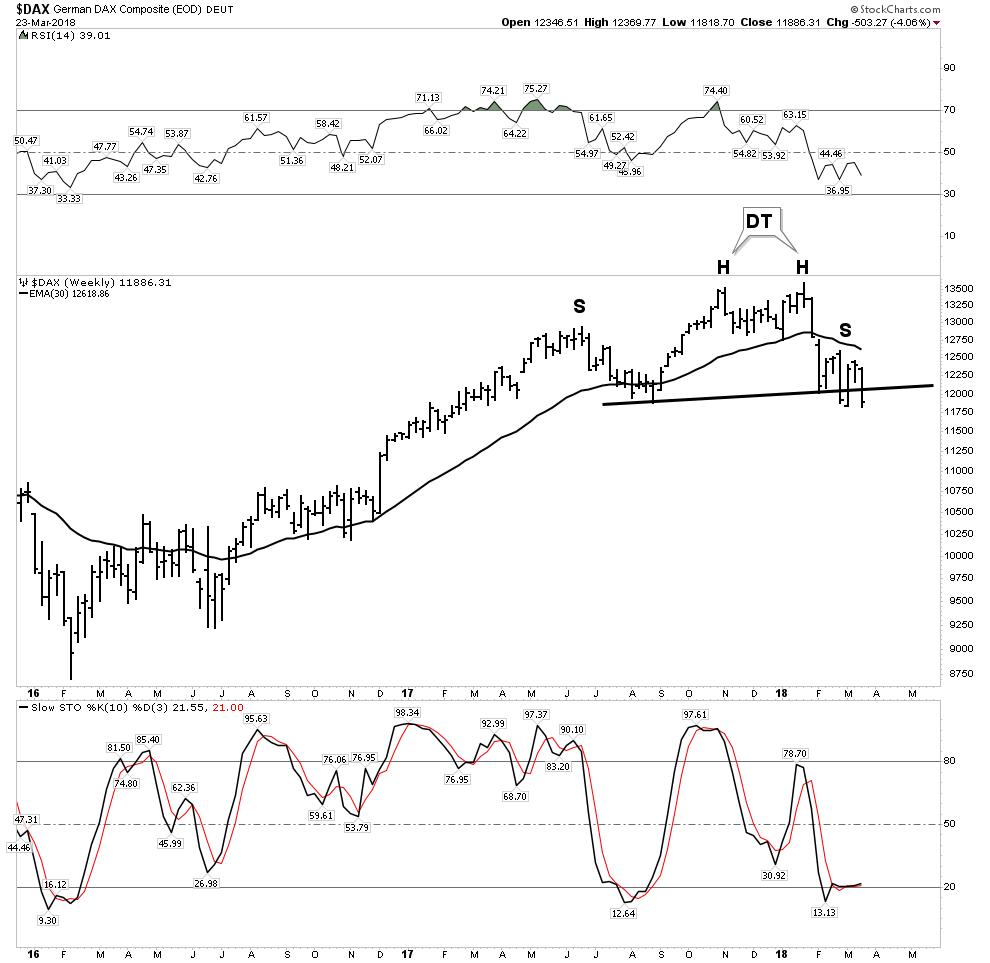
Germany
First off Germany wins hands down the most ugliest market chart. Don’t know why this has traced out such ugliness, but its there:
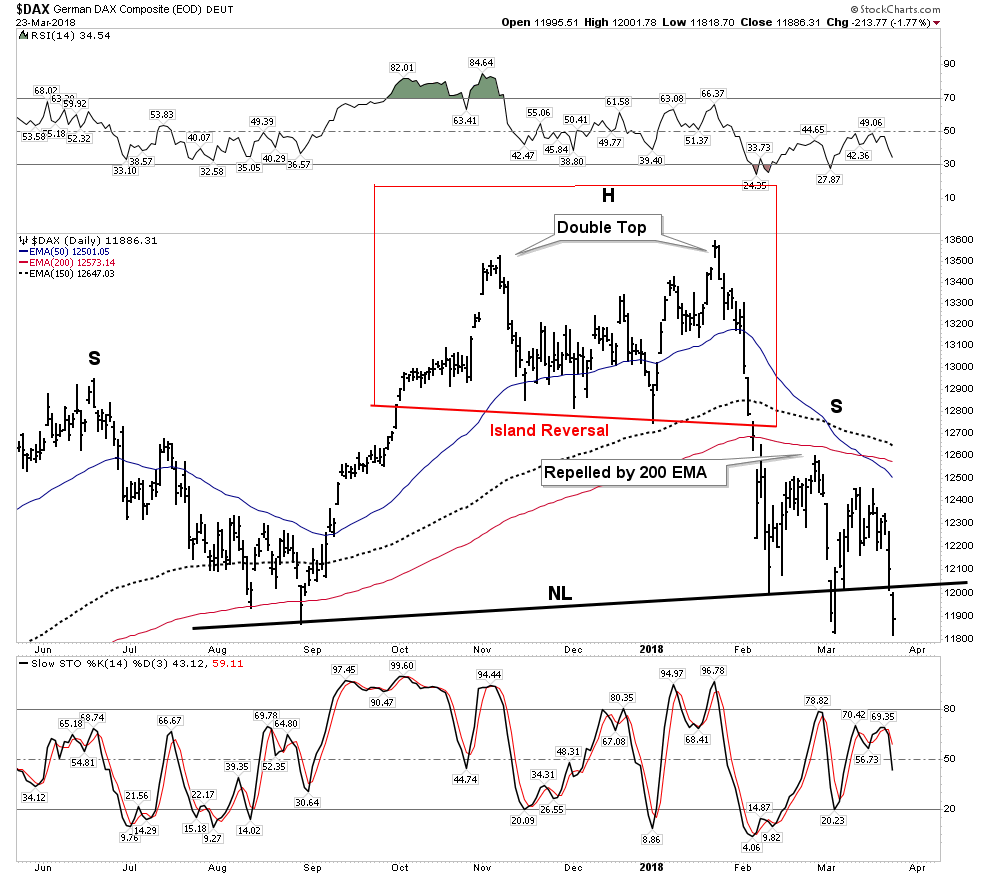
It’s got everything: Island reversal which left behind a massive zone of distribution and an army of trapped investors. A massive broad H&S top with urgency gaps slicing right on through the 150 & 200 EMA as if they were not even there. And now we have the break below the NL. The weekly below shows how stochastics have flatlined like a dead EKG.
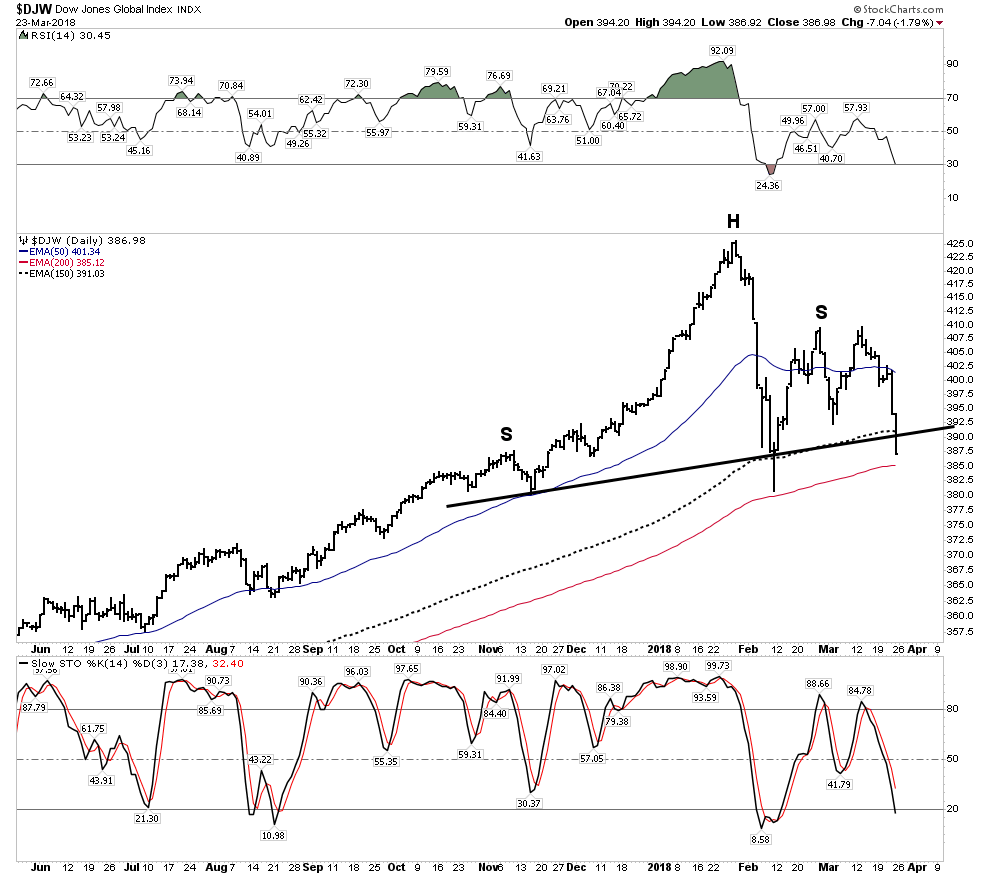
Global Indexes
Here is a look at all the world…gulp.
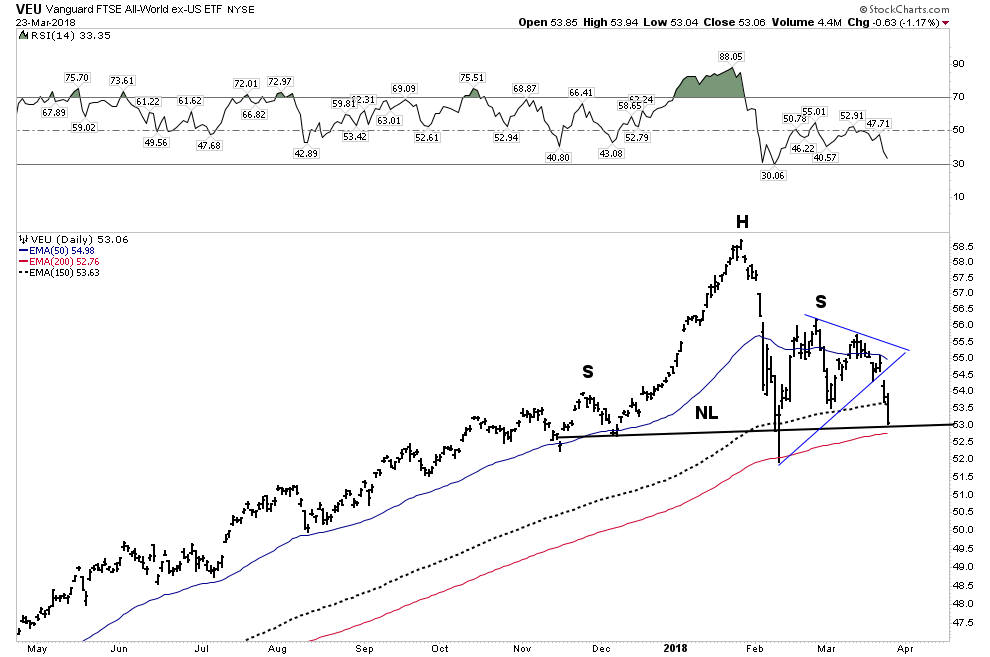
Here is Vanguard’s take of the world… note the buyers capitulation in the last 2 months leading into the top and the ensuing exhaustion:
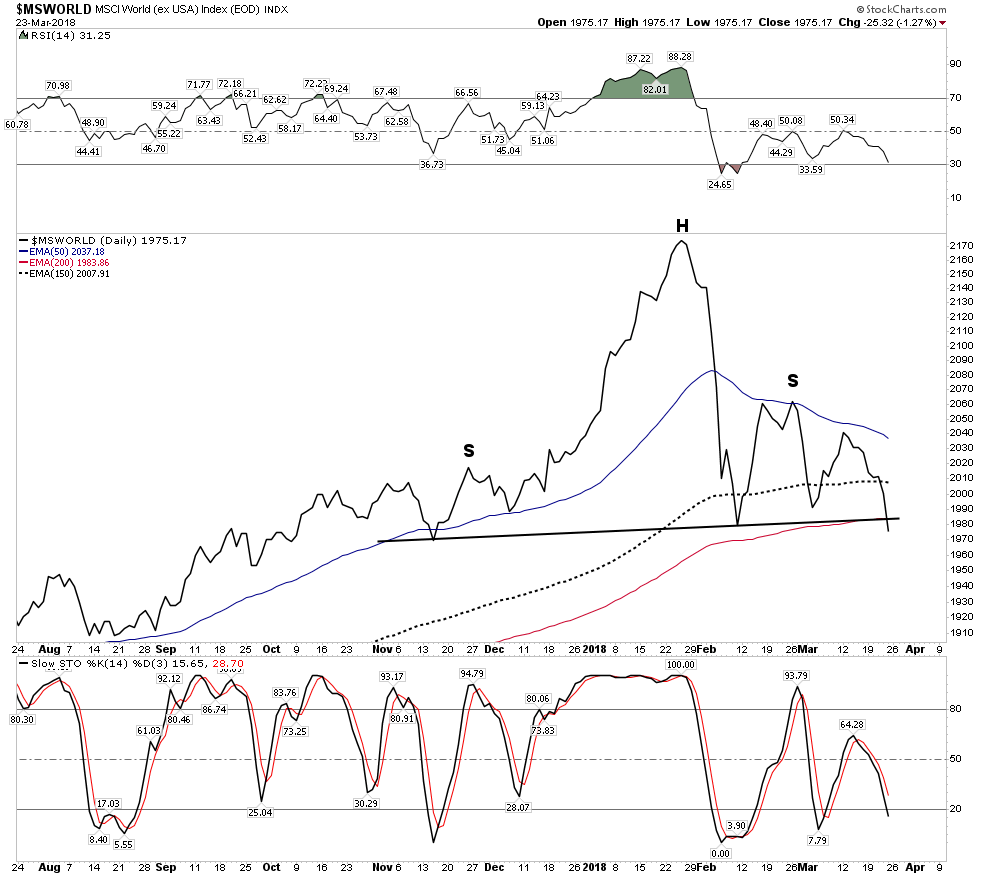
The world minus the USA: Whoops.
Europe
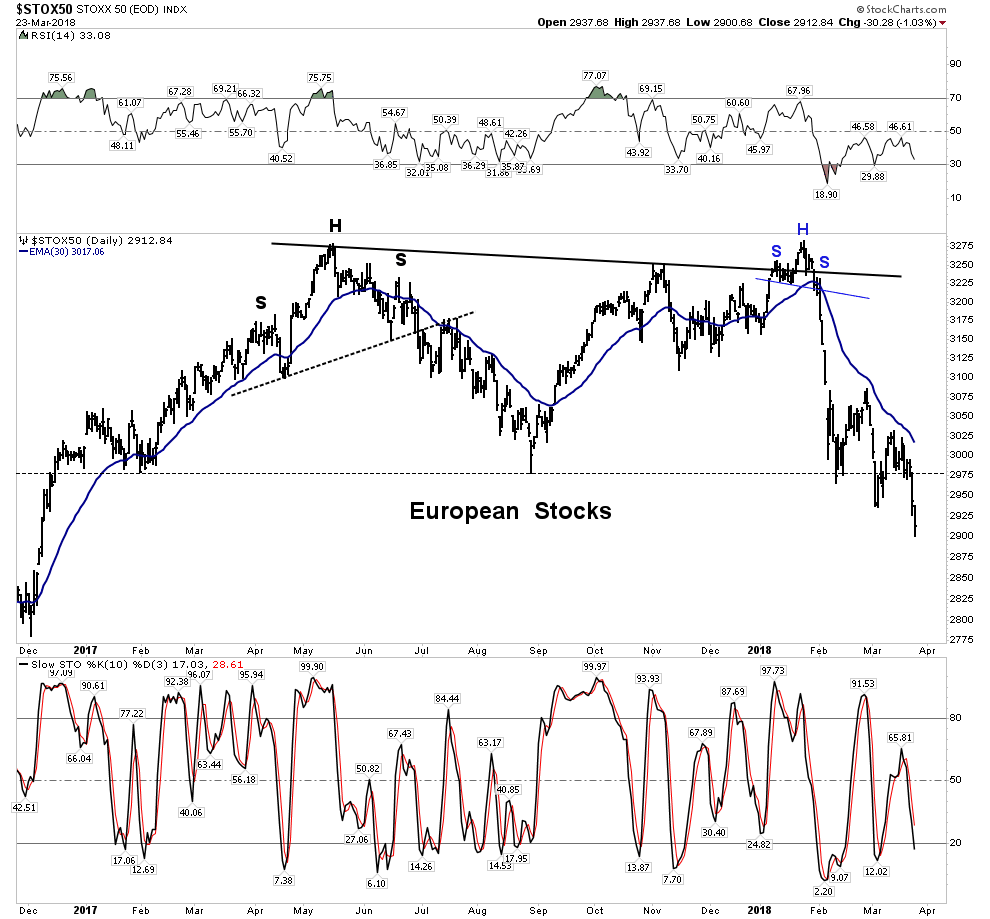
The above chart simply is a horror show. Double H&S Tops and now it has left behind a massive distribution topping range. Trapped Investors!
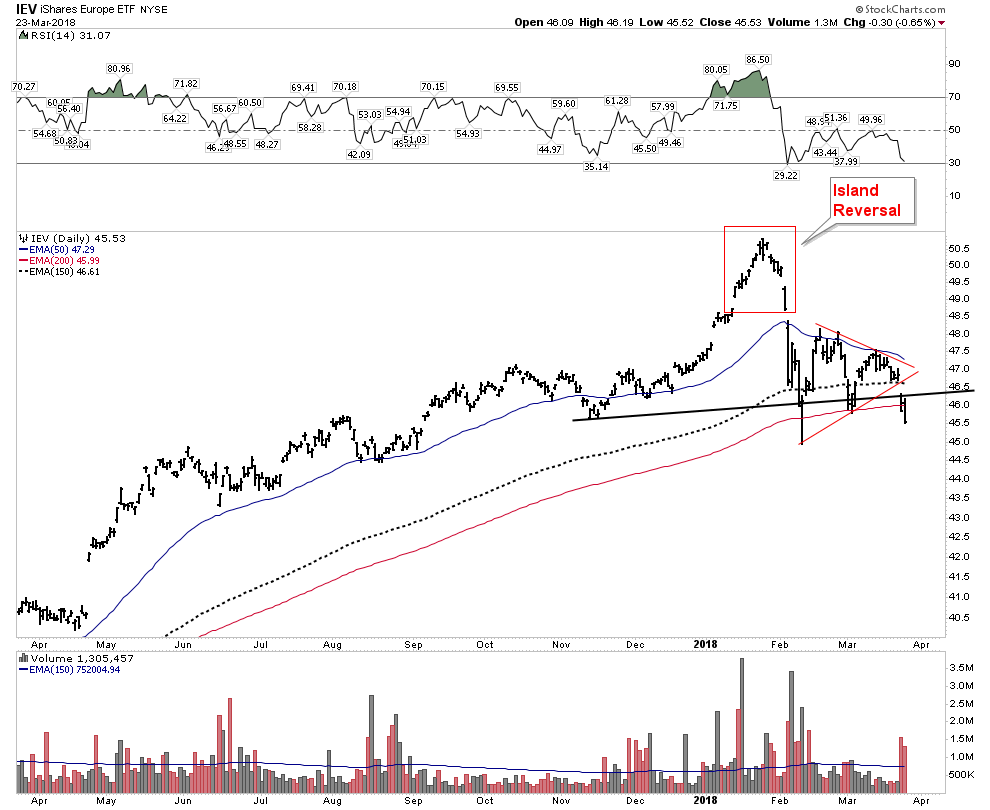
Another view of Europe-less focused on Big Caps:
London- A major international market
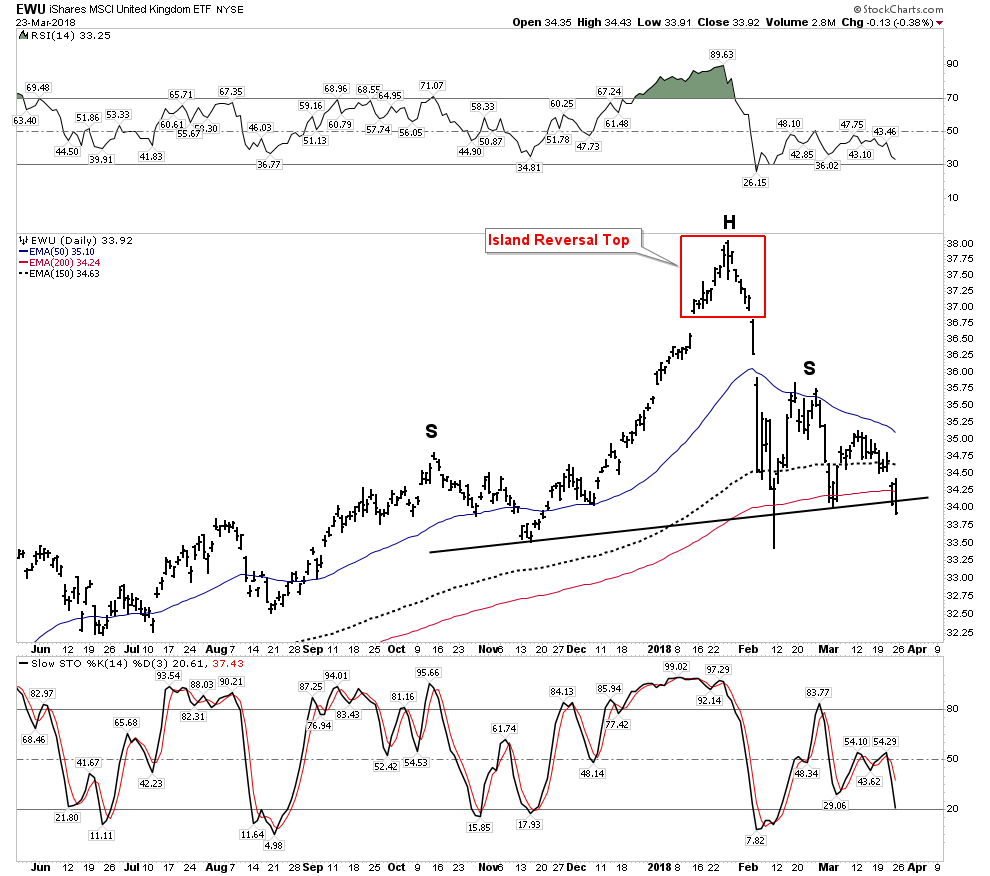
All the patterns are here and its now violated its NL…OMG.
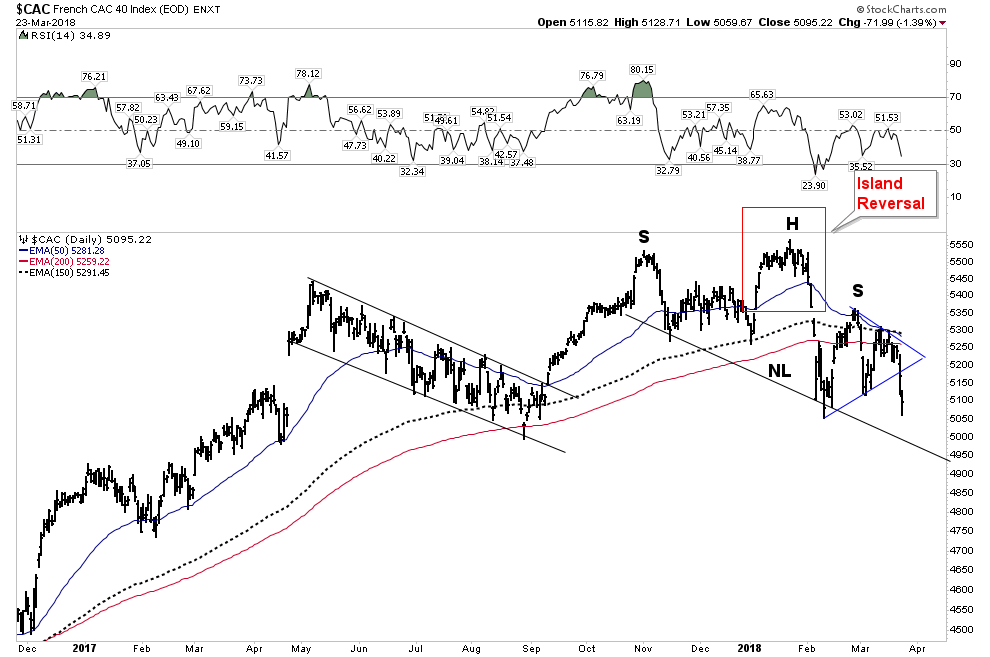
Paris…Ticking time bomb
AMS- Tick Tock…
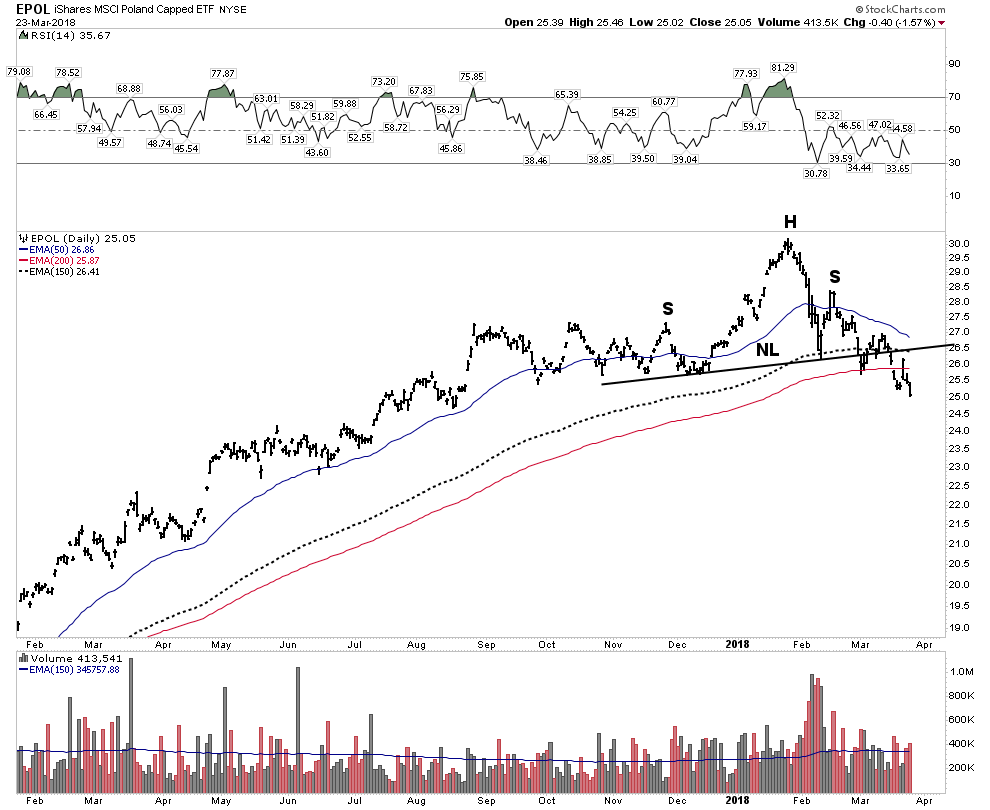
Warsaw
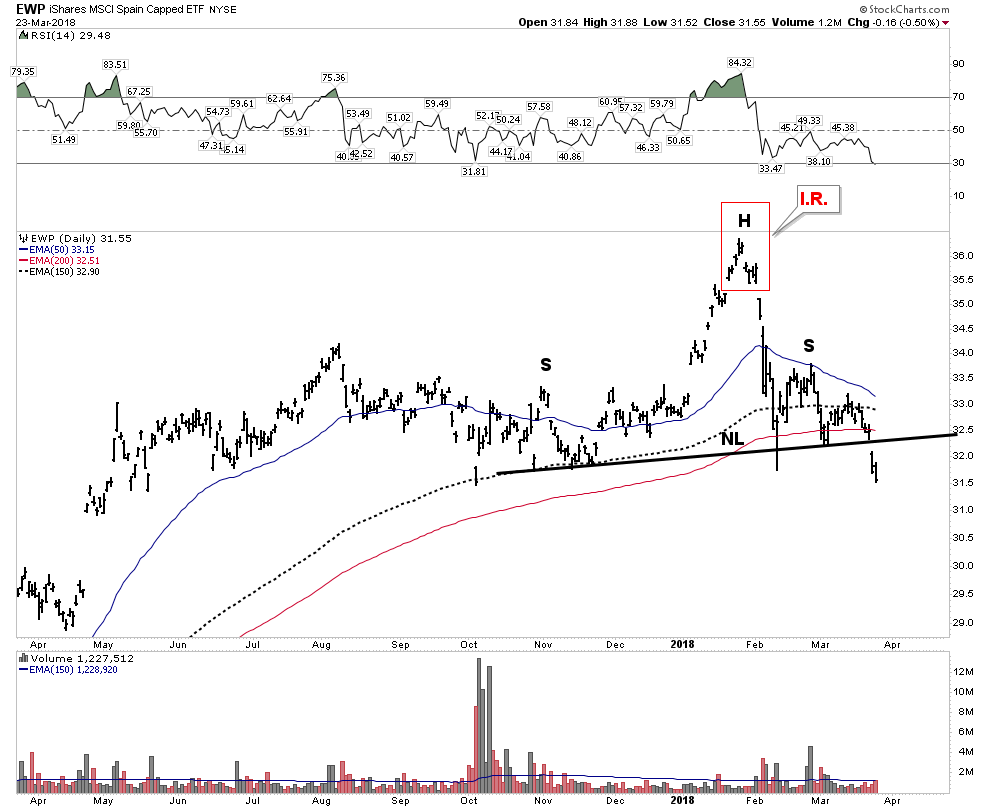
Madrid
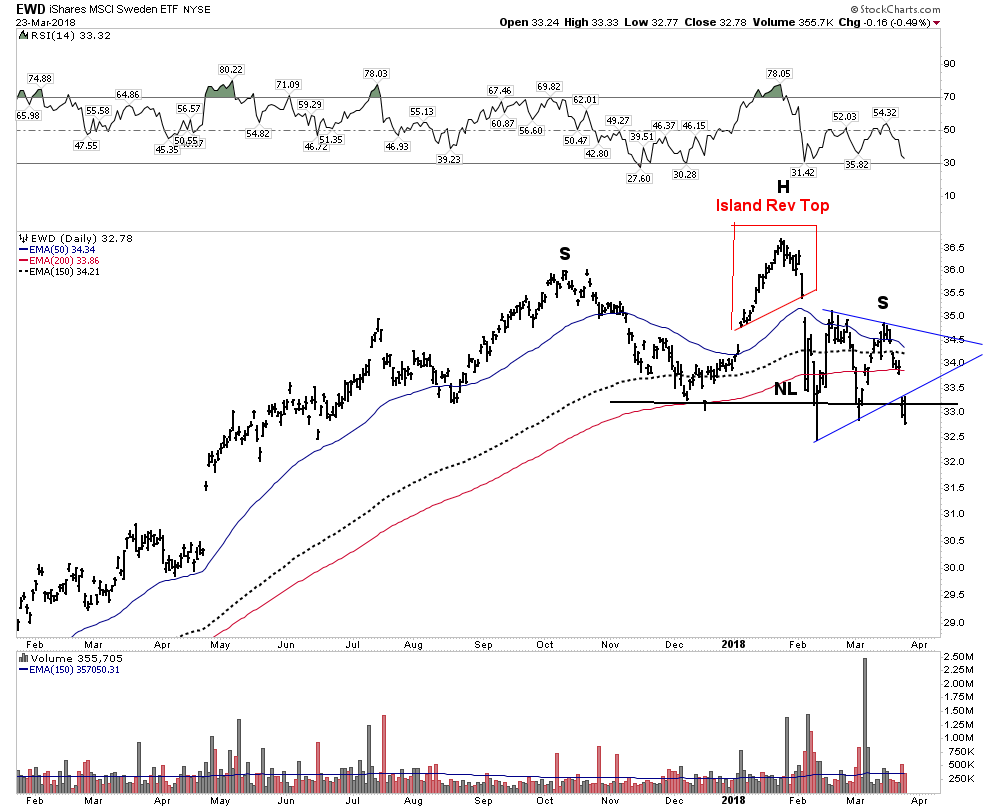
Stockholm
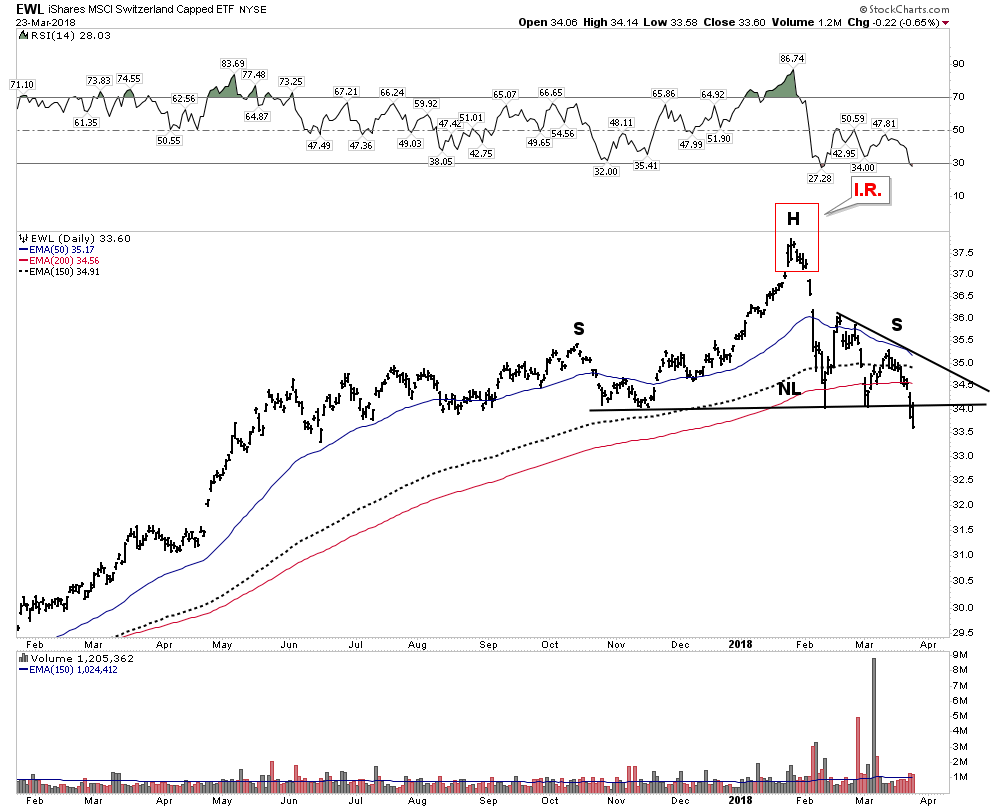
Zurich- Money Center
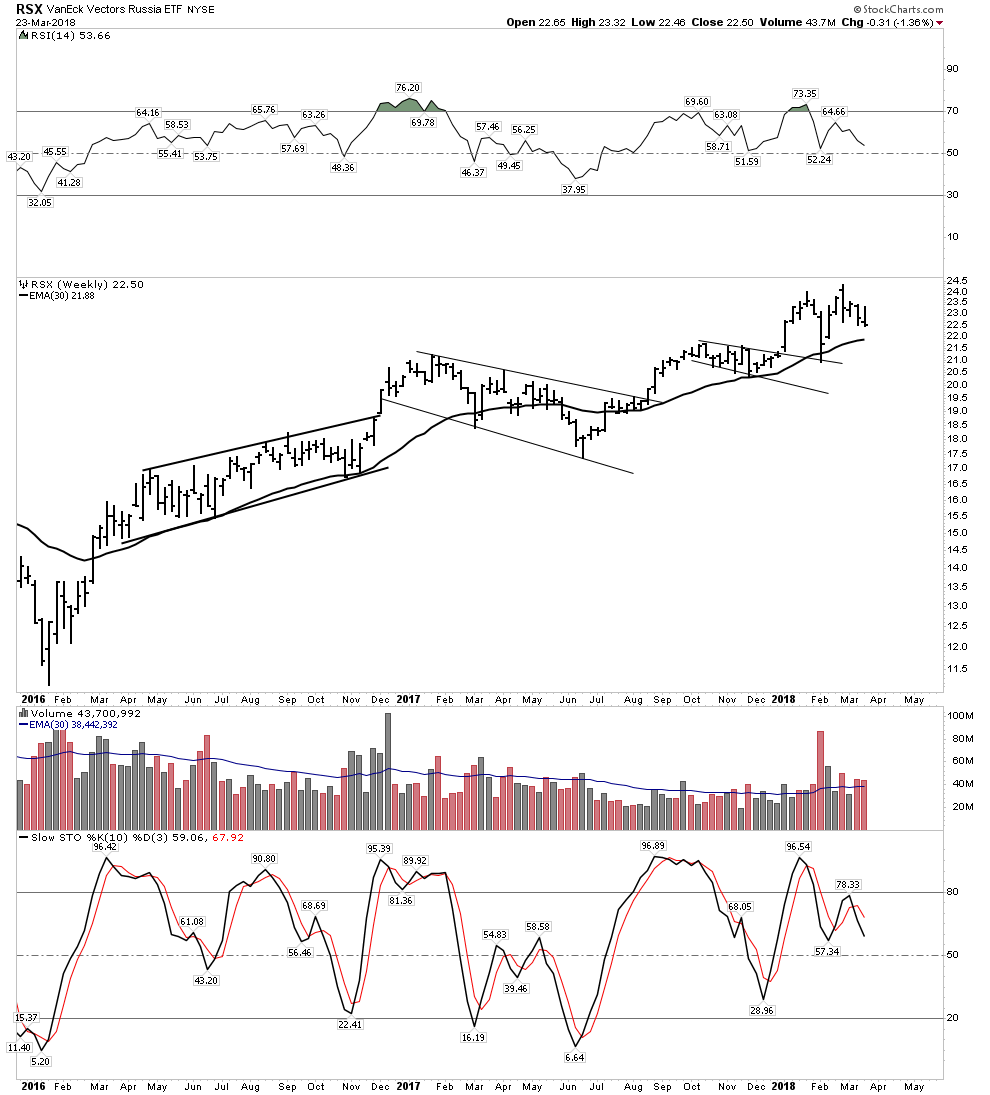
Moscow- Interesting as its the only healthy looking market
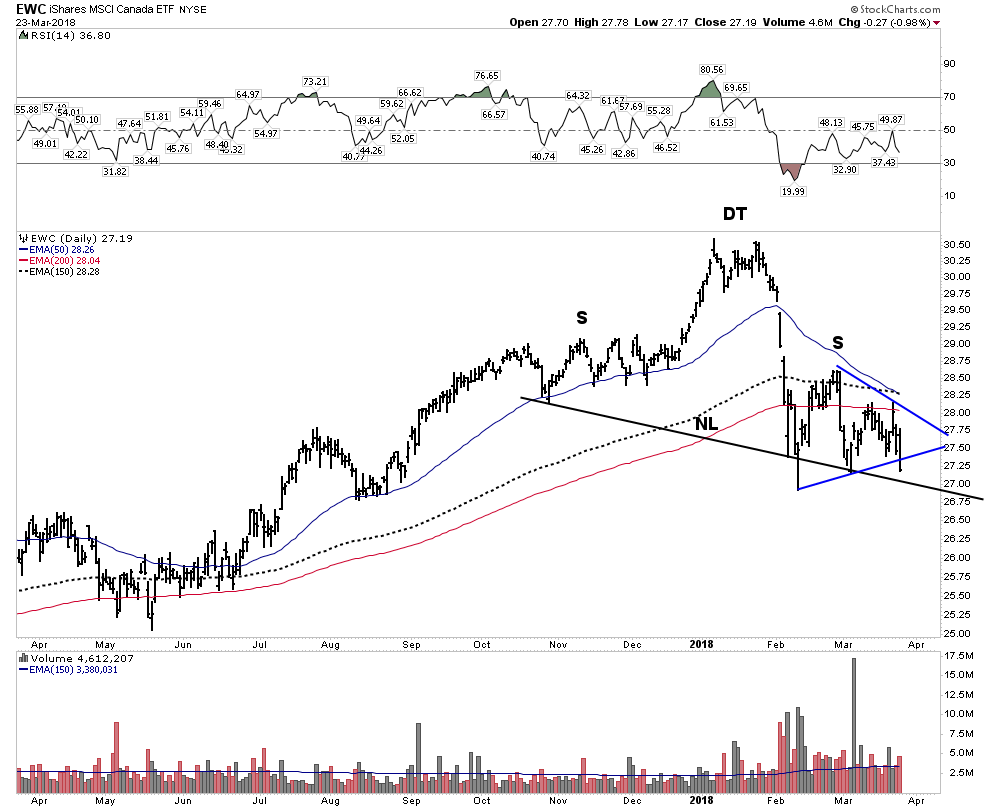
Canada- watching…
ASIA- The damage has spread around the world
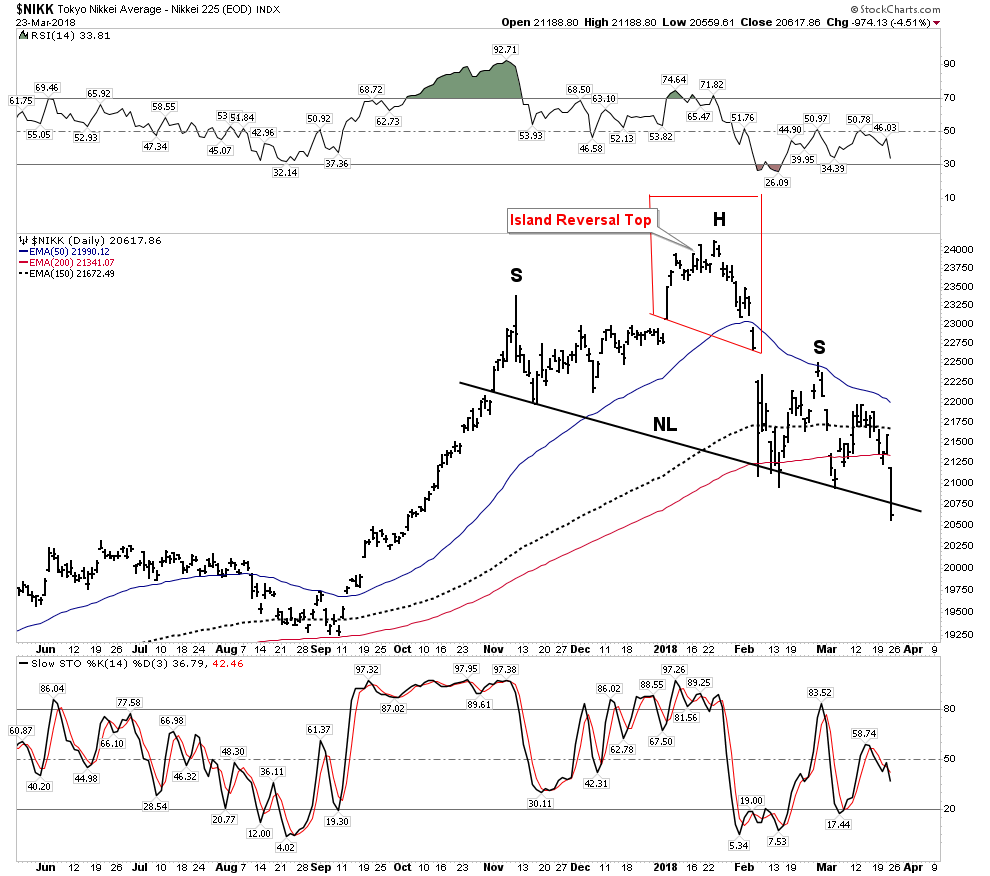
Tokyo- NL drawn off the closing price shows price now violating NL
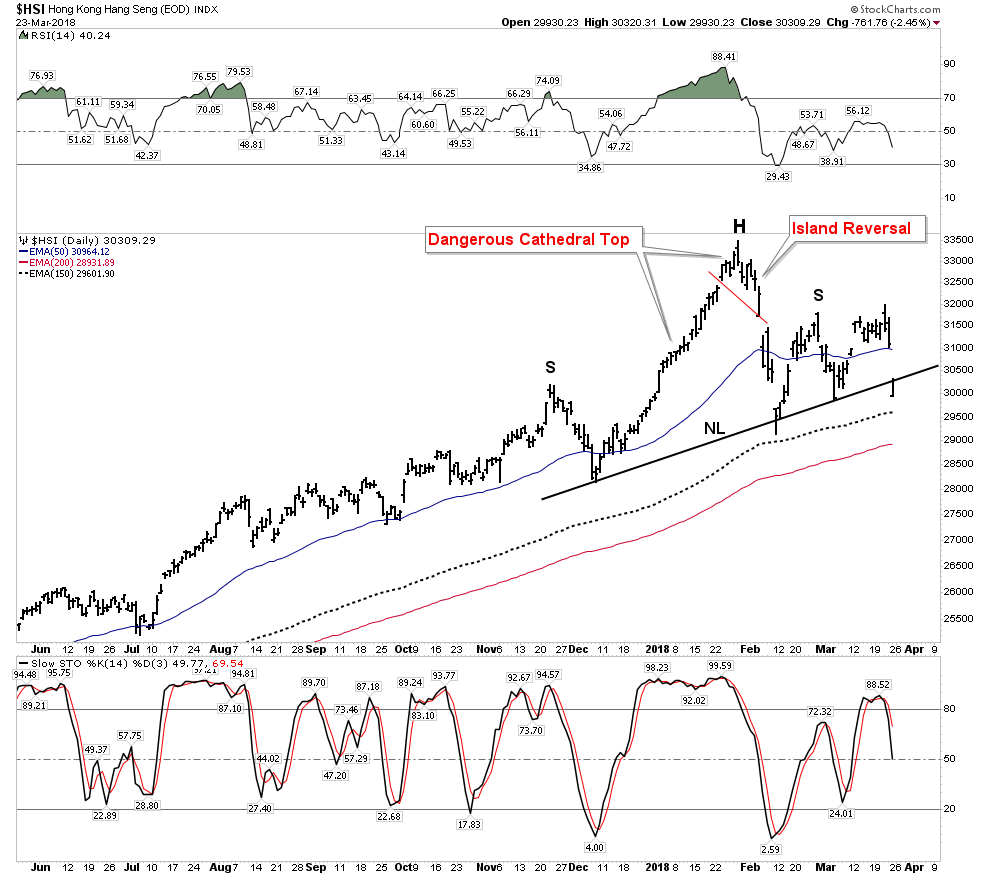
Hong Kong- World’s 6th largest market and an insight into China.
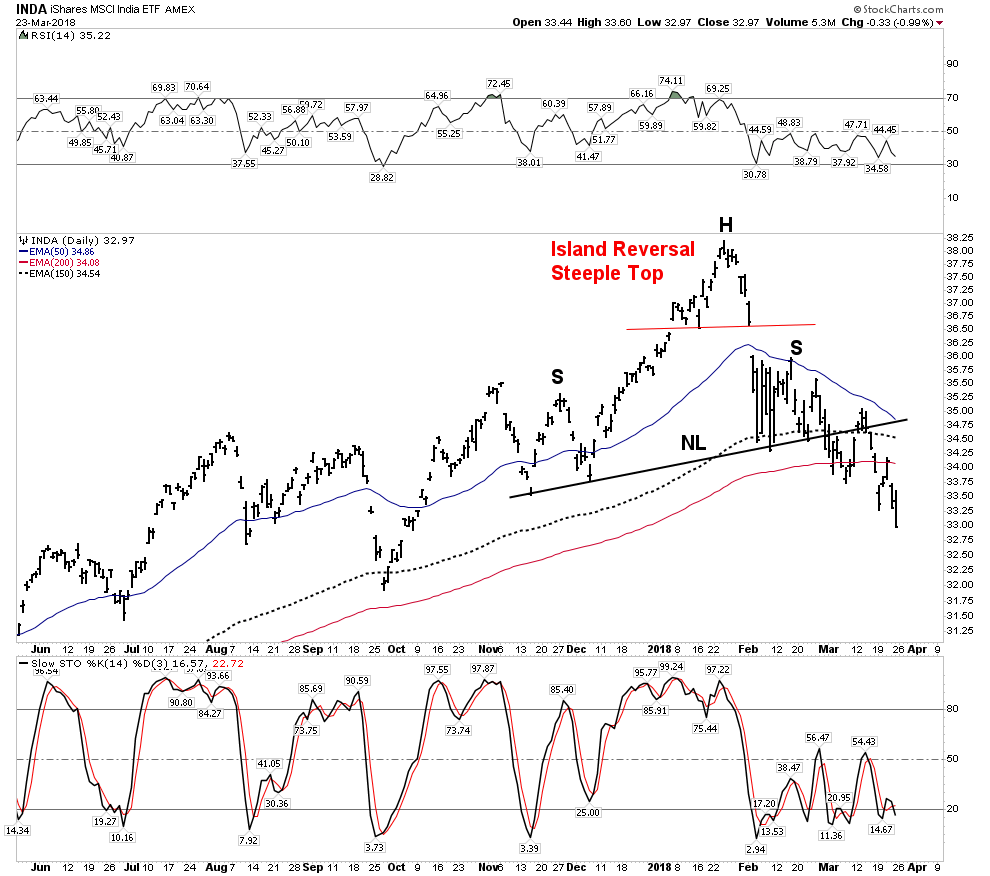
India- Tech sector not saving it.
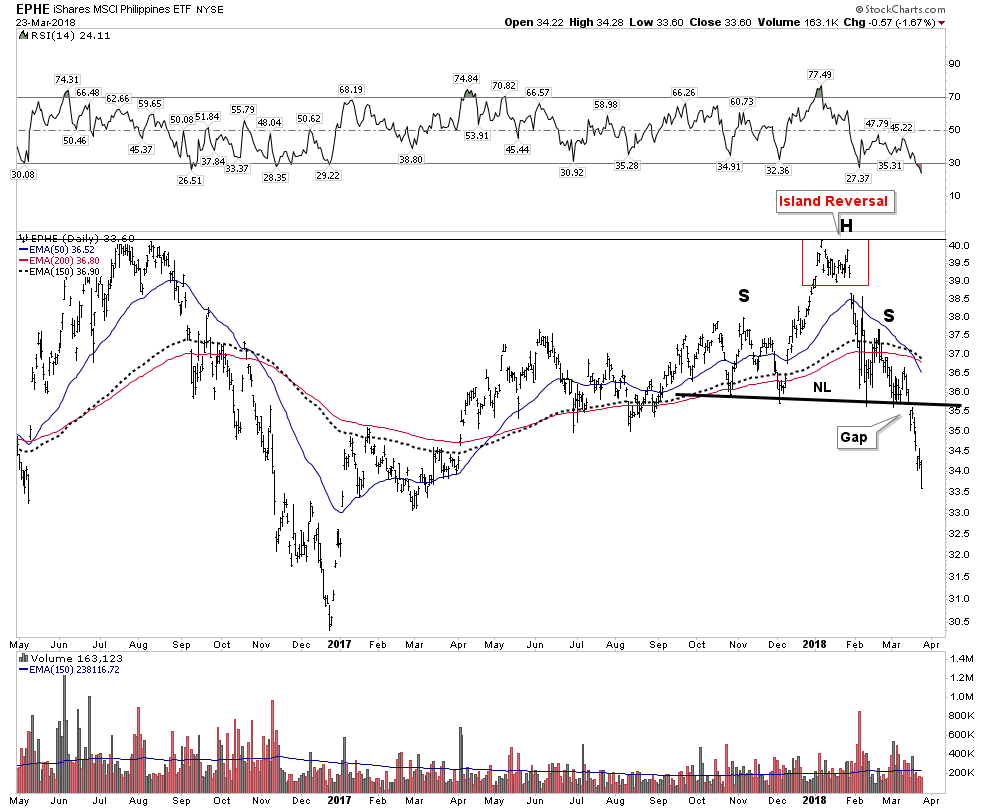
Manila- Runner up most ugly contest.
Kuala Lumpur – Setting up
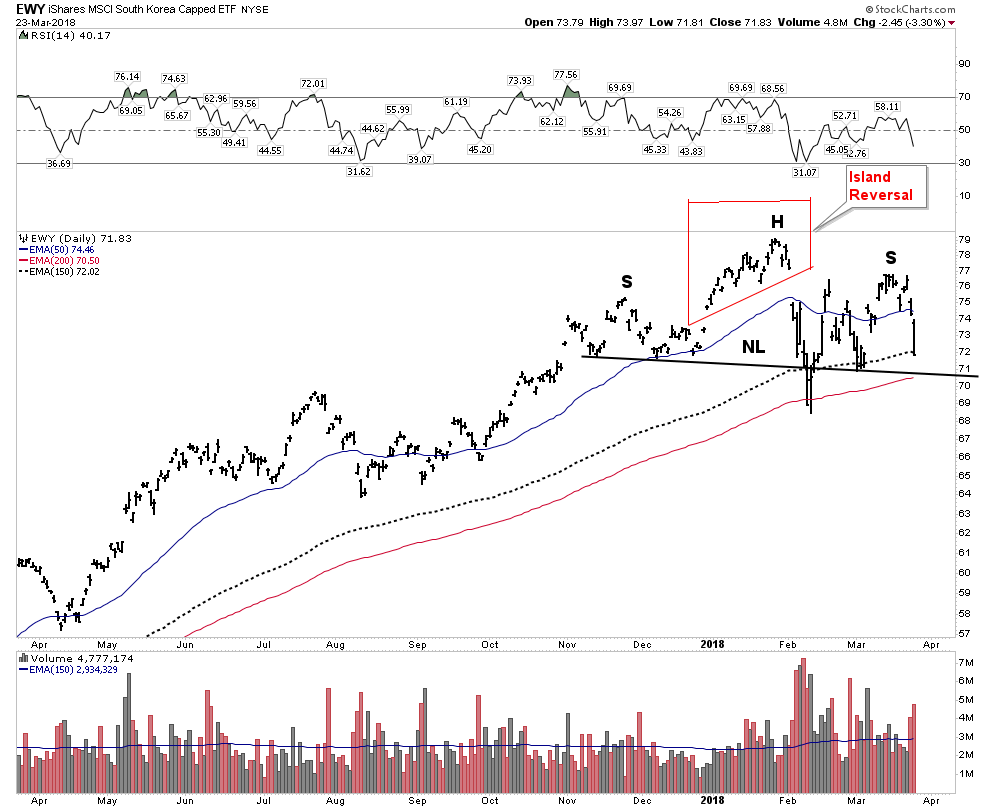
Seoul
The Big Boy- Shanghai. This could be the major pin for an unraveling
I saved this for last in the Asia series since it is so important. Recall China has $4 T base money supporting a $40 T credit structure. Remember its all about interest rates.
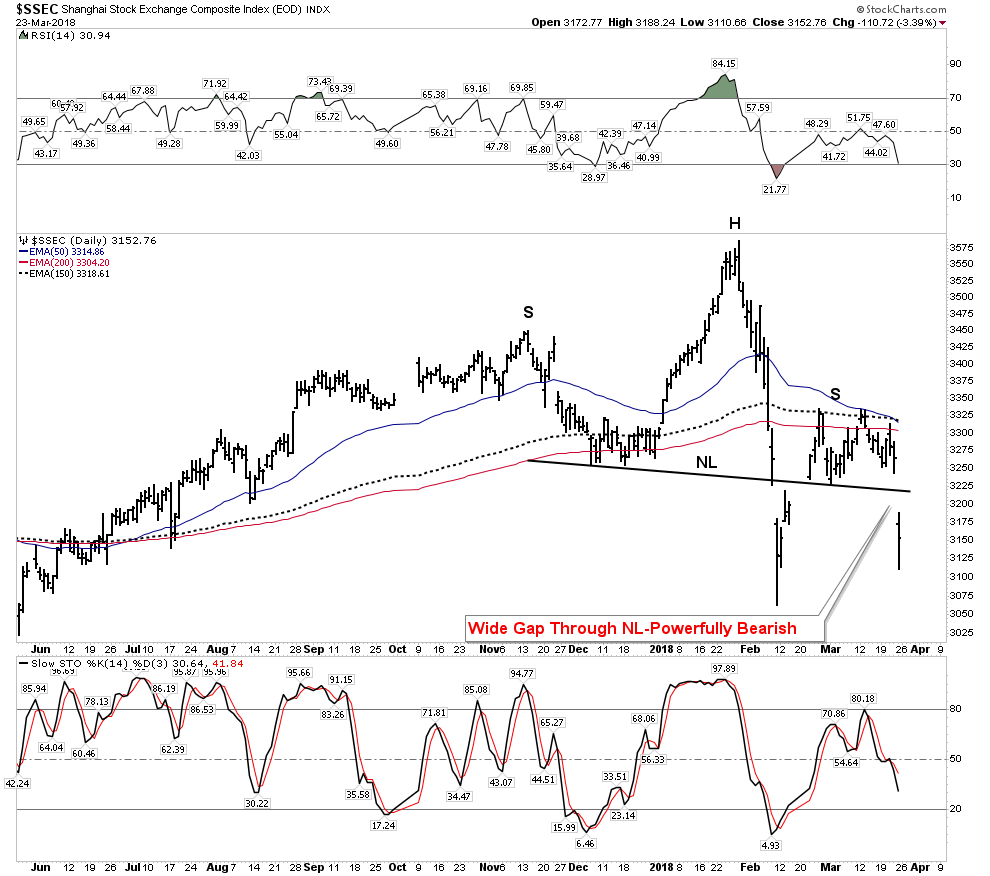
Folks sit for a moment to take in this above chart. Jumping the creek of its NL in powerful fashion. This is the market transmitting a message that this is not just a marginal break. This is a deflationary signal of debt collapse. It’s not messing around here. Listen up!
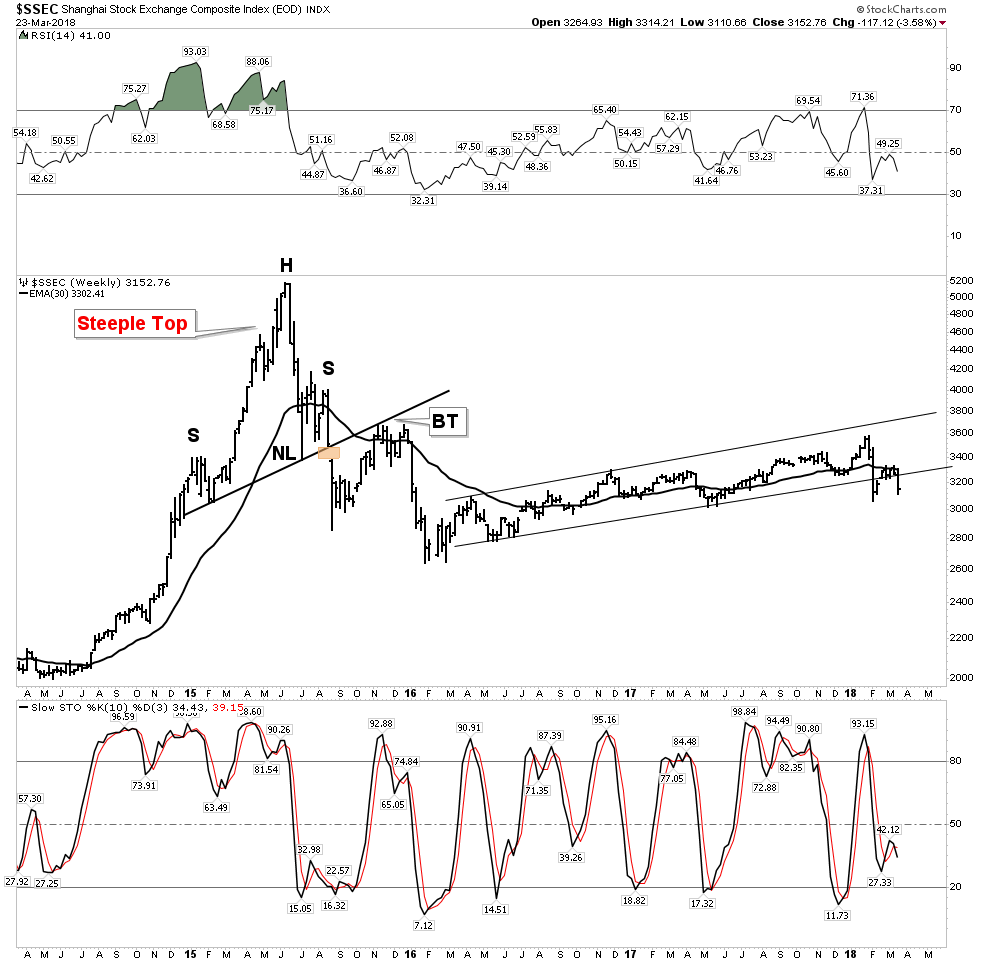
Below the weekly gives it up.
The above monthly shows its hand of where it may be going.
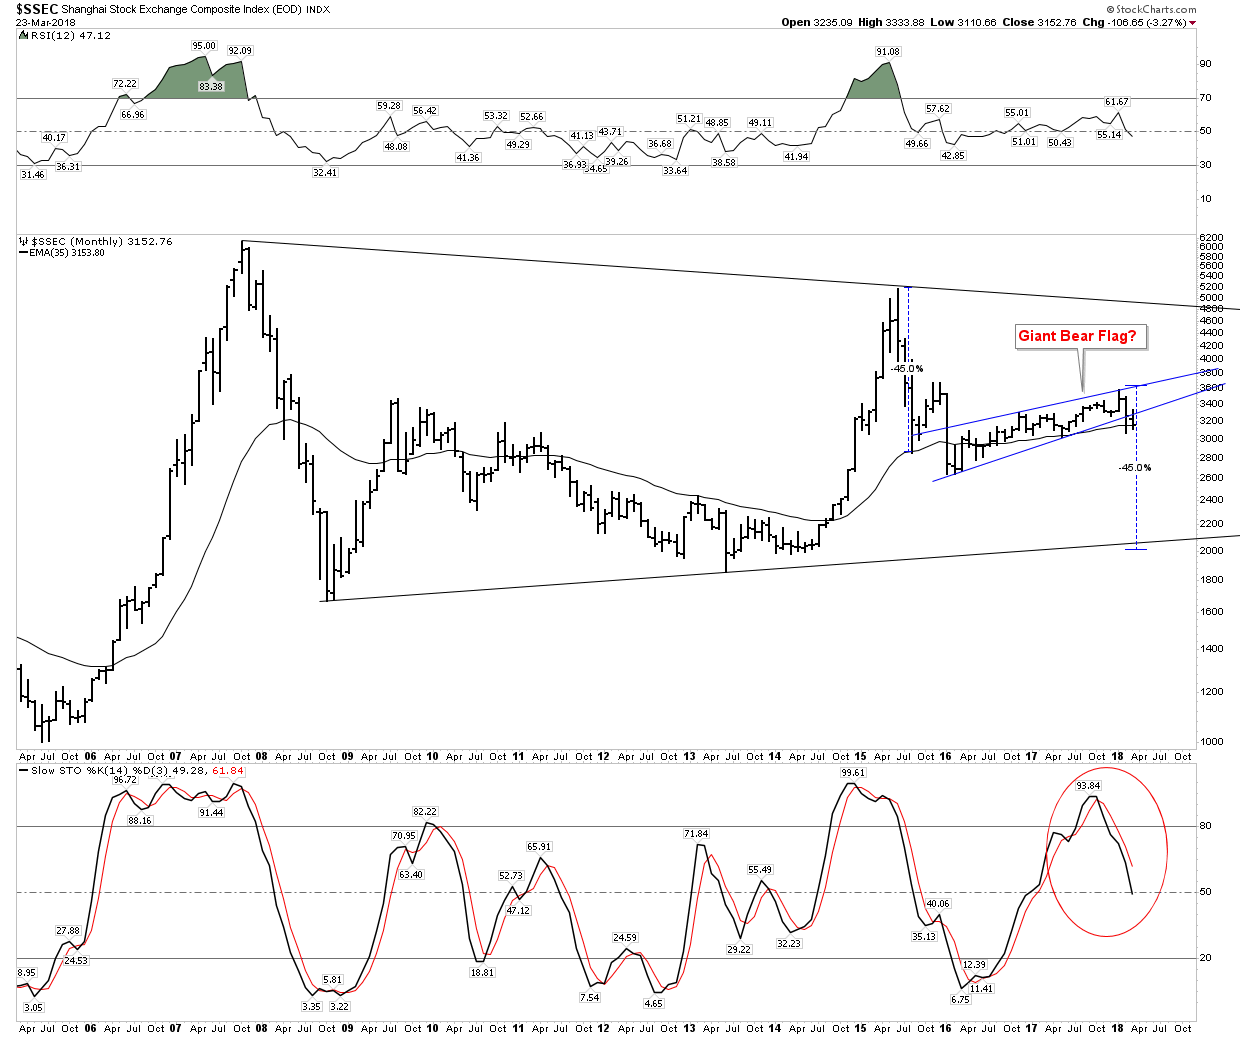
Market collapses have signatures. The powerful shocking collapse of 1929 announced a deflationary implosion ahead. No one believed it and read the collapse wrong. It wasn’t until May 1931 that the deflationary implosion signaled by the crash actually surfaced and was recognizable. People blame crashes for economic damage to the economy, but that is not what a crash is. A crash is simply a recognition of the underlying deterioration in the economy which has already occurred. So when I see the daily price action of the Shanghai exchange jump the creek right across the NL with a gapped space on both sides it gets my attention. It is sending us a message.
Emerging Markets
I have heard a few soothsayers claim this is an oasis. Not so fast:
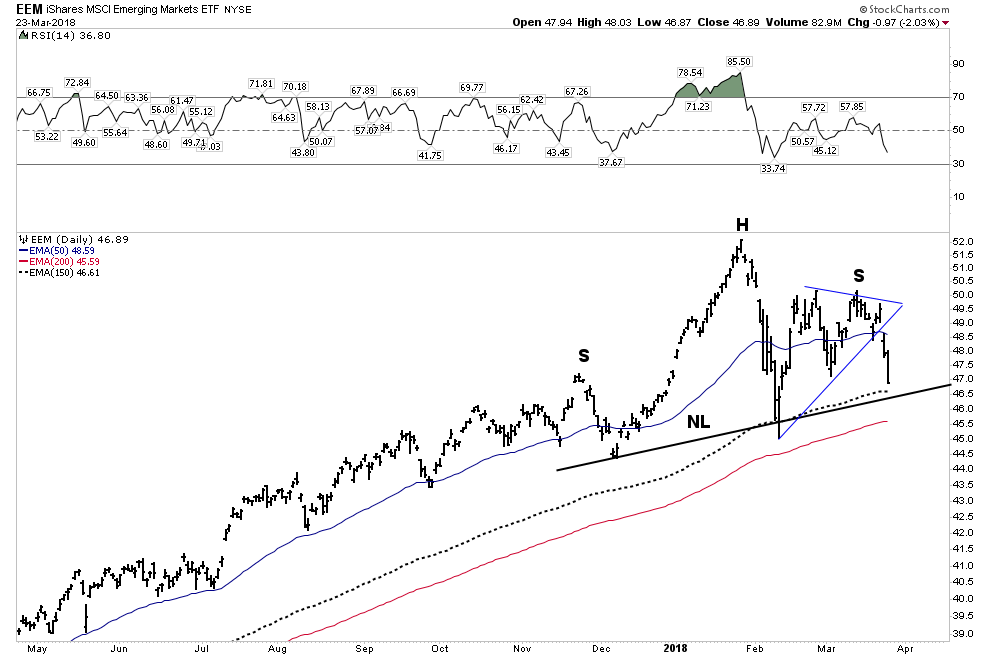
I suspect Brasil and Russia is holding this index up. The message is the same once these two countries are get taken out IMO.
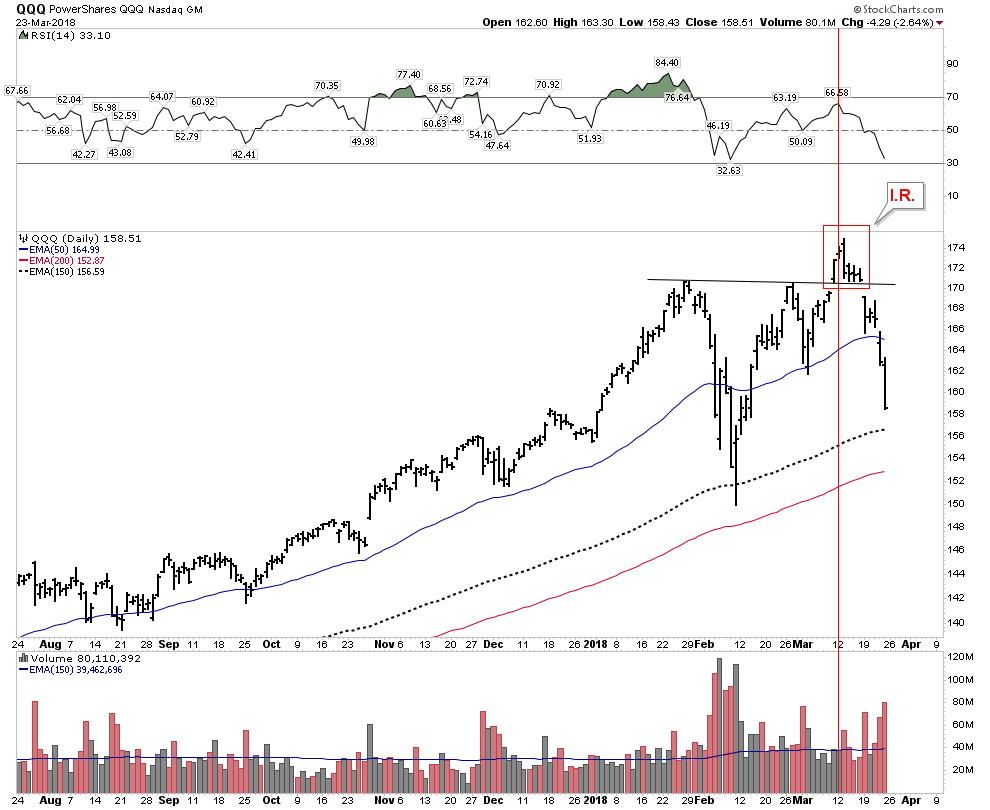
QQQ- The Darling
This index of course has had a religious following. It topped 6 weeks after the main indexes did. Big Deal… that’s what it always does. Same thing in 2000. And now it is displaying the same weaknesses as all the other indexes. Island Reversal with a failed declining RSI.
General Stock Market conclusion:
If these charts do not scare the bejesus out of you then I am sorry I can’t get through to you. I encouraged everyone take a strategic retreat months ago. Here is my heart felt plea: This is a big deal. Complacency reigns supreme. If you care about your financial future… your life… run to your bomb shelter NOW. Yes we will have a buy the dip moment and it should be tradable, but it is not advisable to think that moment is now.
A Personel Message:
I write these reports with little to no feedback. Often times it seems I hit the send button and it simply goes off into the internet ether. I have no idea if I am getting through to anyone. Perhaps many think these are delusional bearish thoughts, after all the FED and CNBC say everything is going swimmingly. They say the economy is strong and unemployment is at cycle lows. But the key to being a successful investor is to be able to see things outside of convention. That’s what one gets when one reads the entrails of Plunger…take it or leave it.
I have laid out the case that this 9 year bull market has been nothing more than a financially engineered event, similar to the 1932-37 bull market which ended disastrously. This market and financial bubble are much, much larger than that era and has the risk of deflating even more violently than the 1937 market. This has now become a global event, there is no conventional place to hide. I am in cash, and in the precious metals sector with a short DOW position. Good Luck because you are going to need it.
Coming soon is the bullish case for gold and the gold stocks.
Editor’s Note
Plunger is an Associate Writer and Resident Market Historian at Rambus Chartology