Wednesday Report…SPX : The Incredibull Market Plays On

Tonight I would like to update some of the charts we’ve been following for some of the SPX that had a wild October to say the least. For whatever reasons October has a lot of volatility which can lead to some important lows and in a few cases a crash which is rare. This past October shaped up similar to many of the previous Octobers we’ve seen since the bull market began in 2009.

This weekly chart for the SPX shows all the Octobers since the bull market began in 2009. For the most part if you took a position in October you were generally ahead of the game the following October with a few exceptions. This past October again marked a good spot to take a position in the SPX for a possible intermediate term move.

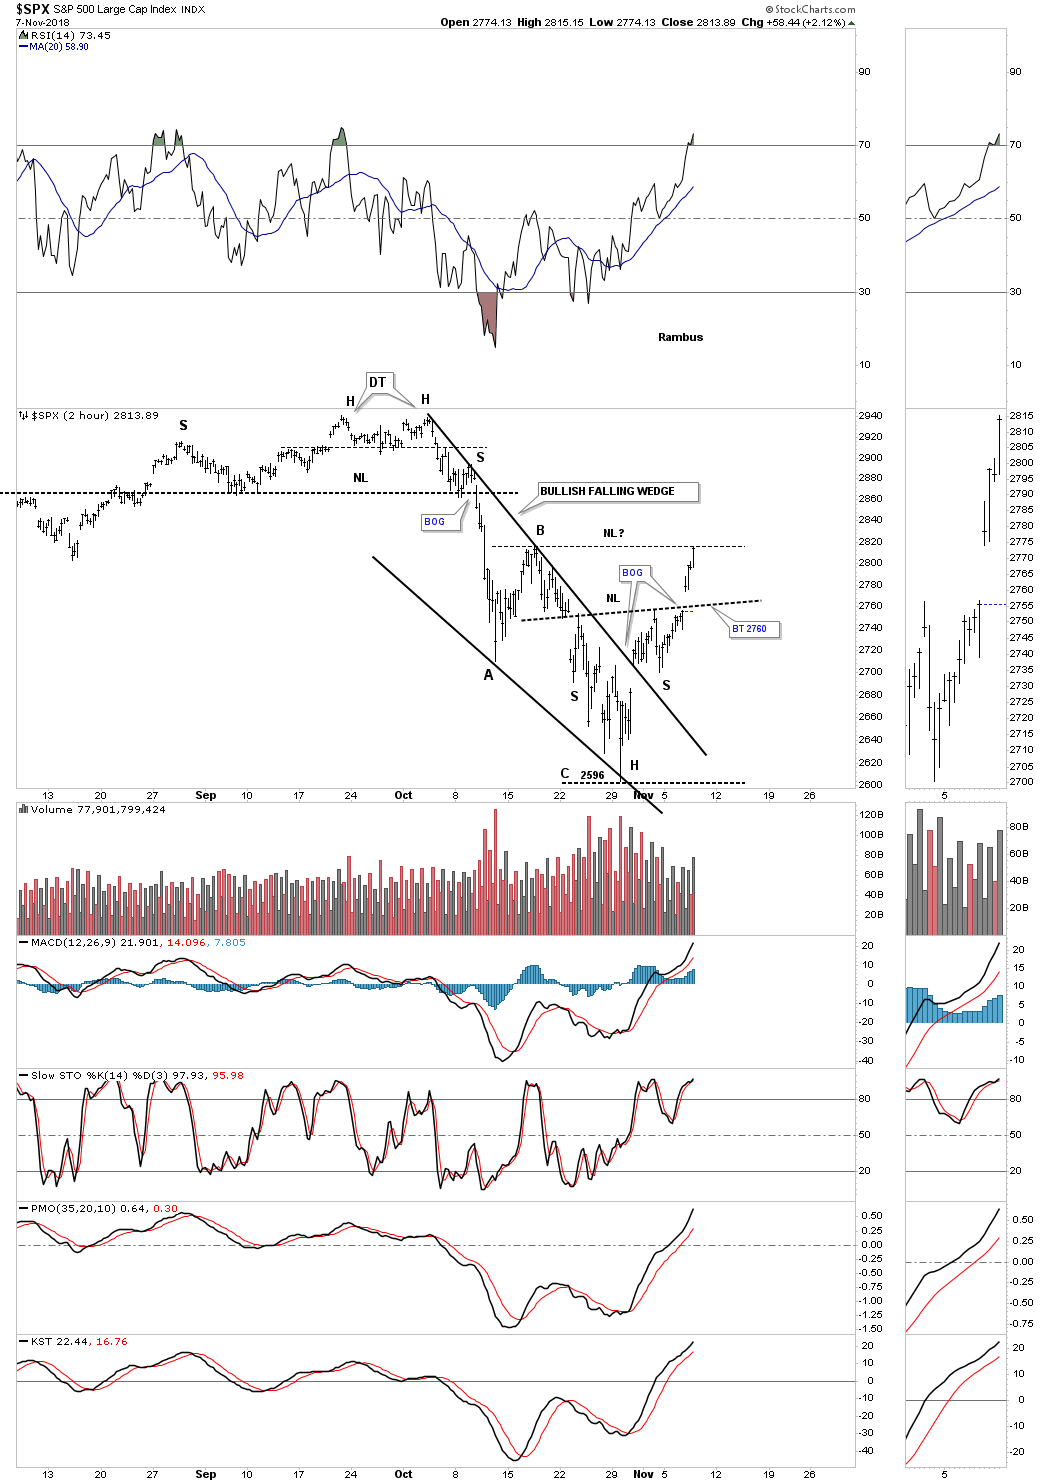
This next chart is a two hour chart of the SPX that we looked at back in the middle of October when we were looking for an ABC price decline with the A leg down matching the C leg down in price which hit pretty close. During the October decline the SPX built out a bullish falling wedge which was concluded  with a big breakout gap. Whenever I see a well formed wedge, in this case the falling wedge, I like to look for reverse symmetry on the way up. We have looked at many cases where the left shoulder low and head form inside the falling wedge, with the right shoulder low forming during the backtesting process.

As you can see so far this two hour chart is showing the bullish falling wedge with a H&S bottom as part of the falling wedge. The H&S bottom was confirmed with the big breakout gap this morning. Today’s price action reached the top of the B leg where we could see a pause that refreshes with a possible move down to the original H&S neckline around the 2760 area. If that were to occur and the neckline held support we could end up with a double H&S bottom which is only a possibility right now.

Below is a daily look at the SPX which shows the 2018 trading range which is shaping up to be a parallel rising flag formation if the price action can takeout the top rail. Note how today’s move took out the three moving averages by gapping above the 200 day sma and the 20 day ema and closed above the 50 day ema.  Again it’s possible we could start to see a potential right shoulder build out which would close today’s breakout gap.

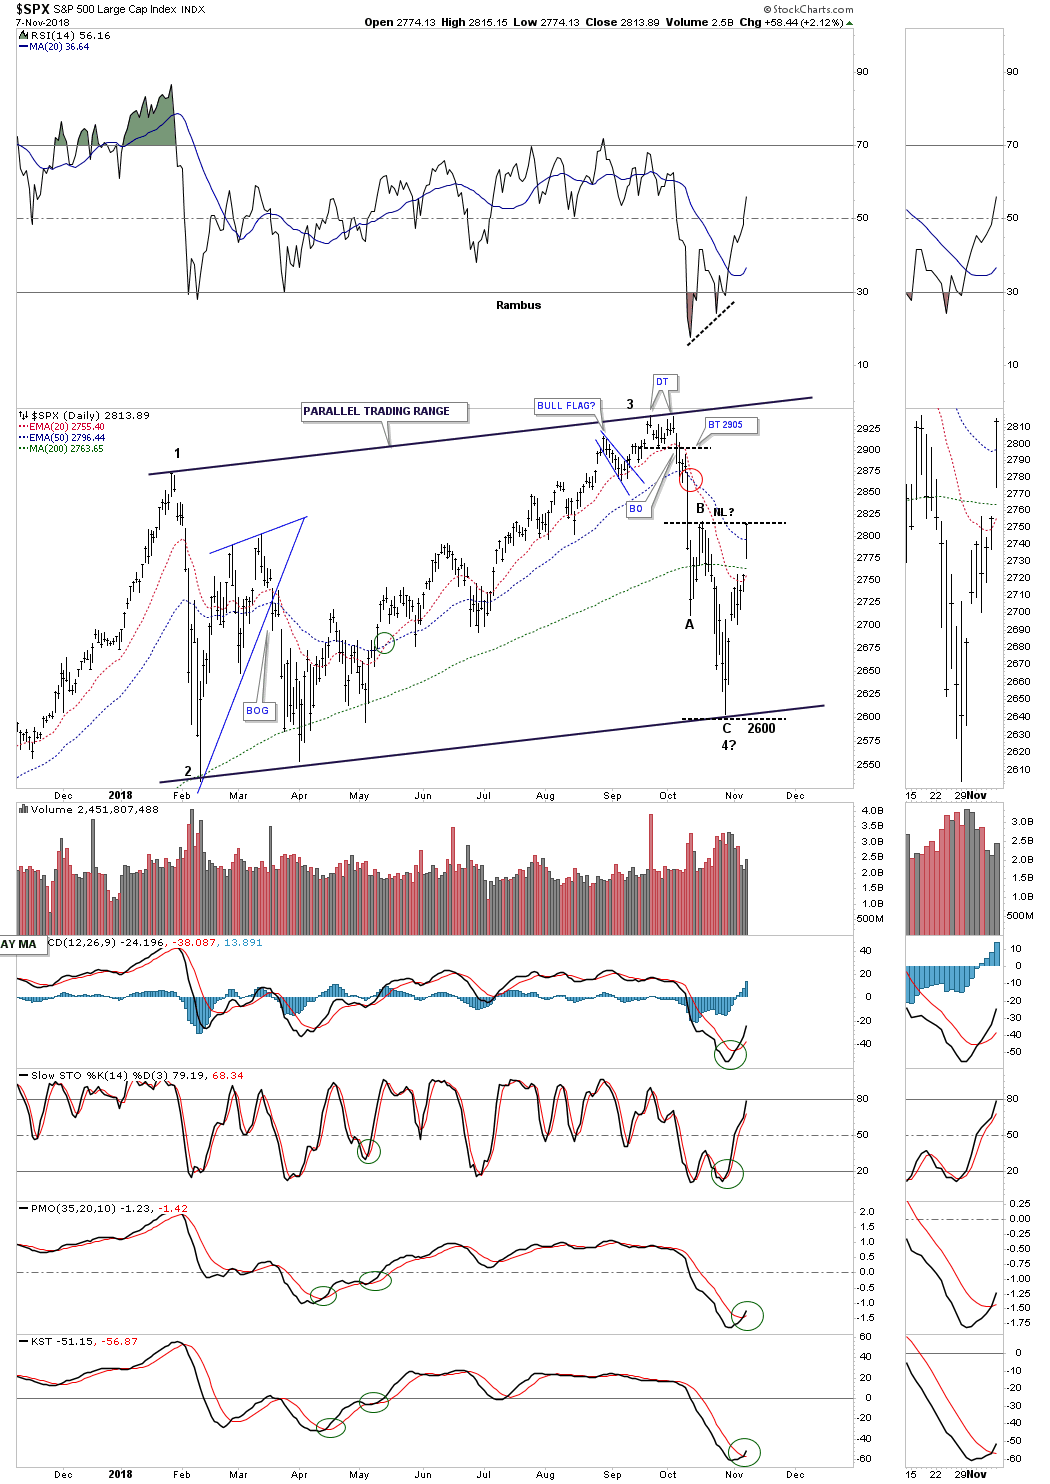
Earlier this spring when it became apparent that the first reversal point was in place and the price action began to rally off the bottom, to start the second reversal point to the upside, I strongly suggested back then that I would be looking for a possible four point consolidation pattern to build out because that’s what stocks do during a bull market. Since we only had reversal point #1 in place with the possible 2nd reversal point starting I drew in the top and bottom trendlines as horizontal. There was no way to know what type of trading range would build out so I always start out with a horizontal top and bottom trendline. As more information becomes available you then start to tweak your top and bottom trendlines. It wan’t until the October high, which made a slightly higher high vs the January high could we begin looking for the 3rd reversal point to the downside, which you can see on the chart below.

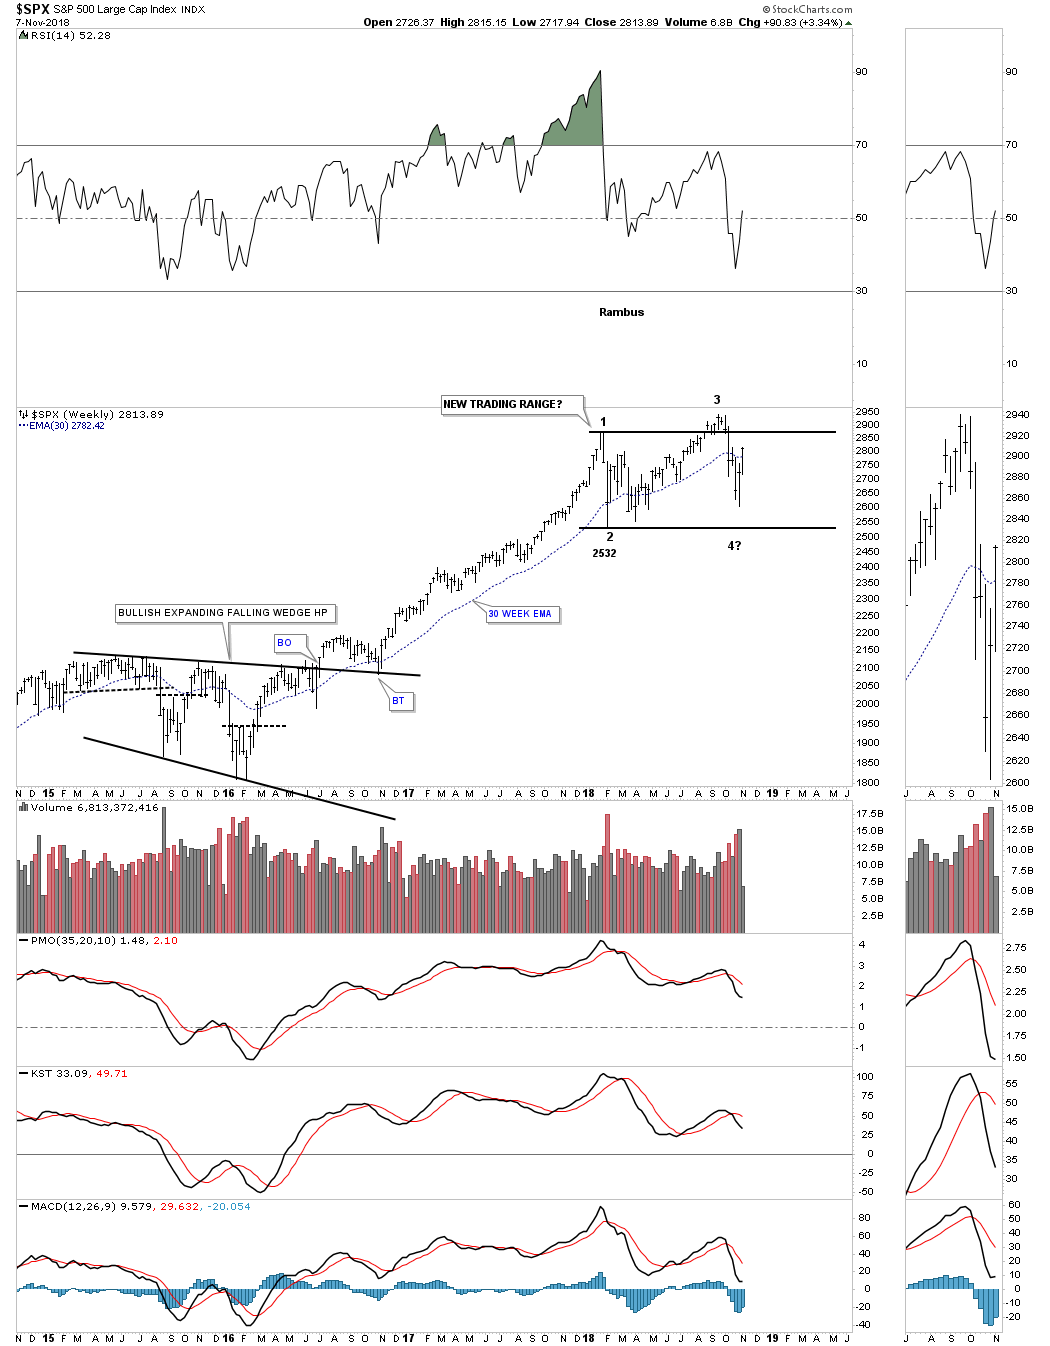
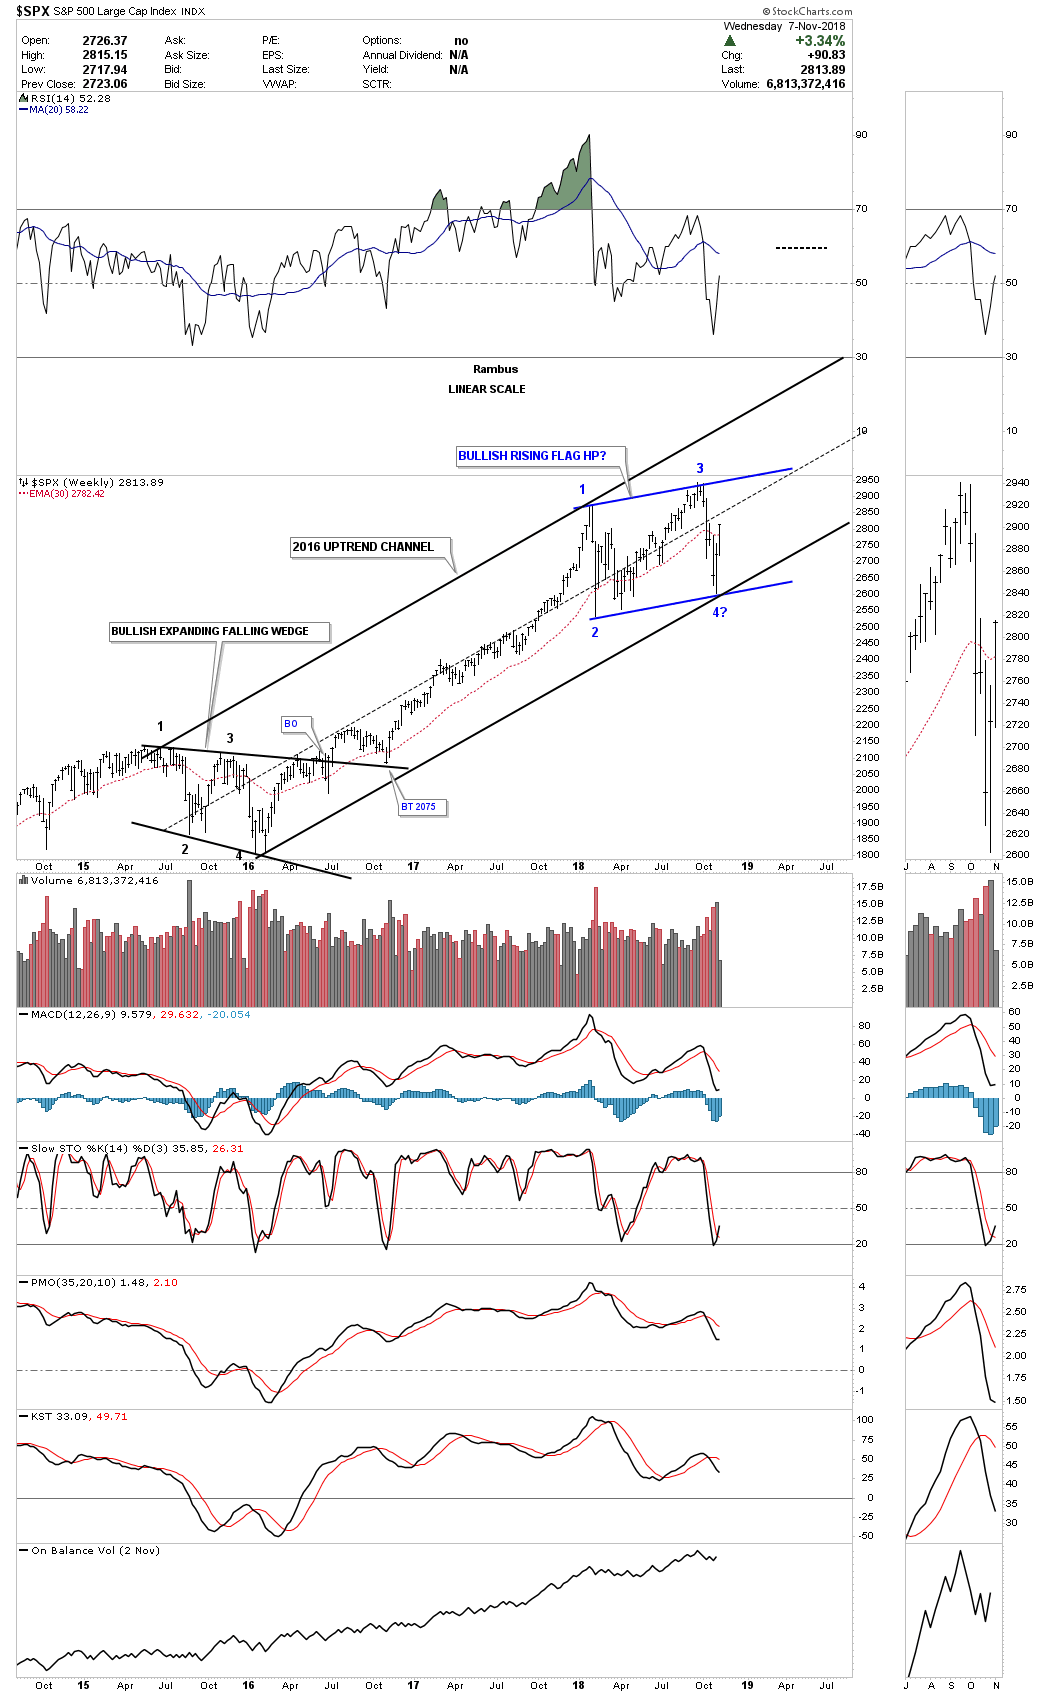
This next weekly chart shows the now rising flag formation is 3/4’s the way finished if we end up with four reversal points. What is also encouraging about this pattern is that it’s slopping up in the uptrend trend channel which shows a strong bull market is still in play. One last positive on this chart is the SPX is now trading back above its 30 week ema.

If our potential bullish rising flag plays out this simple weekly chart shows how the bull market that began in 2009 is starting to go parabolic. From the 2009 low to the 2016 low the uptrend was steady as she goes. Then from the 2016 low to our most recent low in the rising flag formation, the trend is getting steeper. It’s subtle, but it is possible that our next rally phase could be steeper than the two year 2016 rally phase.

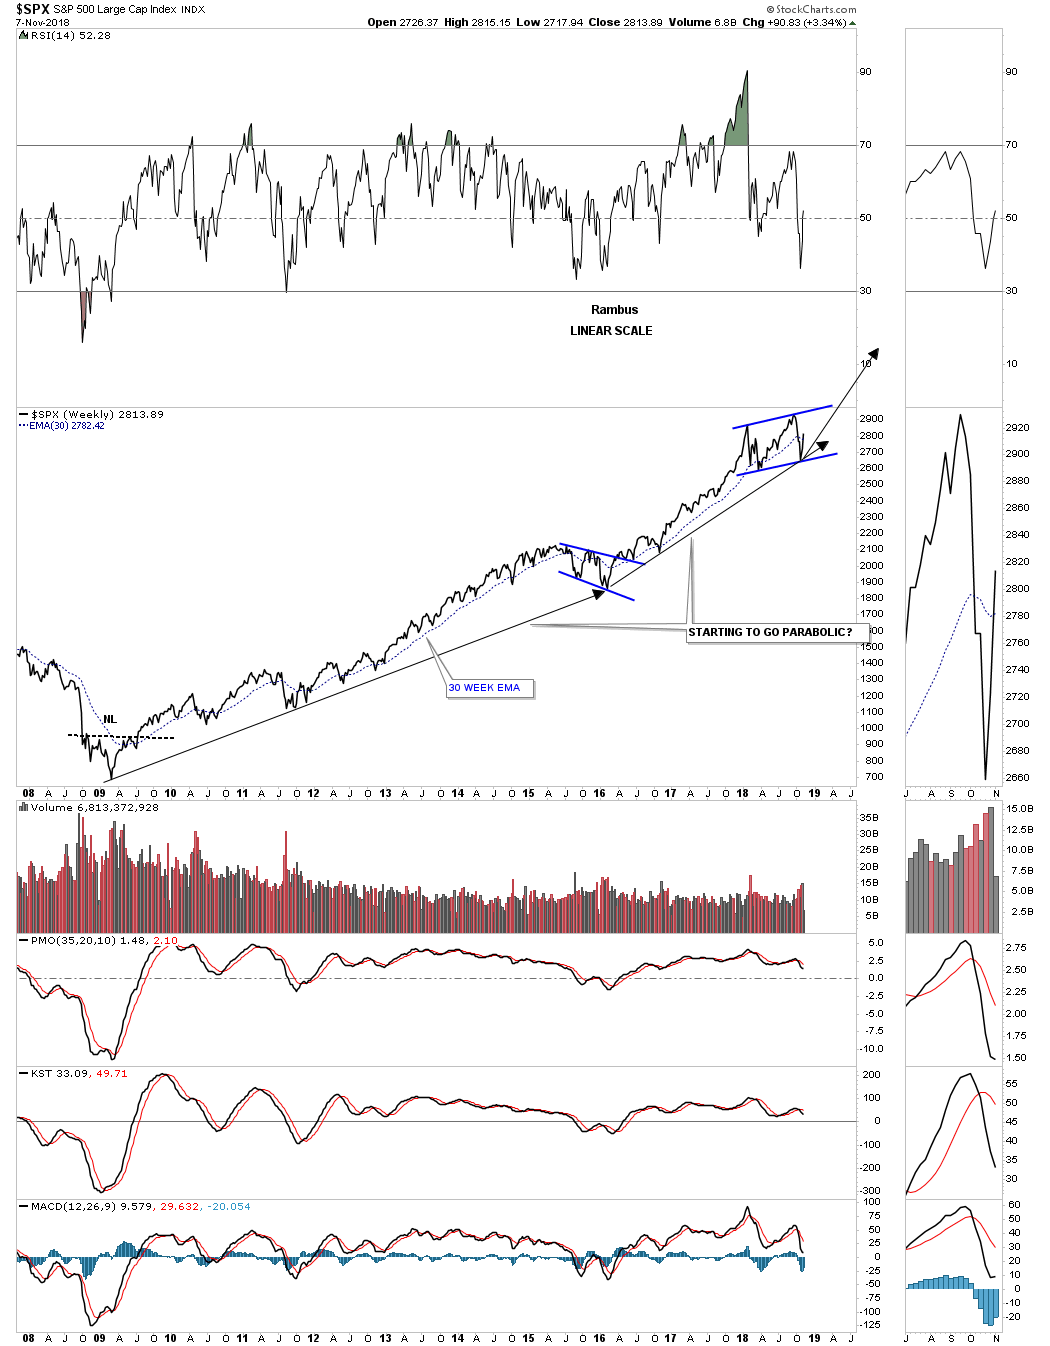
This monthly chart shows the 2009 bull market which is classic in its development. A breakout above the top rail of our current rising flag formation will lead to a similar rally out of the previous consolidation pattern, the bullish expanding falling wedge, to the first reversal points in our current trading range. The chances are that it could also be steeper than the 2016 rally phase if we get a blowoff phase similar to the end of the 2000 bull market.

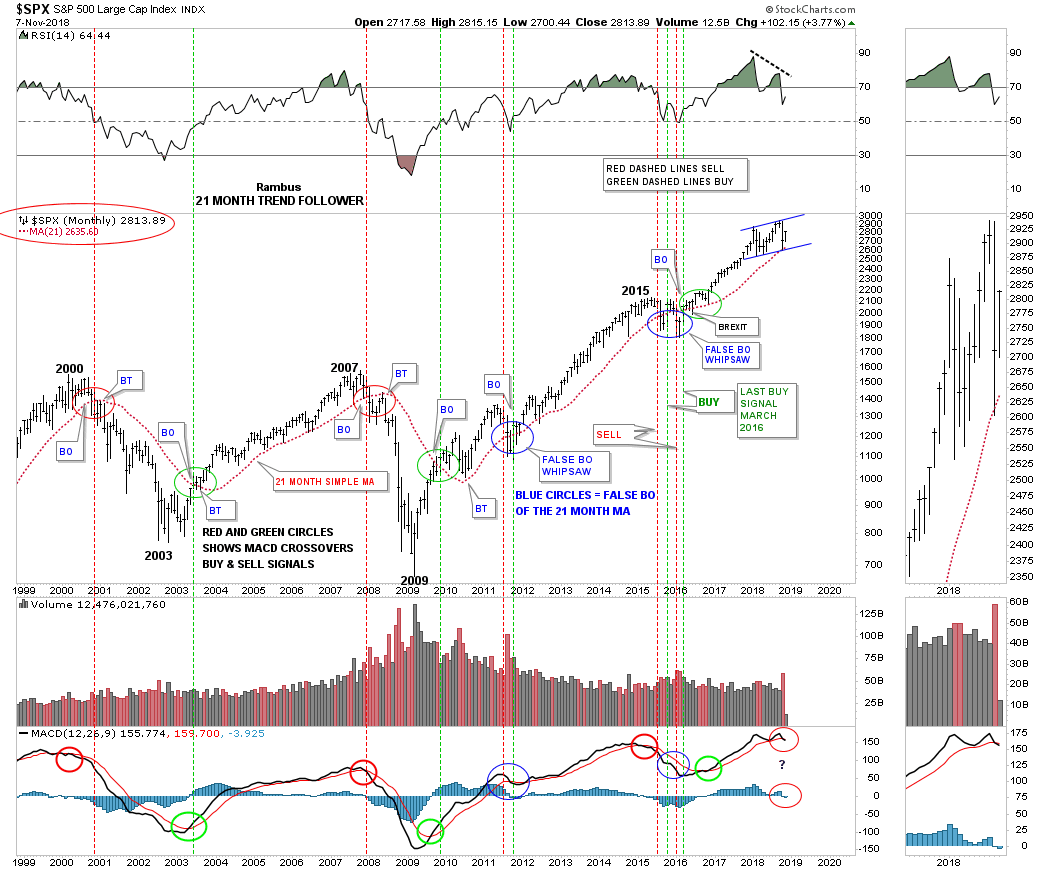
This next chart is the 21 month trend follower chart which we looked at last month when the price action was testing the all important 21 month sma on the SPX. During the deepest part of the correction last month the 21 month sma held support just as I had hoped it would. It was nip and tuck at the bottom, but so far so good.

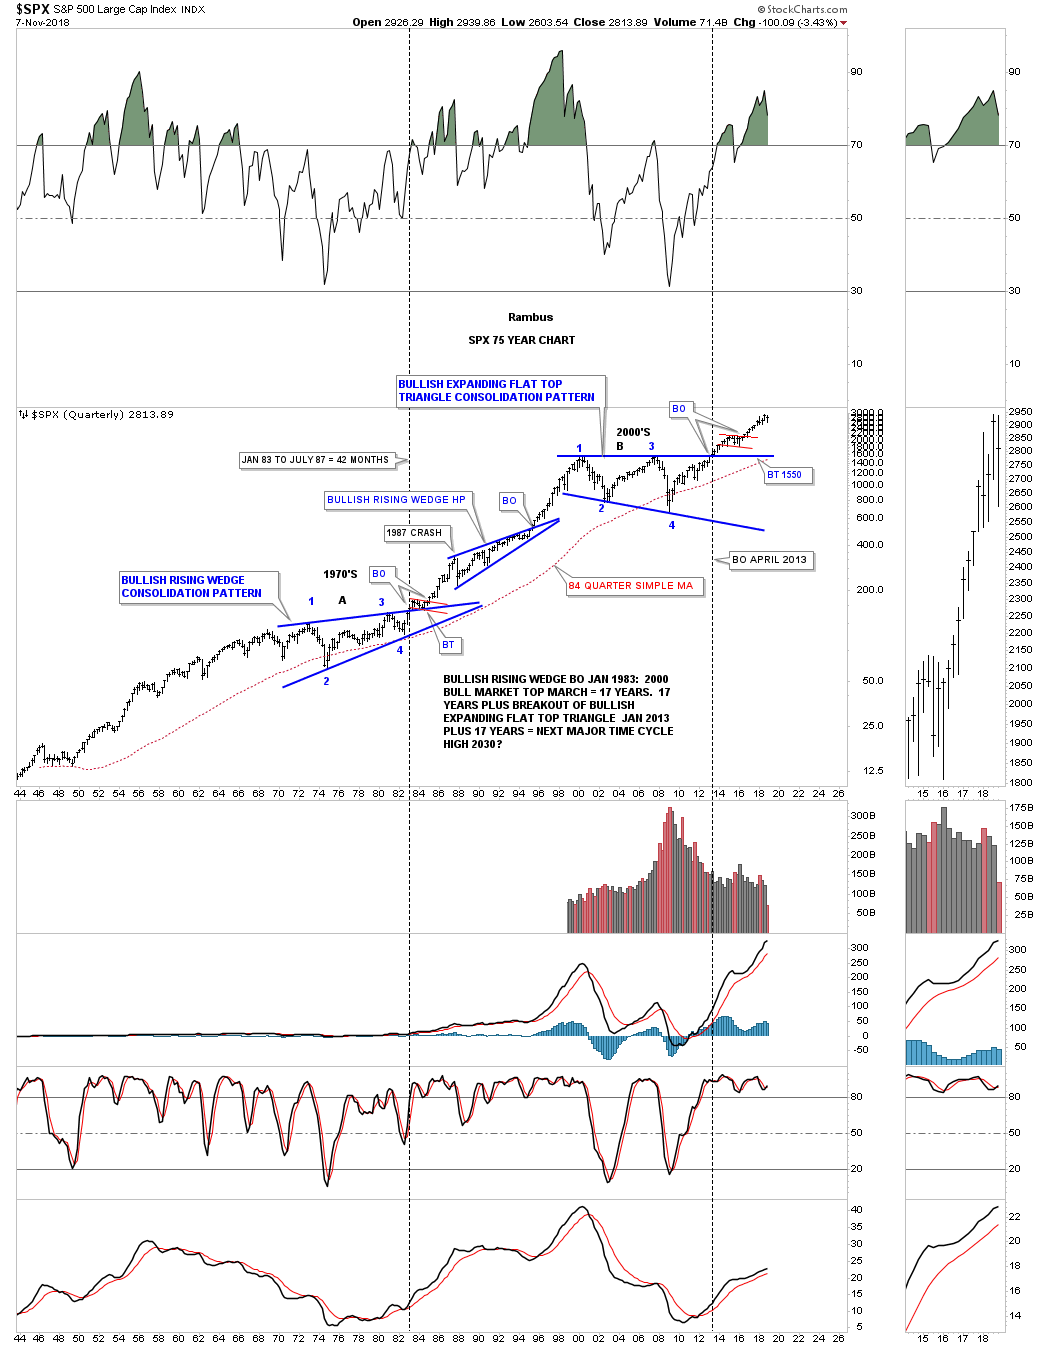
To put everything into perspective below is a 75 year quarterly chart for the SPX which shows the 1970’s trading range and the 2000’s trading range which has led to a secular bull market after the big consolidation patterns were finished building out. I know how radical this chart seems to most people but we’ve been following this secular bull market since the SPX broke out from the flat top expanding triangle in 2013.

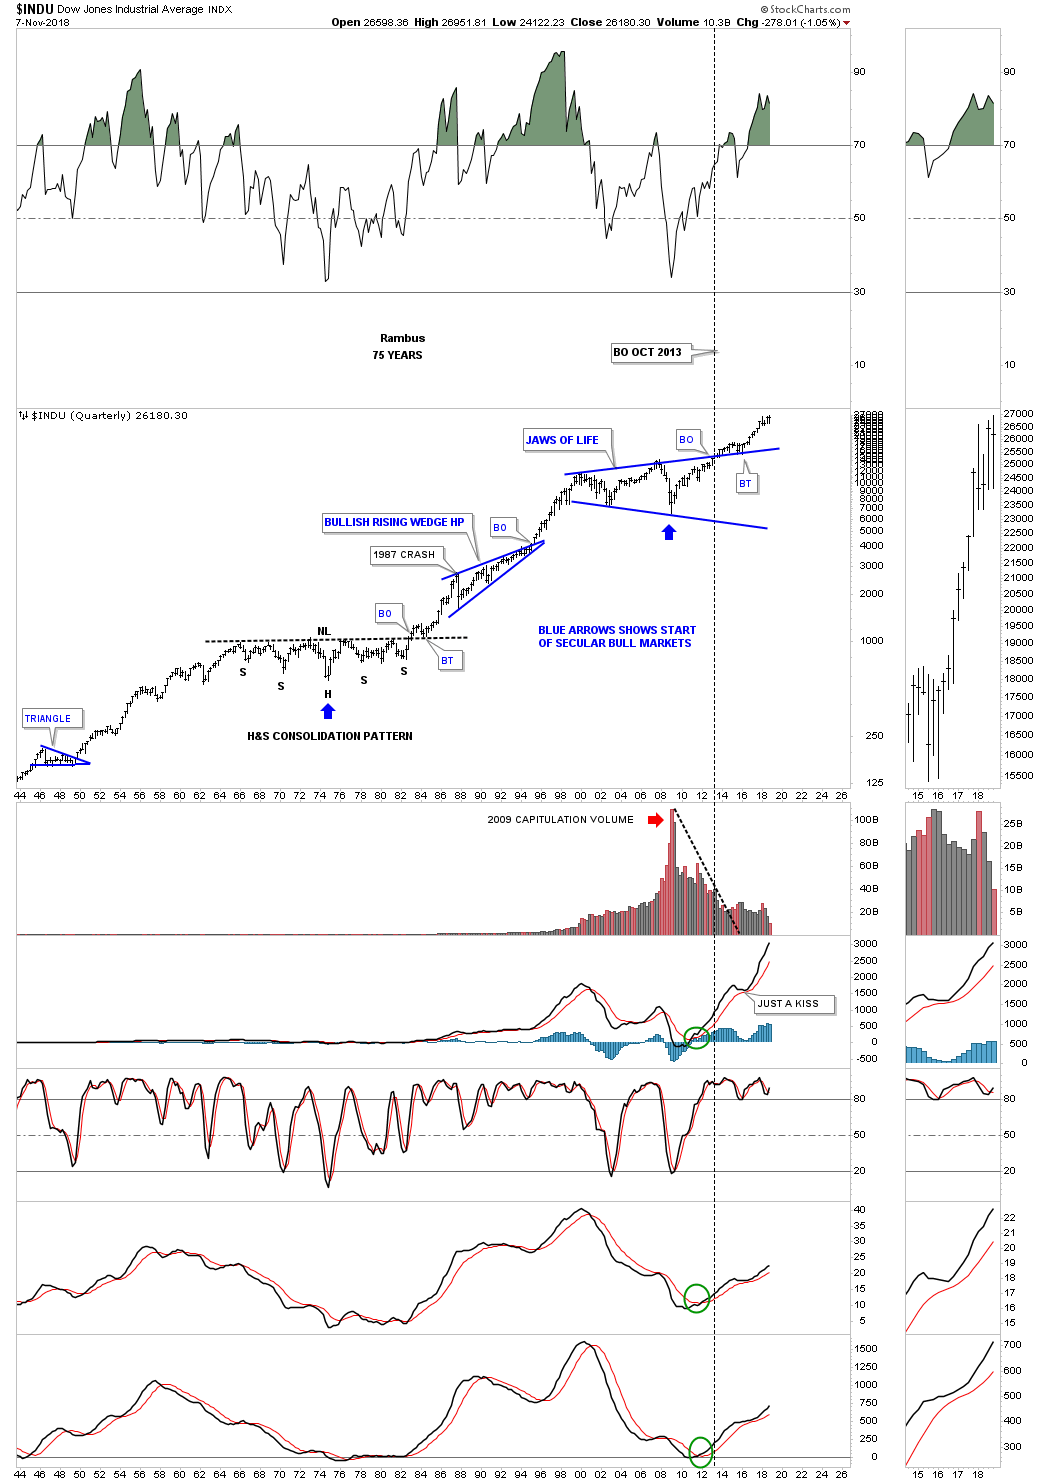
Below is a 75 year quarterly chart for the INDU which I call the Jaws of Life, because so many analyst were calling it the, Jaws of Death, where I saw a consolidation pattern they saw a top. The backtest to the top rail of the Jaws of Life was one to test your patience as it went on forever before the impulse move finally began. If you look at the thumbnail on the right side of the chart you can see that the INDU is within striking distance of new all time highs. You can also see on the thumbnail that the last four quarterly bars are forming a rising wedge formation.

Since our current bull market that started in 2009 there have been countless opportunities for the bears to be correct, but in the end, at least so far, this bull market has proven them all wrong. One of the most important rules of all time is, “The Trend is Your Friend.” All the best…Rambus


GOLD POSTS

Of course the Gold market is the most popular topic here at Rambus Chartology.

So we have added a new category on the sidebar putting the Gold Posts  in chronological order for members to more easily follow Rambus’ extensive work in this sector.

“ALL ABOUT GOLD”

13 Episodes including last nights very comprehensive post.

Enjoy

Fully

Late Friday Night Charts…

This weekend I’ll be showing you many long term charts for all the different areas in the markets as part of the Quarterly Report I do for Catherine Austin Fitts who is the founder of the Solari Report. It’s a lot of work but it forces me to look at the big picture for signs that our bull market, which has been in place since the 2009 low, is still intact and viable. When we just look at the short term charts it’s easy to miss the big picture and what it means for the long term. All bull markets will come to an end and our current one will be no different.

I’m currently updating about 100 long term charts that I hope to get finished for part of this Weekend’s Report. Sir Plunger will be posting his Weekend Report also. I can tell you from the long term charts that I have updated so far that many have begun to trade below their 12 month sma which is the first sign their bull market might be in trouble. There has been a big change in the last three months, especially the last month, so it’s time to pay close attention to what the charts are showing us. All the best…Rambus

.


UUP Update…US Dollar ETF

Many investors are giving up on the US dollar as it has been consolidating for some time now. There is a pattern on the shorter term daily chart which is starting to come alive, but needs a little more work to complete.

Below is a daily chart for the UUP which is still showing bull market chariteristics as it has been forming higher highs and higher lows which is creating an uptrend. I have shown you many cases of a classic H&S pattern when the price action forms the left shoulder and head inside of a wedge with the right shoulder low forming on the backtest or fairly close to the backtest to the top rail of the wedge pattern or neckline symmetry line.

In mid September we looked at this blue bullish falling wedge which could have been a stand alone pattern that could have started the next impulse leg higher for the UUP. As you can see the price action failed to take out the top of the blue falling wedge. That suggested to me a bigger consolidation pattern is most likely to form. It will still be a consolidation pattern but a slightly bigger consolidation pattern. Just like the daily PM combo chart we looked at this morning with the uncompleted expanding rising wedge building out the UUP also has an uncompleted H&S consolidation pattern under construction.

Note how the left shoulder and head formed inside the blue bullish falling wedge with the right shoulder low testing the neckline symmetry line today. Again, keep in mind this H&S consolidation pattern won’t be complete until the neckline is broken to the upside. If the low this morning holds support on the neckline symmetry line the last order of business is for the UUP to rally above the neckline to complete this high level consolidation pattern.

Below is a longer term daily chart which shows an even bigger H&S bottom building out. There is some really nice symmetry taking place on this chart starting with the neckline symmetry line which shows the low for the right shoulder. The small H&S consolidation pattern we just looked at on the daily chart above is also showing a neckline symmetry line which is showing the bottom for the right shoulder as well. On the left side of the H&S the UUP built out a H&S top which led to the February bottom this year. Now we have a H&S consolidation pattern forming on the right side of the head that somewhat matches the H&S top on the left side of the chart but inverted. As you can see the UUP is trading at a critical area on the chart. The implacations for many different areas of the markets will most likely be profound if this 15 month H&S bottom completes.

Below is the HUI, UUP and GLD combo chart we’ve been following which has done a little morphing, but the main theme of this area being a place for some type of consolidation pattern to build out is still in place. Each has been testing an important trendline over the last two days. Will they hold is the $64,000 question?


Late Friday Night Charts…The Chartology of Gold and Silver

Several weeks ago we looked at some resistance points for gold and silver from the short  to the longer term time perspective. Below is a daily chart for gold which starts with the 2018 five point rectangle reversal pattern which broke down in May. The backtest to the underside of the five point rectangle took about five weeks to complete, forming a bearish rising wedge. From that point the impulse move down began in earnest stopping in mid July to form a small rectangle. After trading sideways for about three weeks gold broke down from that small rectangle and finally bottomed in mid August where it began a countertrend rally.

The countertrend rally stopped at the bottom of the small July rectangle where support turned into resistance as shown by the black dashed S&R line at 1215 which is our first line in the sand. There is also the top rail of the expanding downtrend channel and the 50 day sma which are also offering resistance.

In order to find the next important area of overhead resistance we need to look at a long term weekly chart going back 15 years which shows the possible massive H&S top. The backtest to the neckline comes into play around the 1235 area and if the backtest fails to hold resistance then the last important line in the sand is the bottom rail of the 2016 triangle which is around the 1265 area. As we’ve discussed so many times in the past, it’s now up to the bulls to show us they mean business by first taking out the 1215 area followed by the 1235 area with the last important line in the sand at 1265.


This last chart for gold shows the 2011 parallel  bear market downtrend channel with the 65 week ema at 1265 that does a good job of holding support during a bull market and resistance during a bear market impulse move.

Just like gold, silver also built out a 2016 triangle and backtested the bottom rail this week at 15 which marks our first area of overhead resistance. As you can see on this long term monthly chart, silver like gold, also has a massive H&S top in place along with its 2011 bear market downtrend channel.

This last chart for silver is a 50 year look which shows its massive 25 year double H&S bottom along with its 2011 bear market downtrend channel and its 2016 triangle. Note the blue triangle that formed way back in 1974 which separated the first impulse leg up from the second leg.

As the charts above show there is some near term resistance at 1215 for gold and 15 for silver which are basically being tested right now. Patience is the key going forward until they either begin their next impulse leg down or breakout above overhead resistance. Have a great weekend and all the best…Rambus


XEU & XJY Update…

Sometimes a stock can push you just far enough to make you doubt the validity of your analysis just at the most opportune time. Such has been the case for the US dollar where all the evidence strongly suggests it’s in a bull market. I’m not going to go into a lot of detail right here, but I want to show you a couple of charts for the XEU and the XJY that still suggest they’re weak compared to the US dollar.

This first chart is a daily bar chart for the XEU which shows the possible H&S top building out. The last time we looked at this chart the price action was building out the right shoulder with the neckline symmetry line showing the height of the right shoulder. As you can see the XEU traded slightly higher than the neckline symmetry line which for a few days looked like the possible H&S top maybe failing. Note the gap above the neckline symmetry line and now the gap below the neckline symmetry line which shows an island reversal above the neckline symmetry line, see sidebar for more clarity. The year plus H&S top is still in play IMHO.

Next is a longer term daily line chart we looked at that shows how symmetrical the left and right shoulders are as shown by the black rectangle that measures time and price. This potential H&S top won’t be complete until support is taken out around the 112 area where the neckline and the top rail extension line come into play.

Below is the weekly look for perspective.

The XJY on the other hand has been straight forward in its impulse move to the downside after competing the backtest to the year and a half bearish rising flag formation. As you can see the price action is now trading slightly below the initial breakout low just before the backtest took place.

Below is a little more detailed look at the XJY chart from above which shows the backtest to the bottom rail formed a bearish rising wedge on this daily bar chart with the 200 day moving averaging helping with resistance.

The XJY has actually formed one of the biggest consolidation patterns of all the important currencies that makeup the US dollar.  While many of the currencies started to build out their consolidation patterns starting at the beginning of 2016 the XJY started to build out its consolidation pattern in the middle of 2015 creating a three year symmetrical triangle. The bearish rising flag we just looked at on the daily chart above is just a part of the bigger three year triangle consolidation pattern with its bottom rail broken simultaneously with the bottom rail of the three year triangle.

Looking at the different currencies that make up the US dollar gives you a more accurate picture for what direction the US dollar is likely to move especially in the intermediate to long term.