In deference to Mark Twain, I will review the USD, general stock market, precious metals, the electric metals and various other topics. In the past two weeks Rambus has been so prolific with such high impact charts that I find it a challenge to offer value added material so I offer charts with some different perspectives.
USD-No I Am NOT Dead Yet!
Currencies tend to be a very emotional subject. I try to be objective when analyzing them, sticking to the language of the market and it’s message. It is always important to guard against the gold bug narrative, it can even influence our views of currencies. Demanding posts insisting the USD is toast and immediately headed towards history’s ash heap seem closely related to this gold bug narrative. The USD has spent the first 8 months of 2017 in a well defined downtrend, however it does not appear to be in a death spiral. Actually the shouting and insistence that it must continue down has been a fairly predictable sign that its move downward was reaching its limit. The dollar may have now completed a base and is set to continue its move higher. This is not dogma as it could reverse downward, but for now it’s making all the right moves if the trend is higher.
Please review Rambus’ October 25 post on the USD as there is no other finer analysis anywhere:
Early Weekend Report…The Dollar Post
I have often made the point that we are in a post bubble contraction. It began with the financial crisis in 2007, however the central banks of the world and their interventions have truncated the natural corrective process and re-inflated the bubble due to financial engineering. Ultimately, if robust growth is to ever return to the world’s economies the PBC must be allowed to do its work in de-levering balance sheets. Historically in the previous 5 episodes over the past 340 years, PBCs have taken 15-20 years to accomplish this. So this is a slow process and the 8 month downtrend of the USD in 2017 could just be a little wiggle that turns out to be just a correction in an ongoing up-trend. Time will tell of course. In a PBC, the senior currency becomes chronically strong and acts as a magnet attracting capital flows from around the world. Over the past year this economic principle has been very hard to accept, however it may be getting ready to reassert itself. I personally don’t trade currencies, however I watch them since they drive asset classes and knowing their trend gives us a clue of where these assets will themselves trend.
It appears we are at a crucial point in currency markets as the USD is beginning to reassert itself. Lets look at the various currency charts vs the USD:
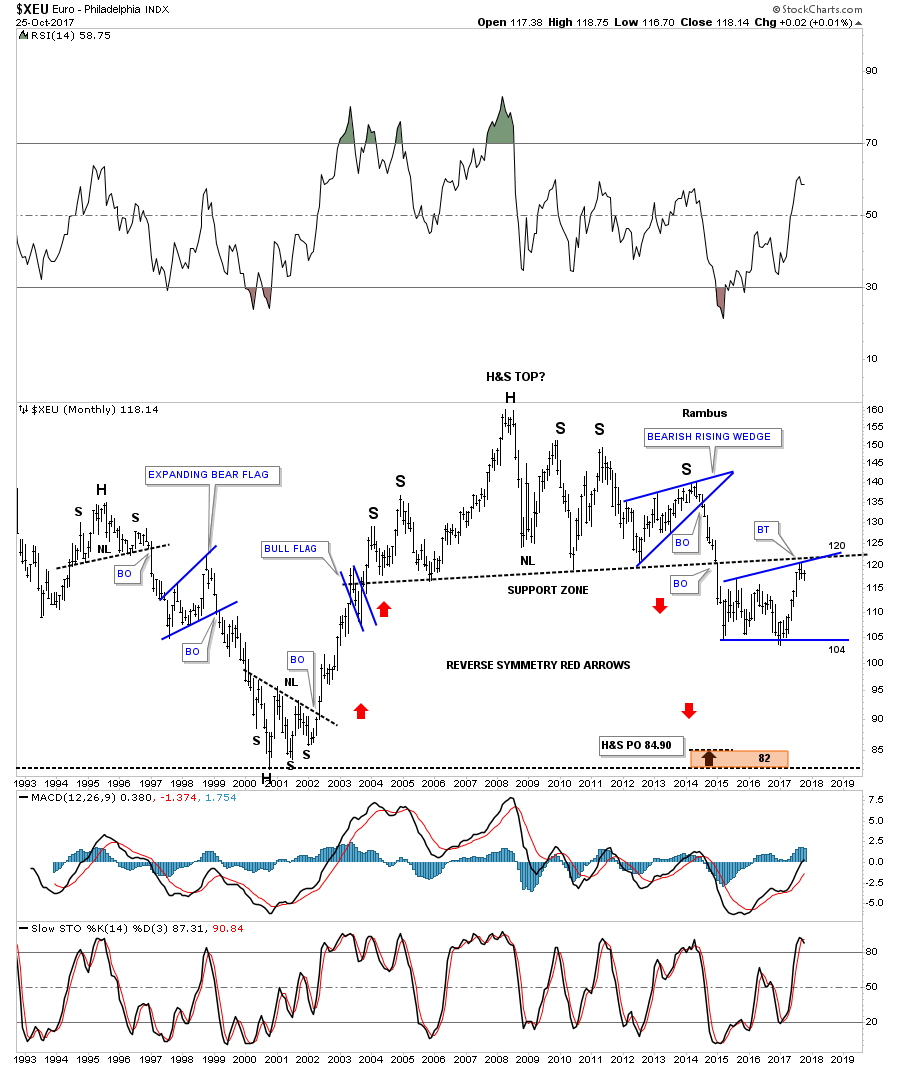
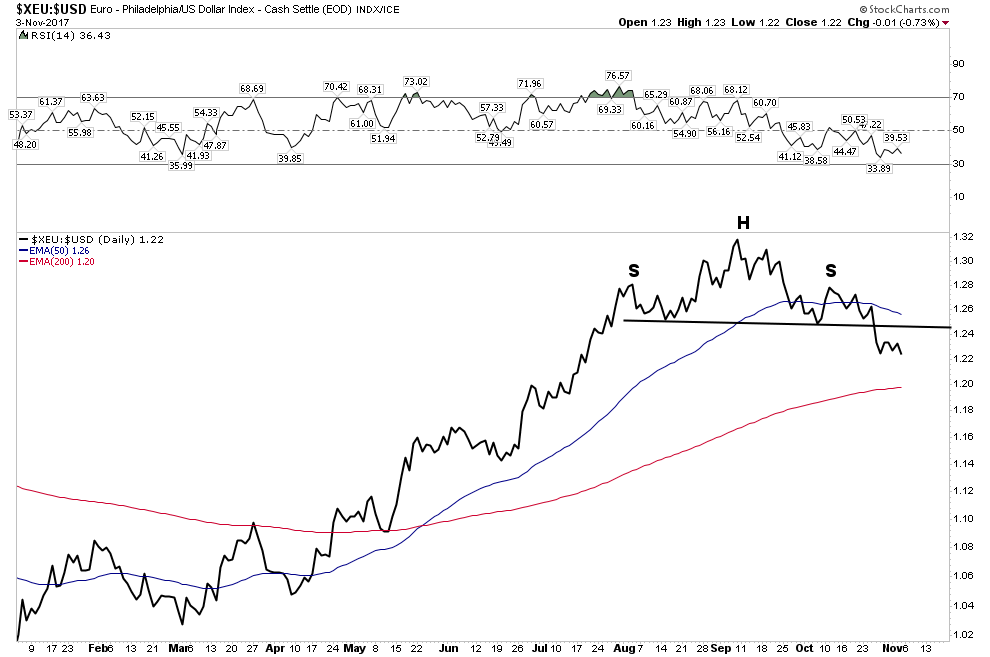
Euro- H&S neckline now broken:
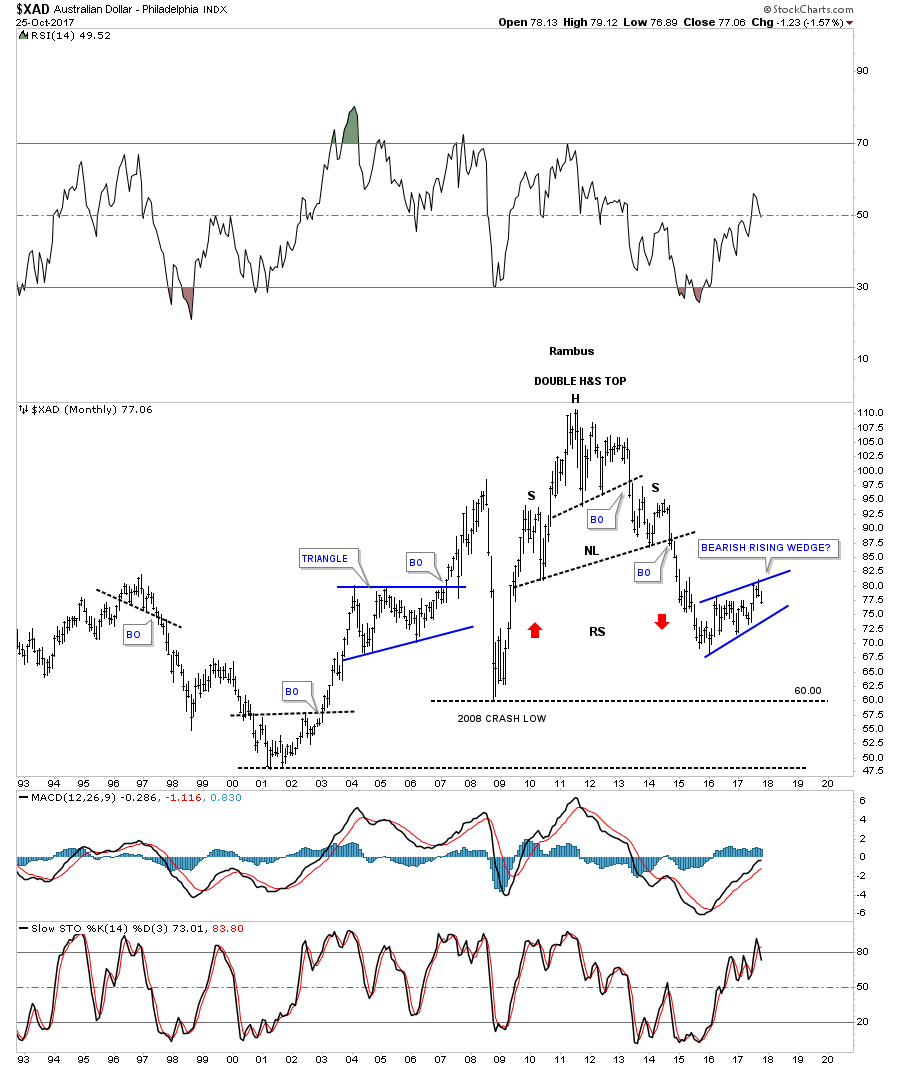
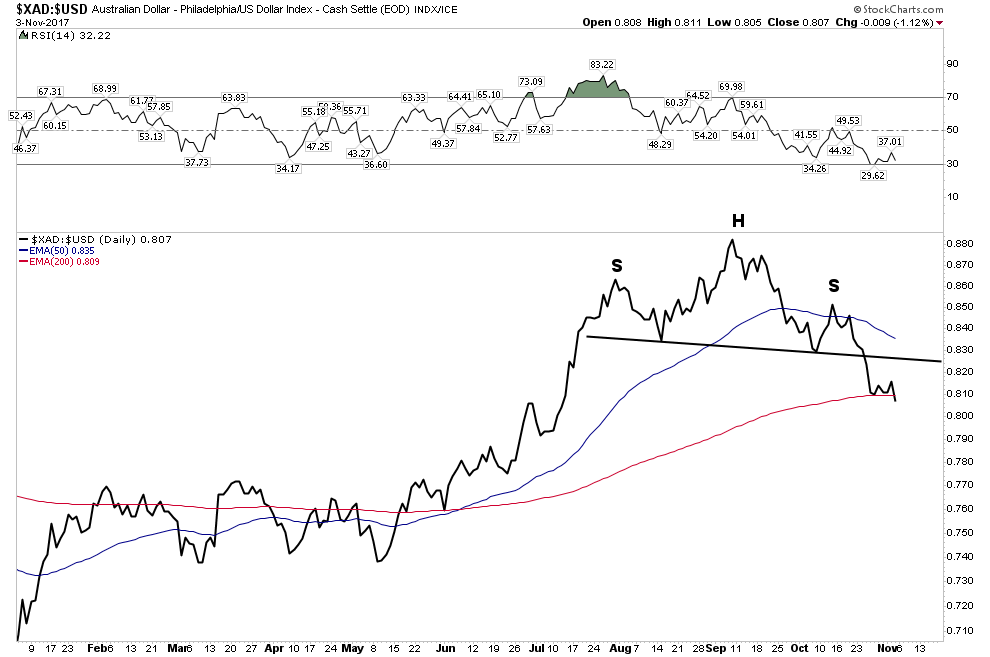
Aussie Dollar– H&S break with price now violating the 200 EMA
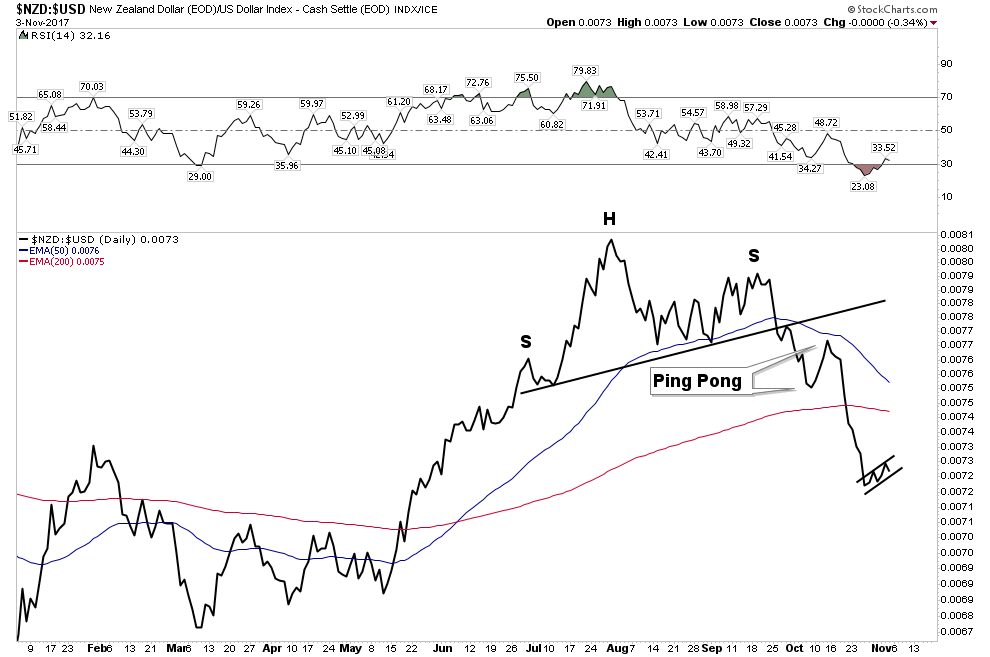
NZD– The first to show its hand
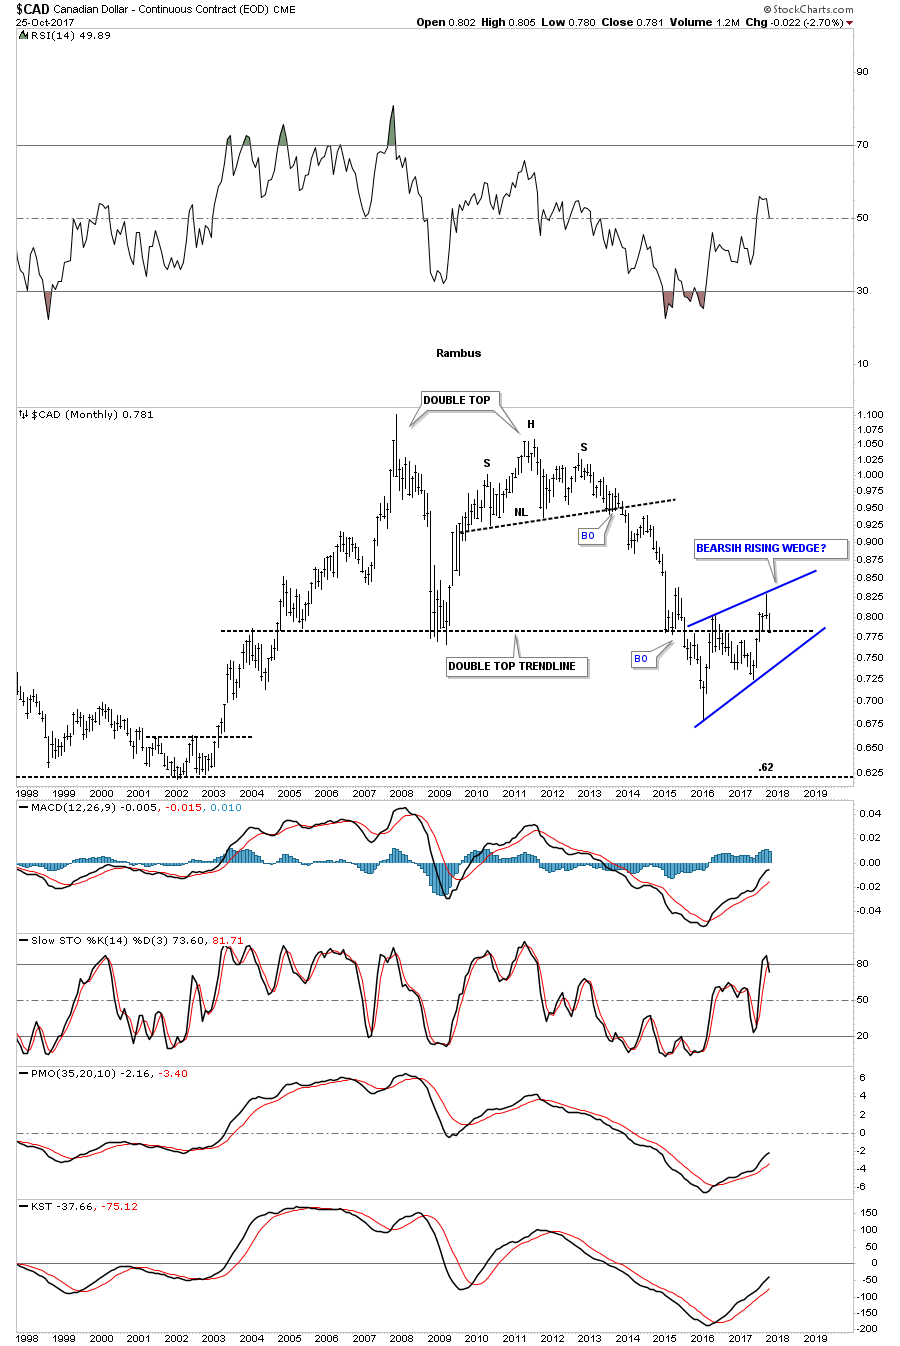
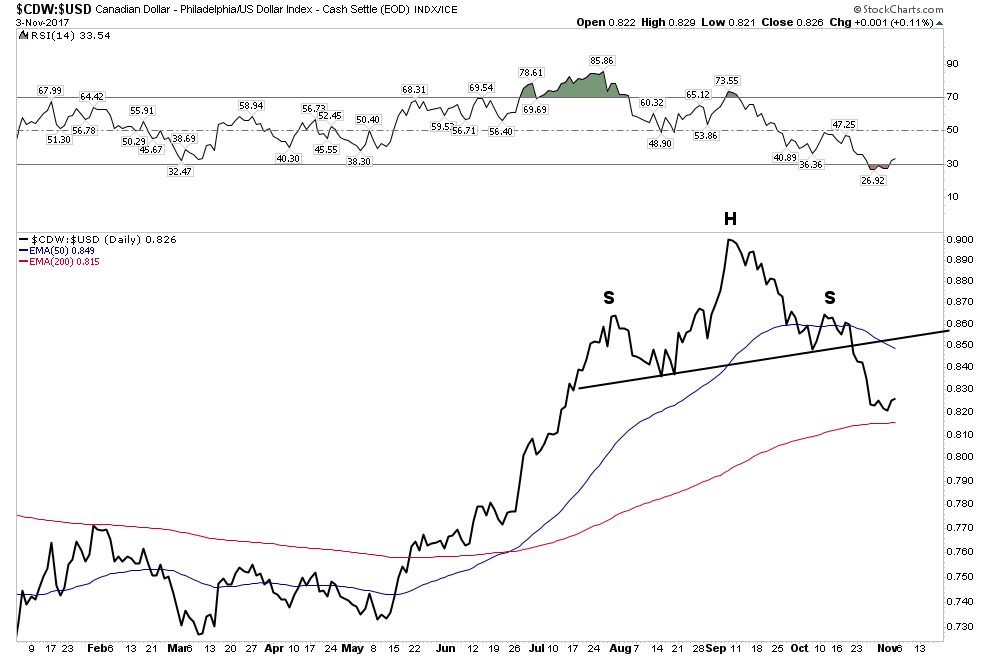
Canadian Dollar– The ultimate resource currency
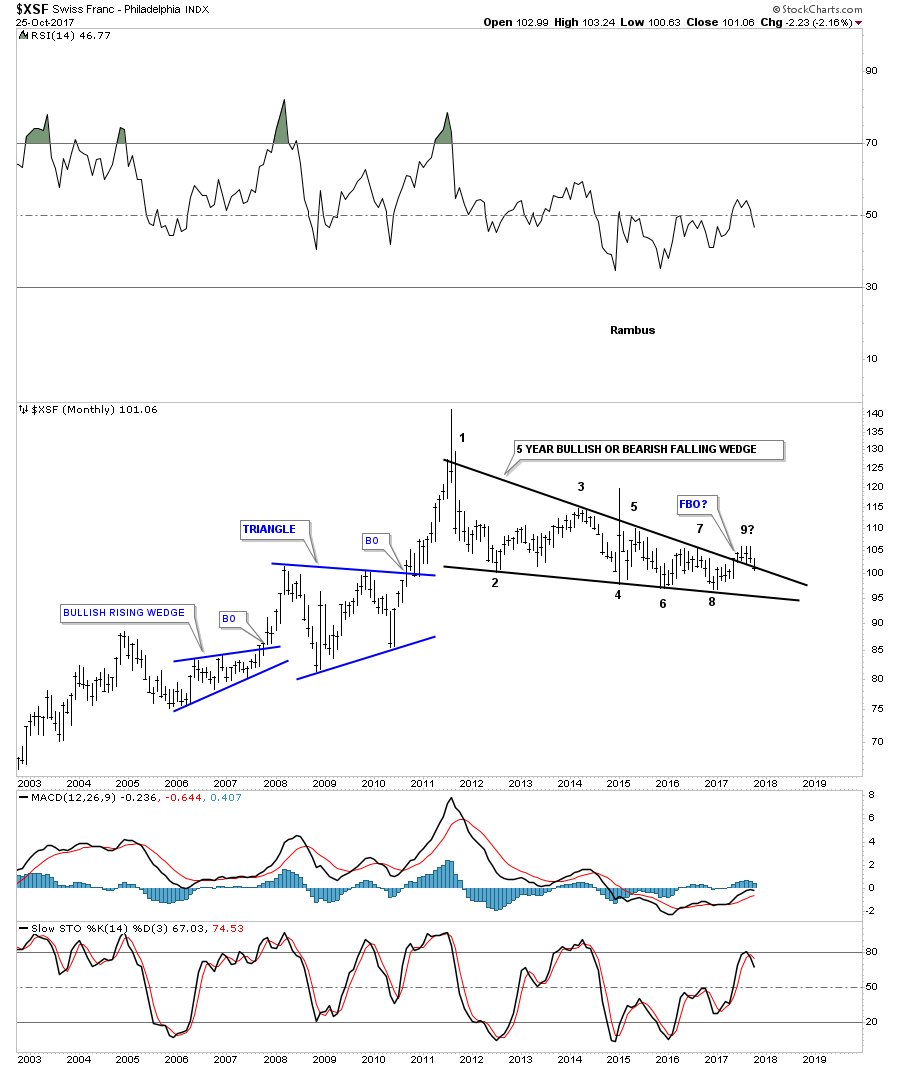
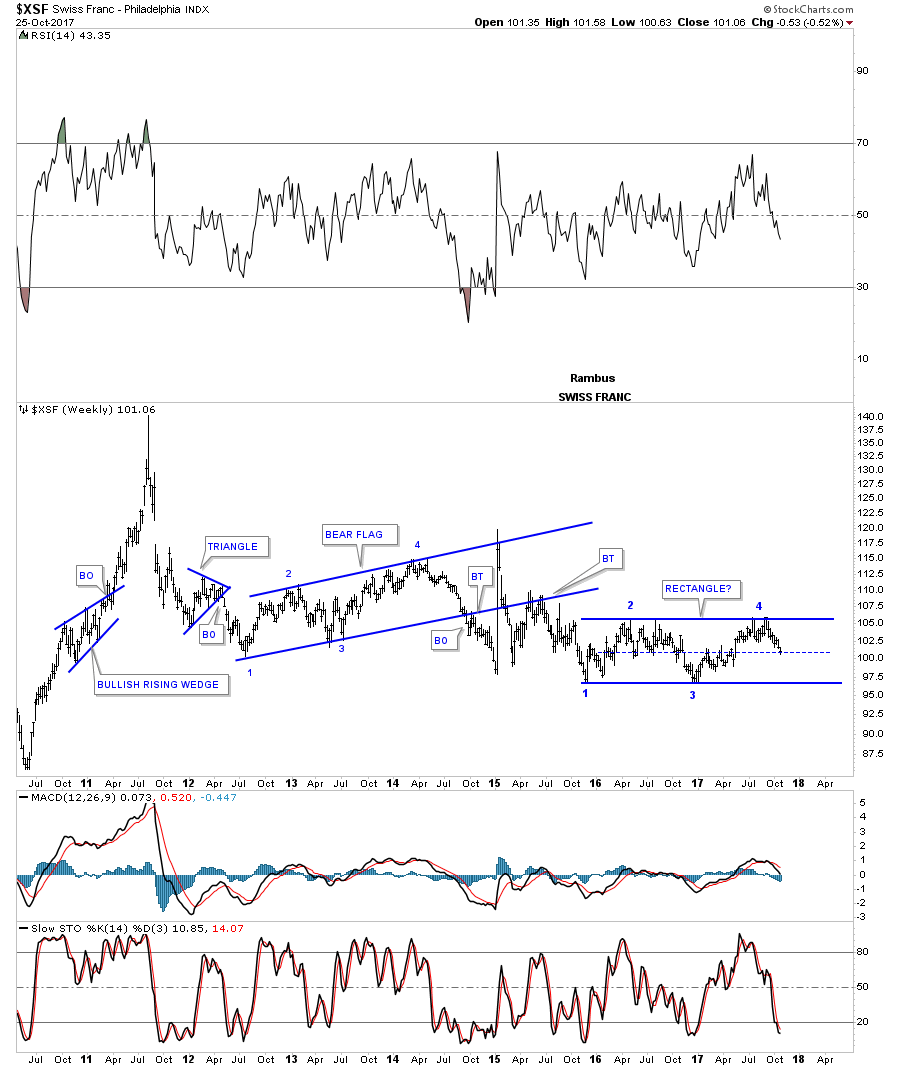
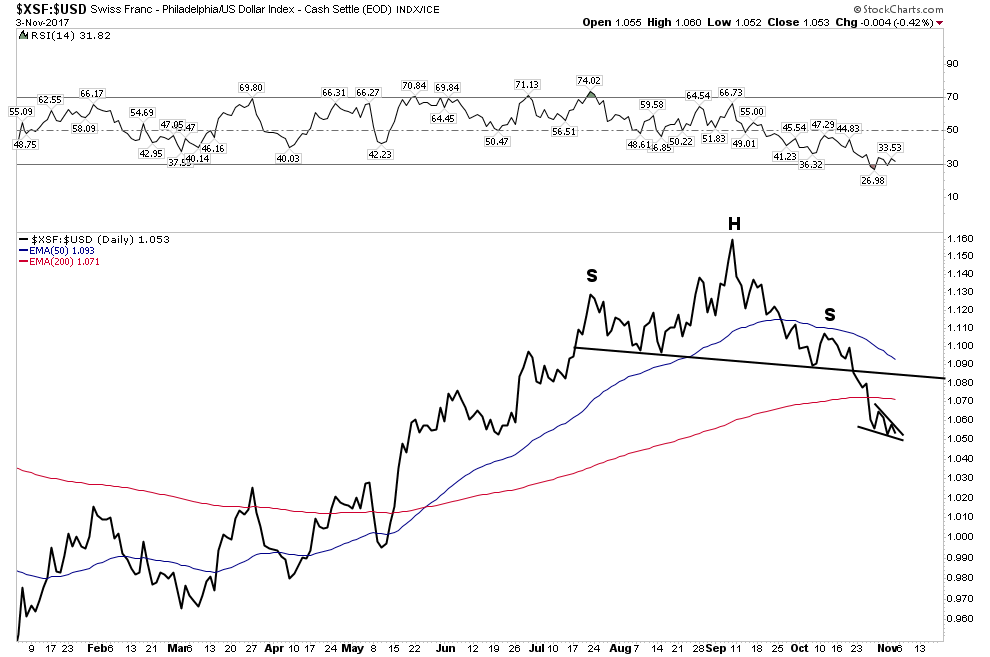
The Swissie: Et tu? Even the ultimate haven currency… 200 EMA violation.
South Africa Rand:
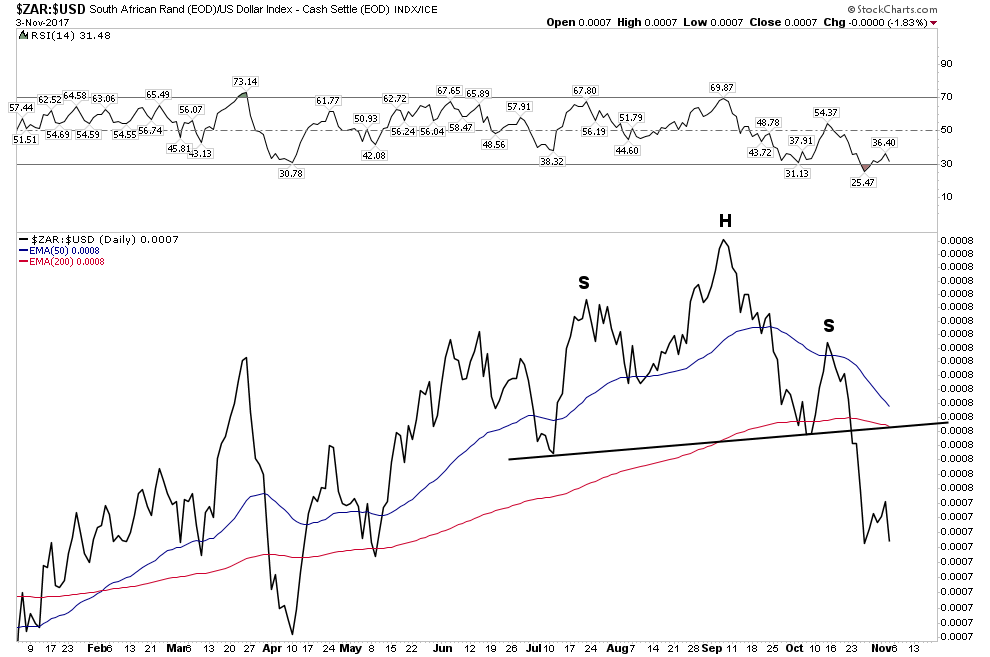
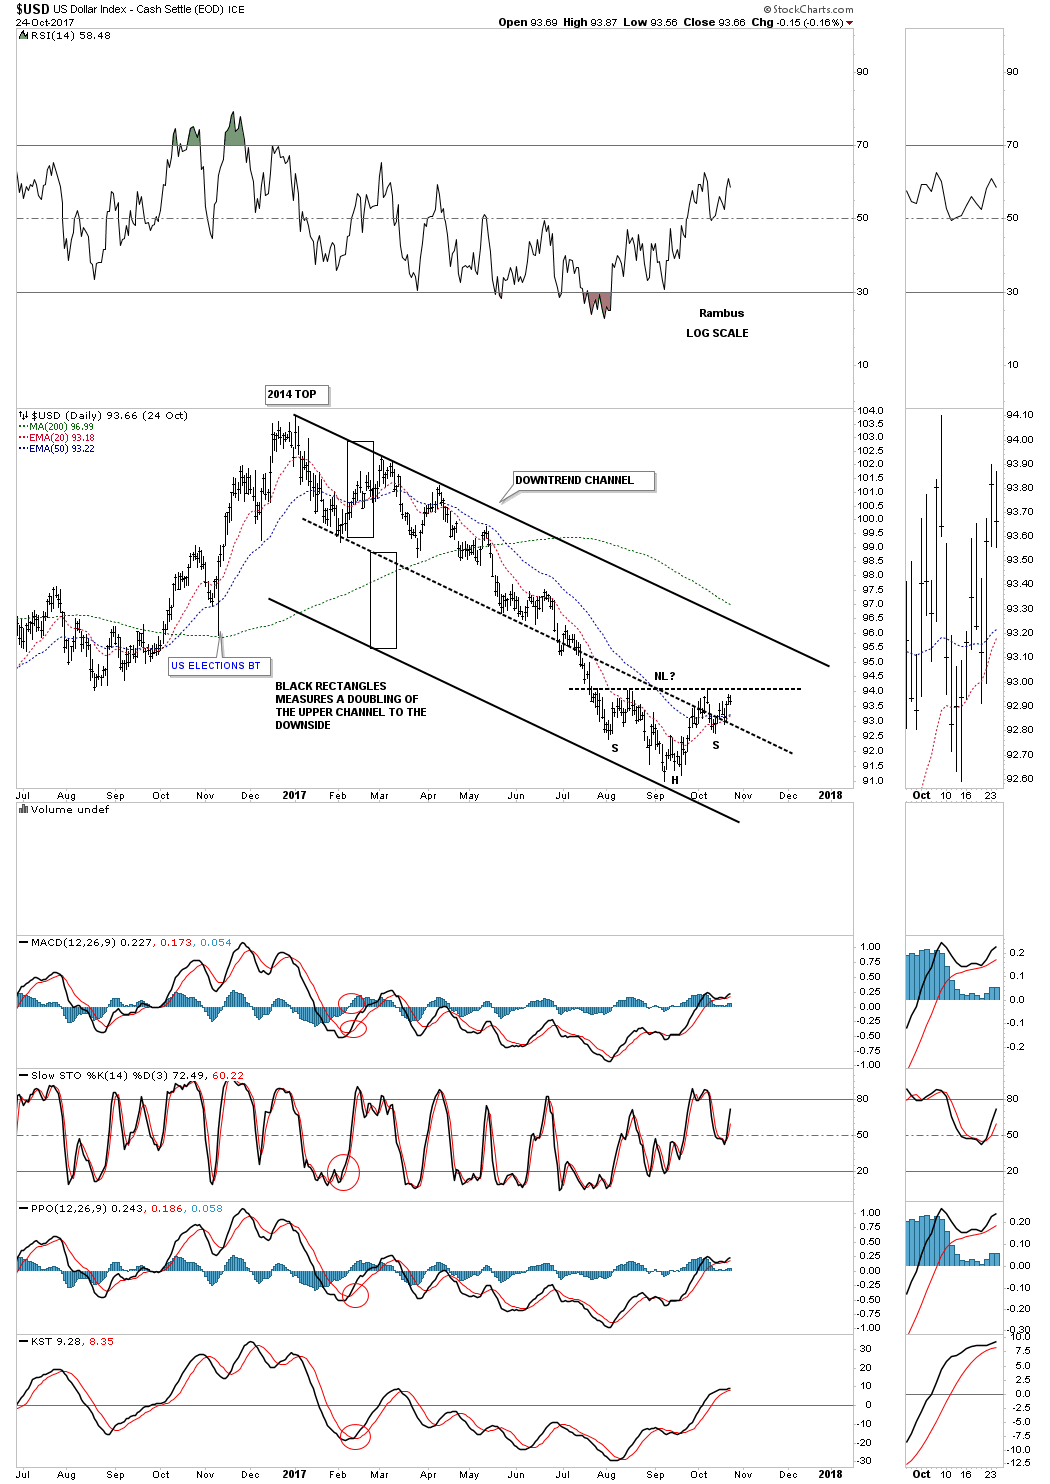
So one can see all of these currencies are now in a broad based breakdown vs the USD. The USD took some time to gain traction and it’s NOT out of the woods yet, but these charts show that it would take some work to reverse this initial trend reversal.
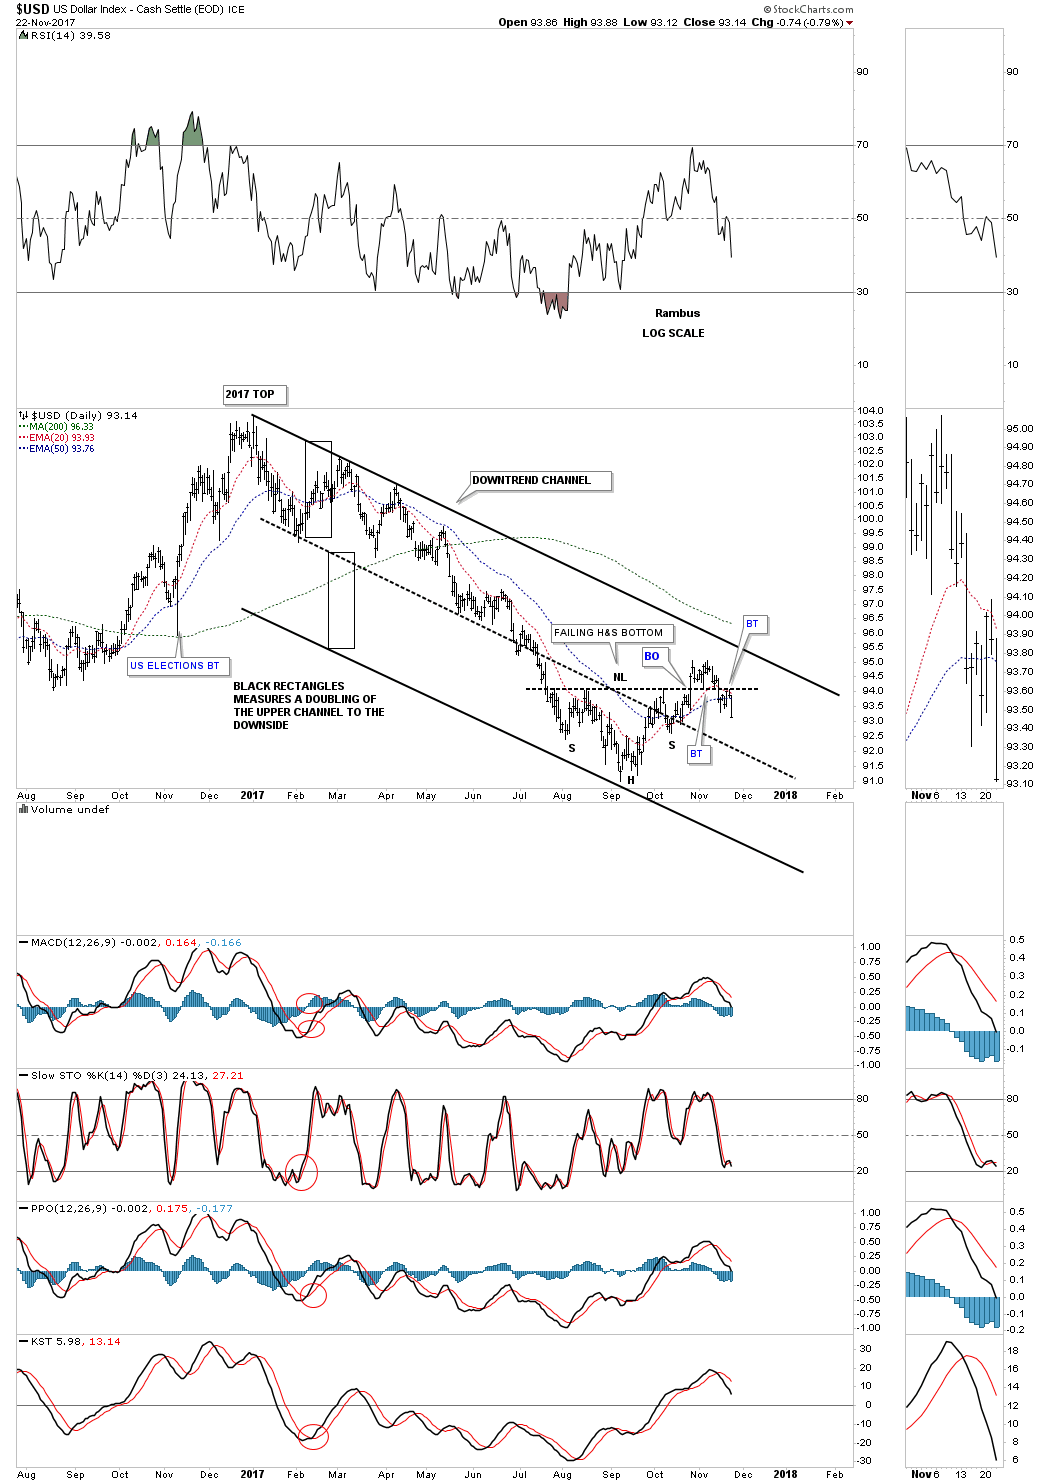
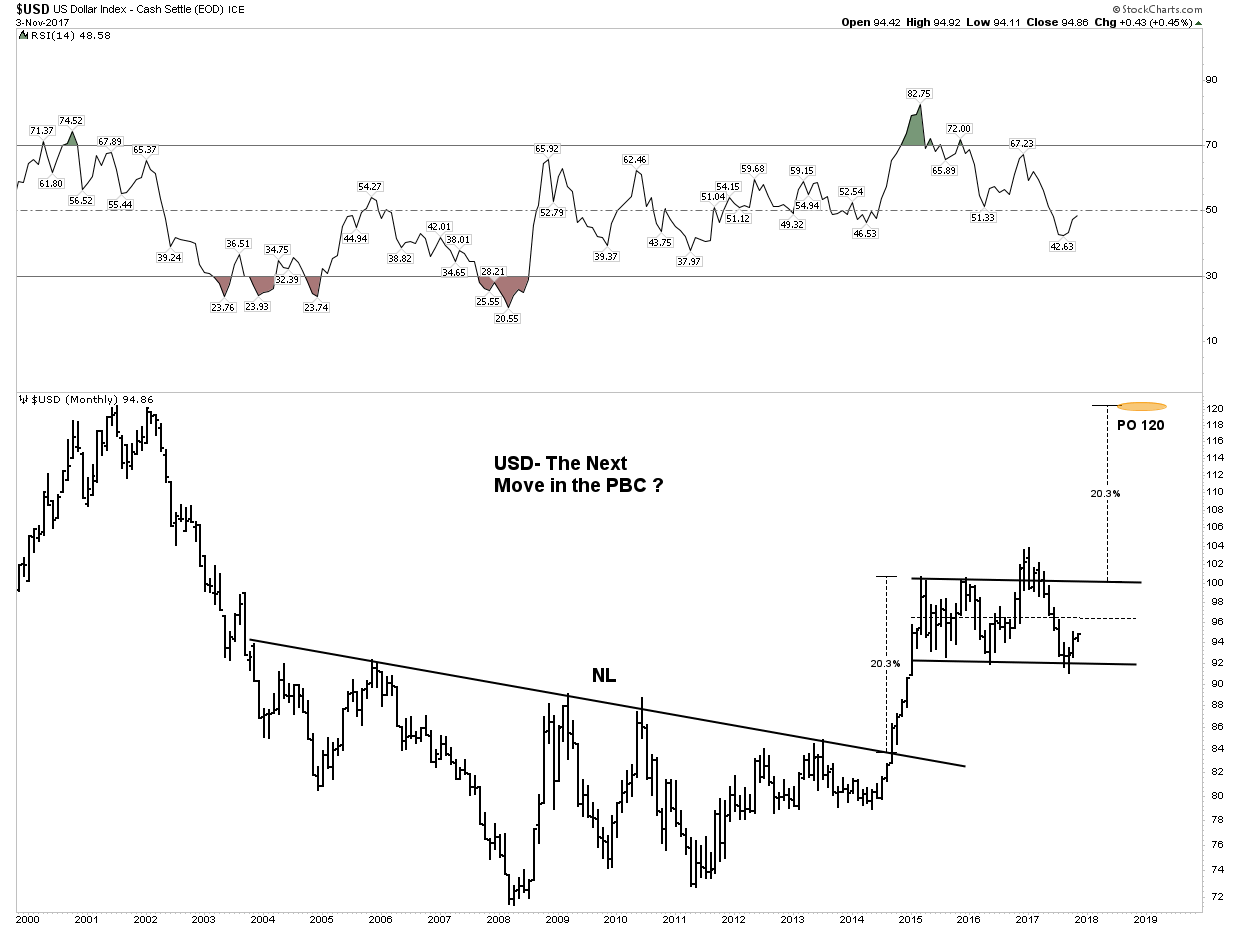
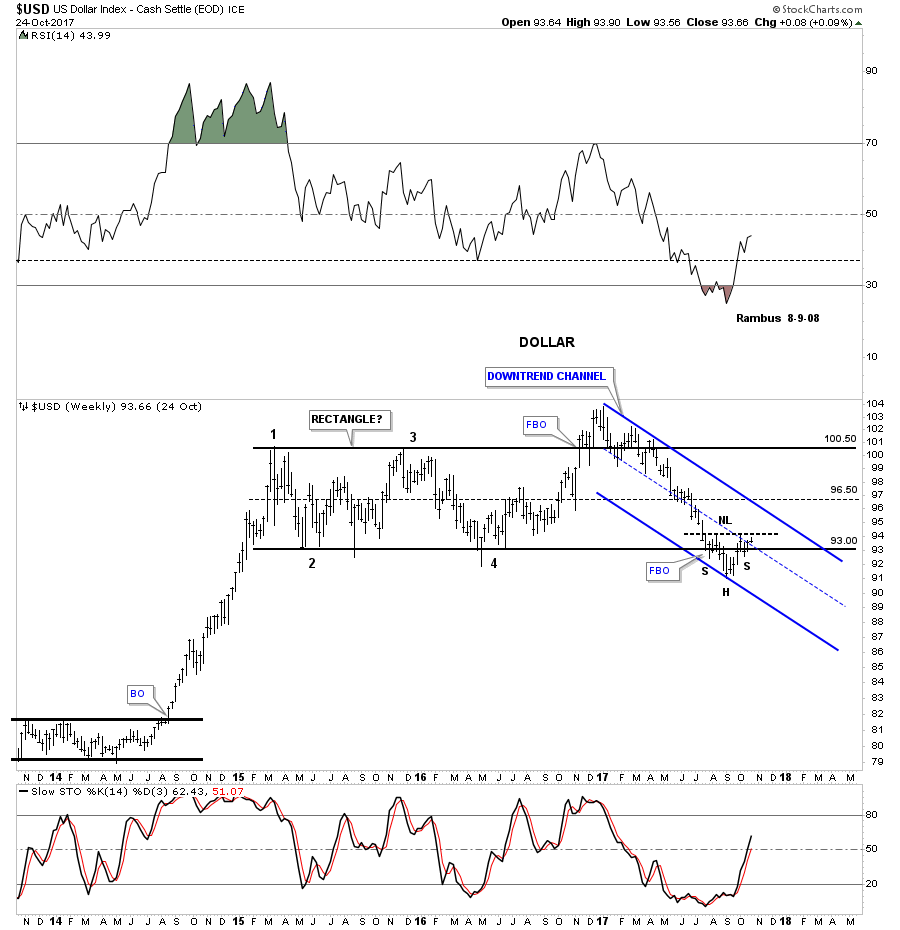
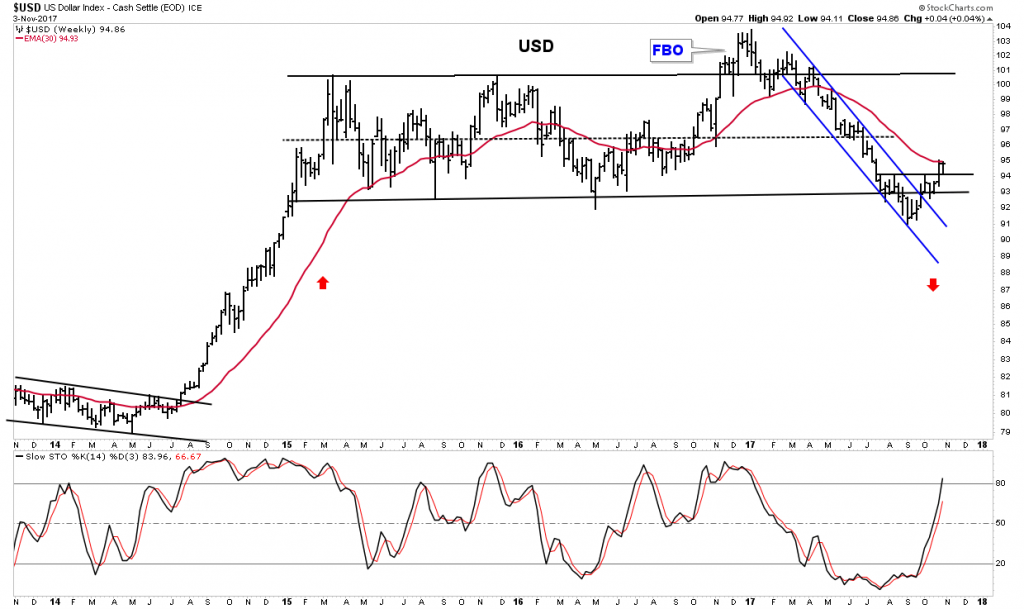
In the chart below we see how the USD has broken above its lower horizontal channel line and is now attempting to overcome the resistance of the 30 W EMA. Stochastics are indicating that it has the momentum to continue its move higher.
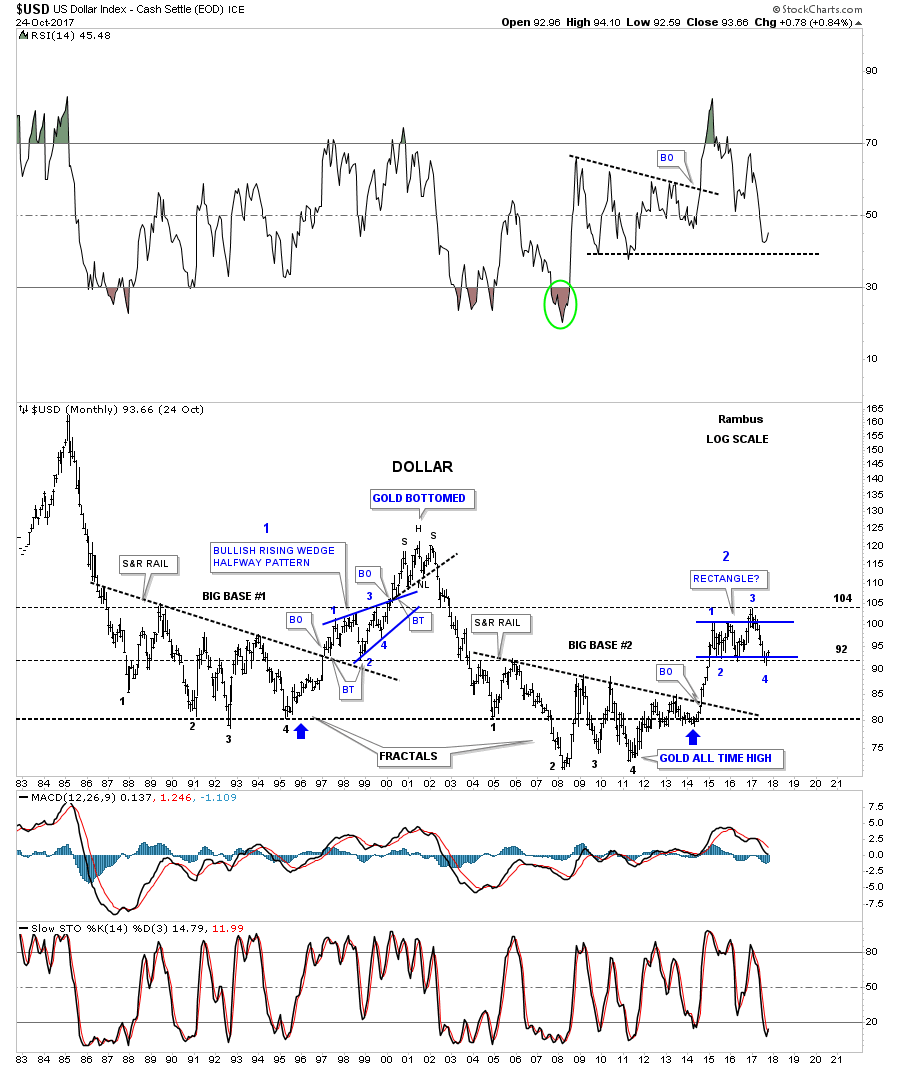
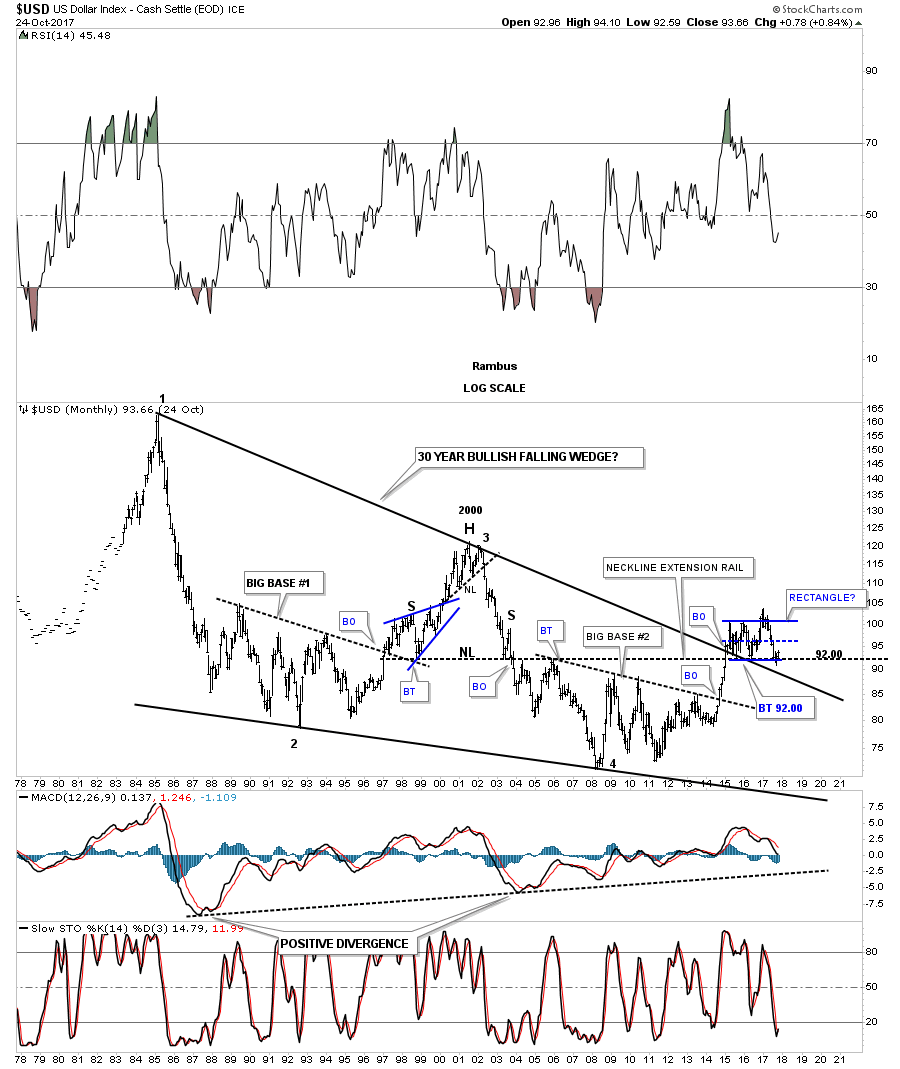
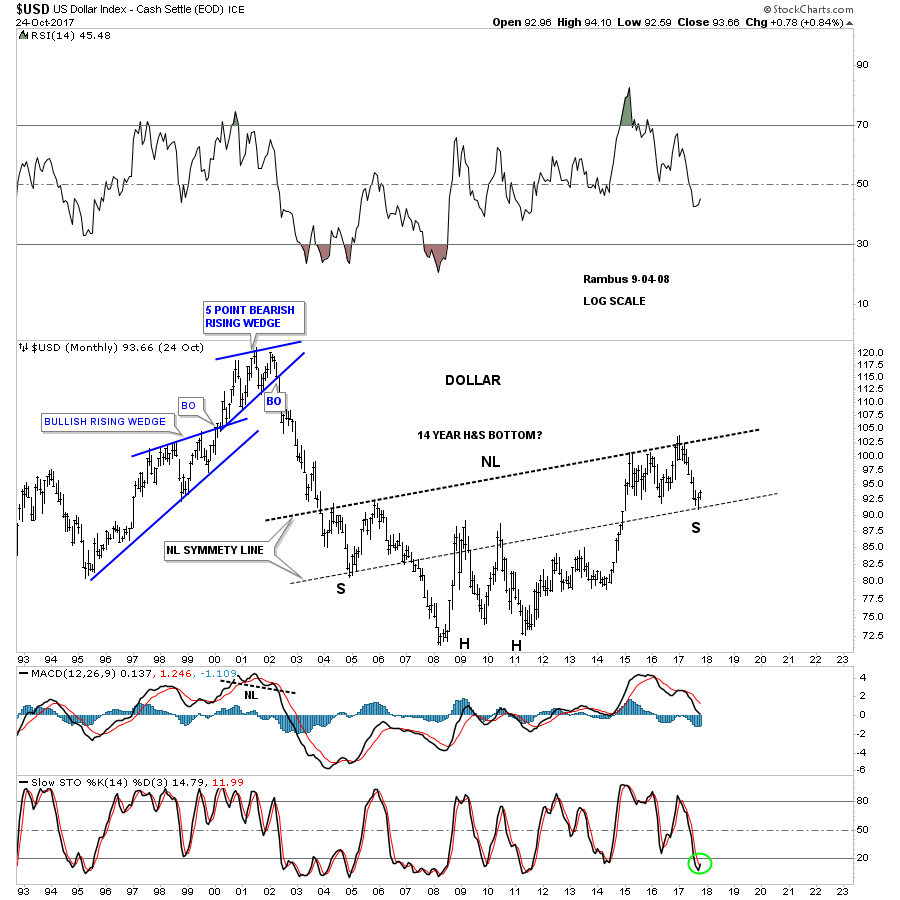
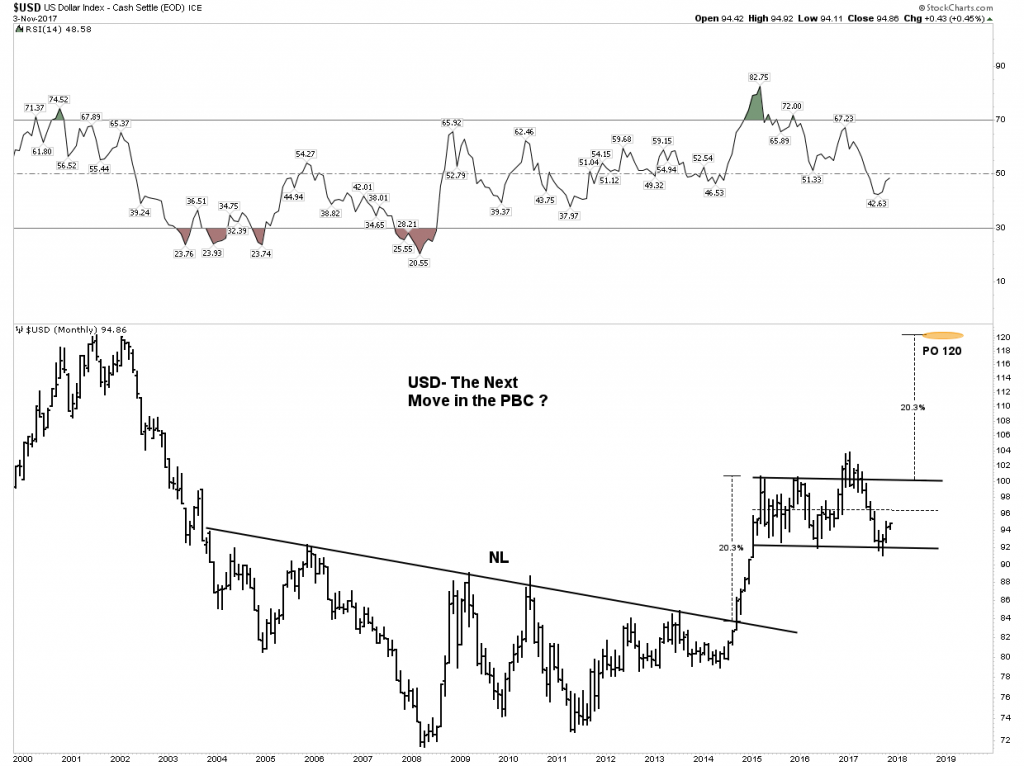
Below is the chart that has been subject to ridicule and derision, however it depicts what could occur when the PBC reasserts itself. It is certainly not a guarantee, however it shows what may lie in store.
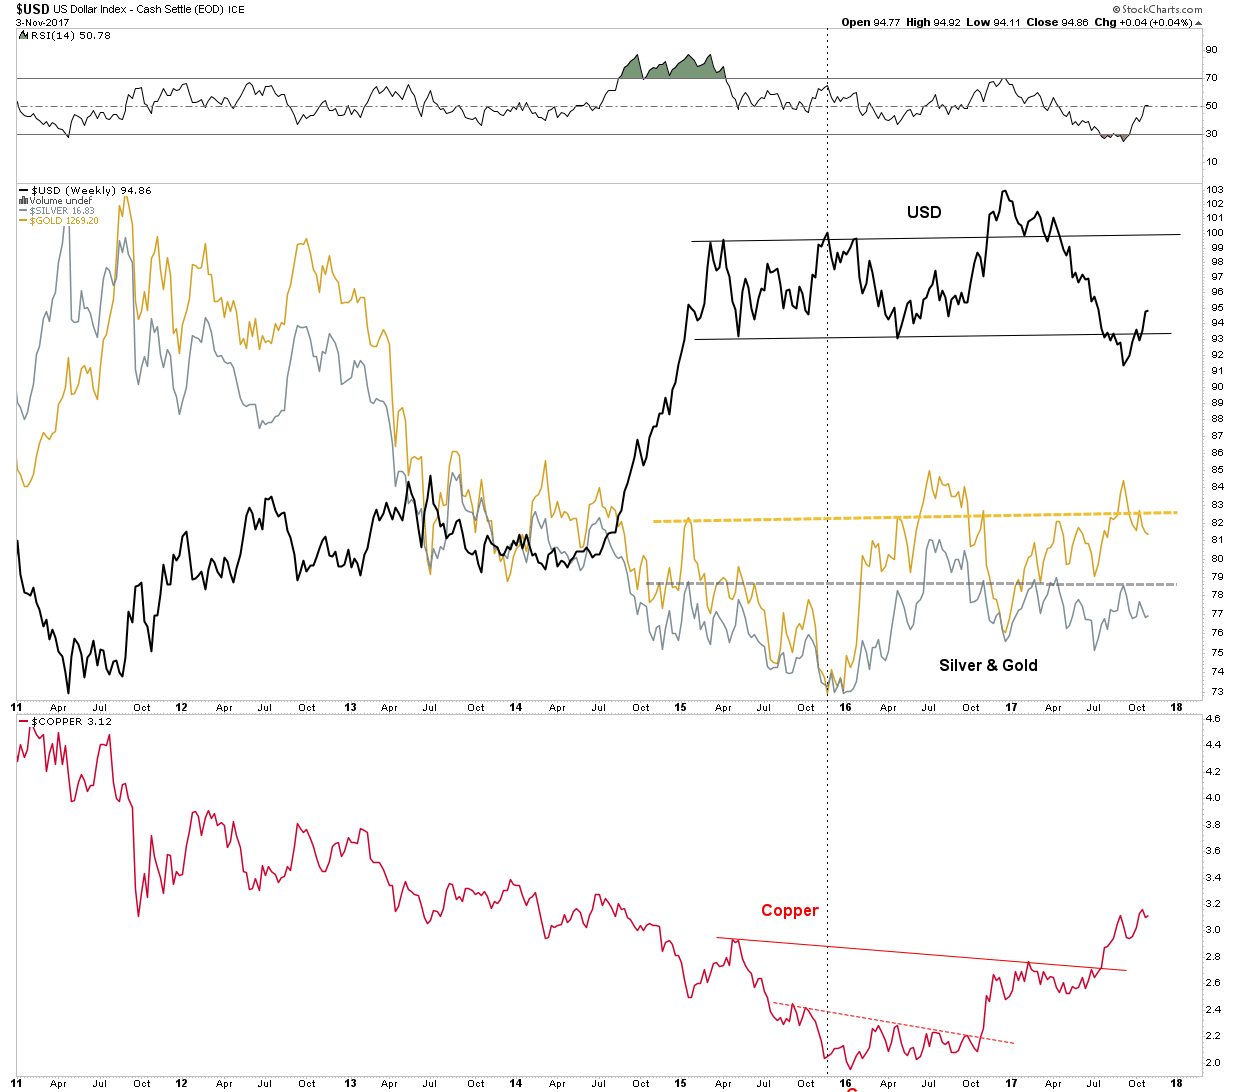
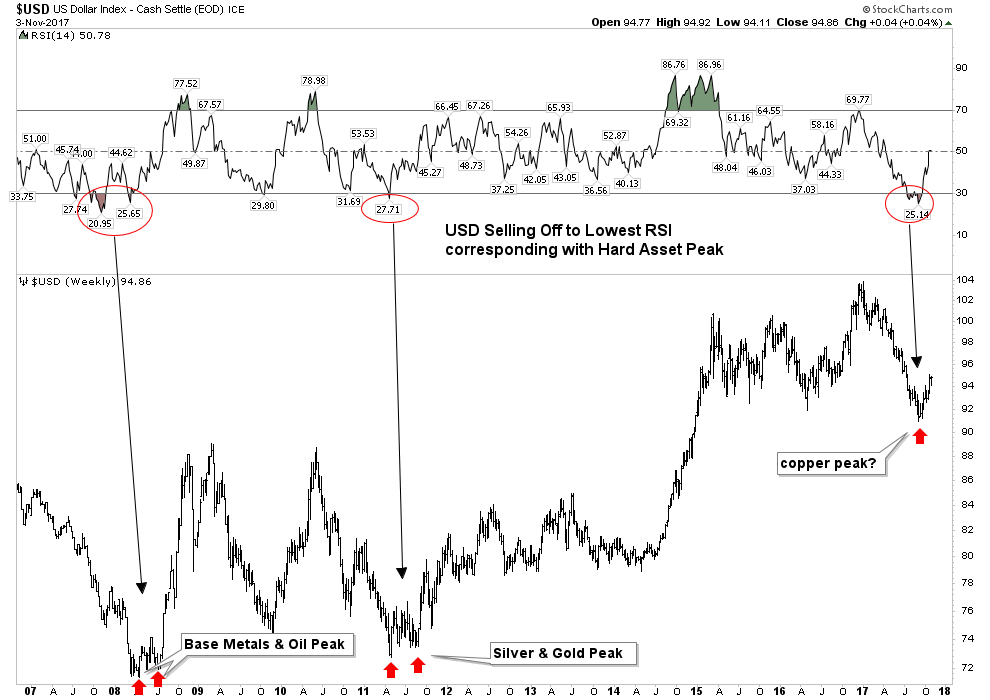
This next chart shows the relationship between the USD and the three metals: gold, silver and copper. It is hinting that if the USD continues to rally it could make it difficult for these three metals to advance much further:

Finally, this USD chart poses the question: are the industrial metals getting ready to end their run for now? It seems that in the past when the USD reversed from being oversold on the weekly that was the message:
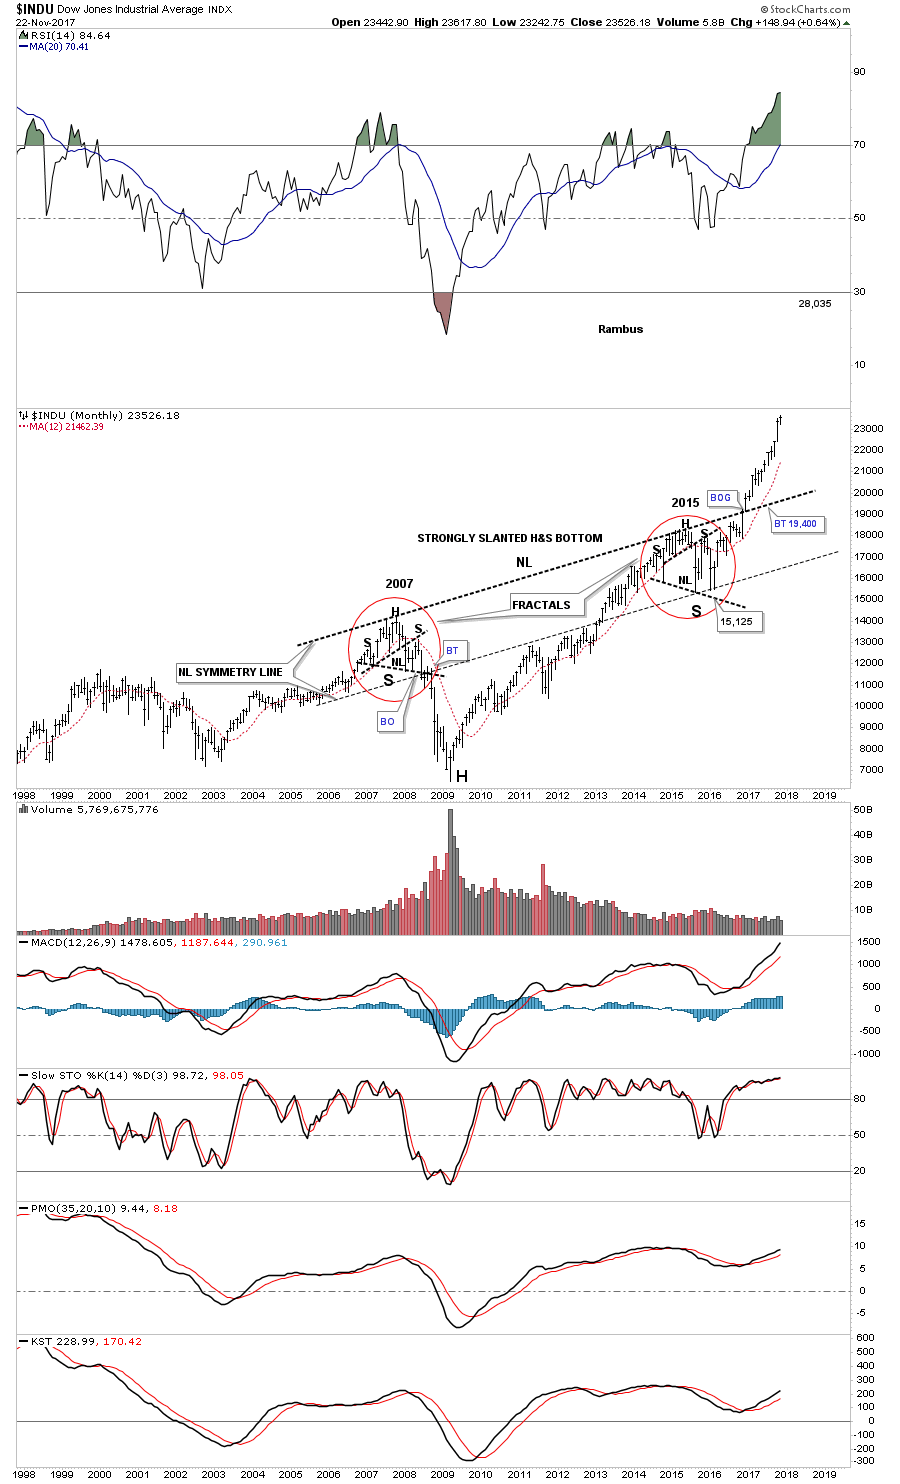
The Stock Market- From Here to Infinity?
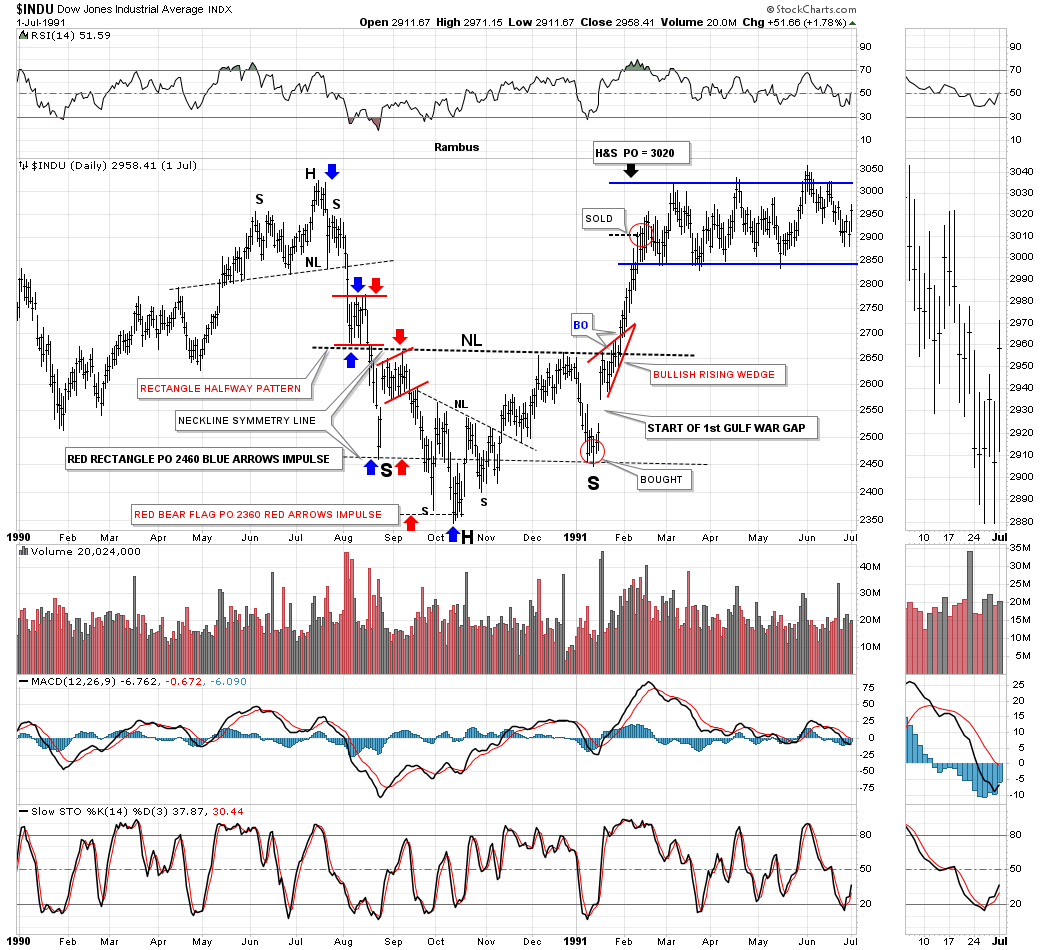
Rambus has shown that the move upward in the stock market continues to be unimpeded. I would concur with the caveat that early next year it may peak and end the 9 year bull market, so far the second longest in history. Momentum is still powering higher, however internal deterioration has begun to be evident. Here is one possible scenario for the ultimate top:
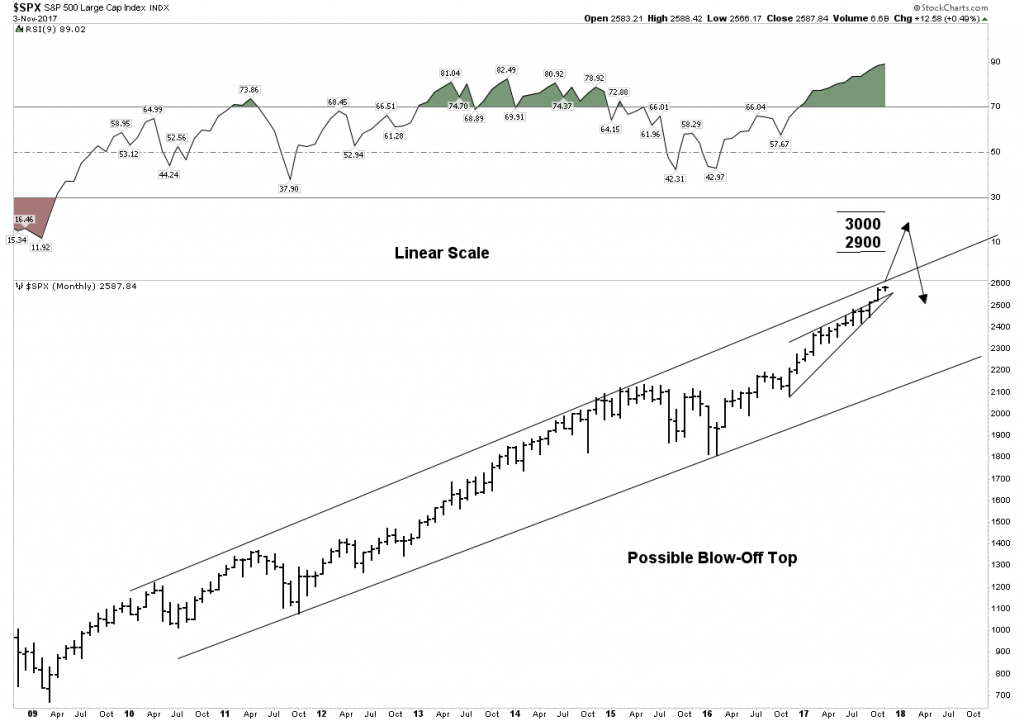
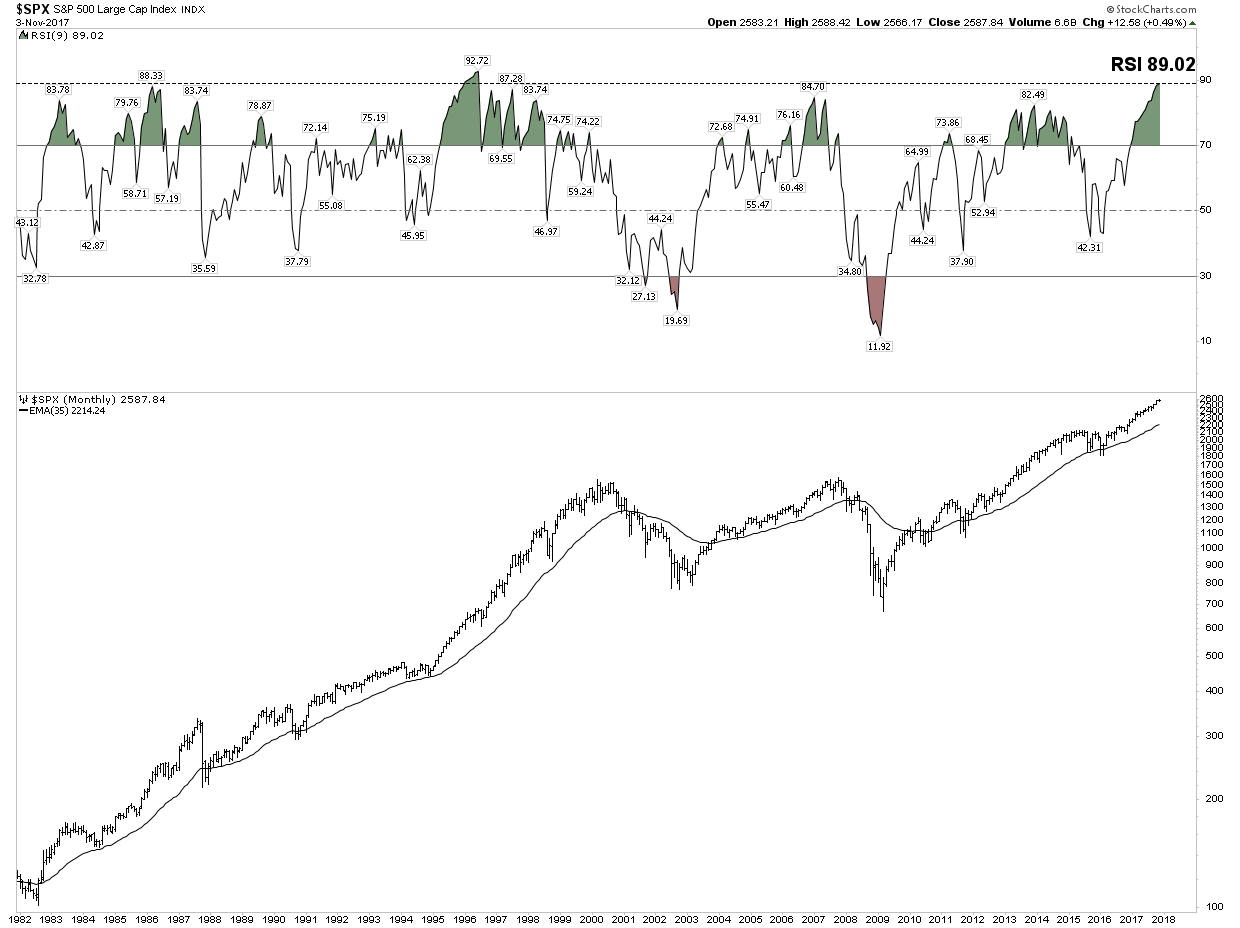
Above is a linear scale view of the 9 year bull market. It depicts a blow off top penetrating the upper trend channel with a target of 2900-3000. We see 3 phases to this bull market and the blow off would end the final phase III “mania”. Note the extreme reading in the RSI lending credence to this outcome.
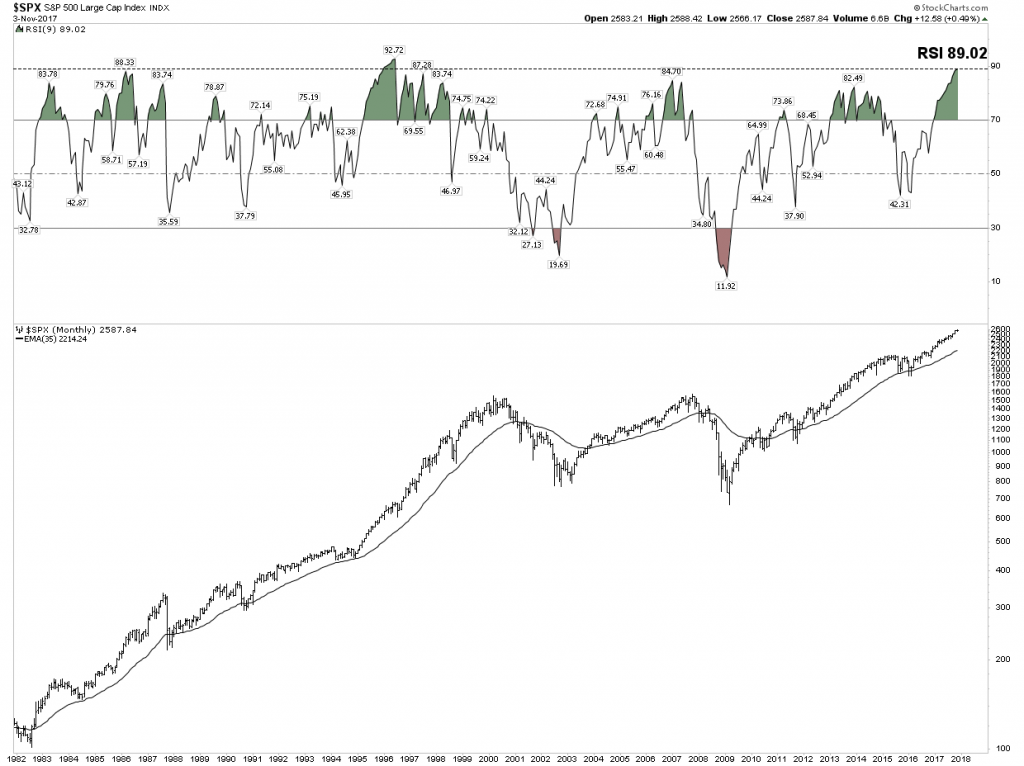
Below is a chart which highlights just how overbought and extended this market has become. It is a monthly view of the entire 36 year secular bull market. Note the RSI is now the second highest in the entire bull market. It is saying this relentless rise has reached a point where the RSI will limit its move.
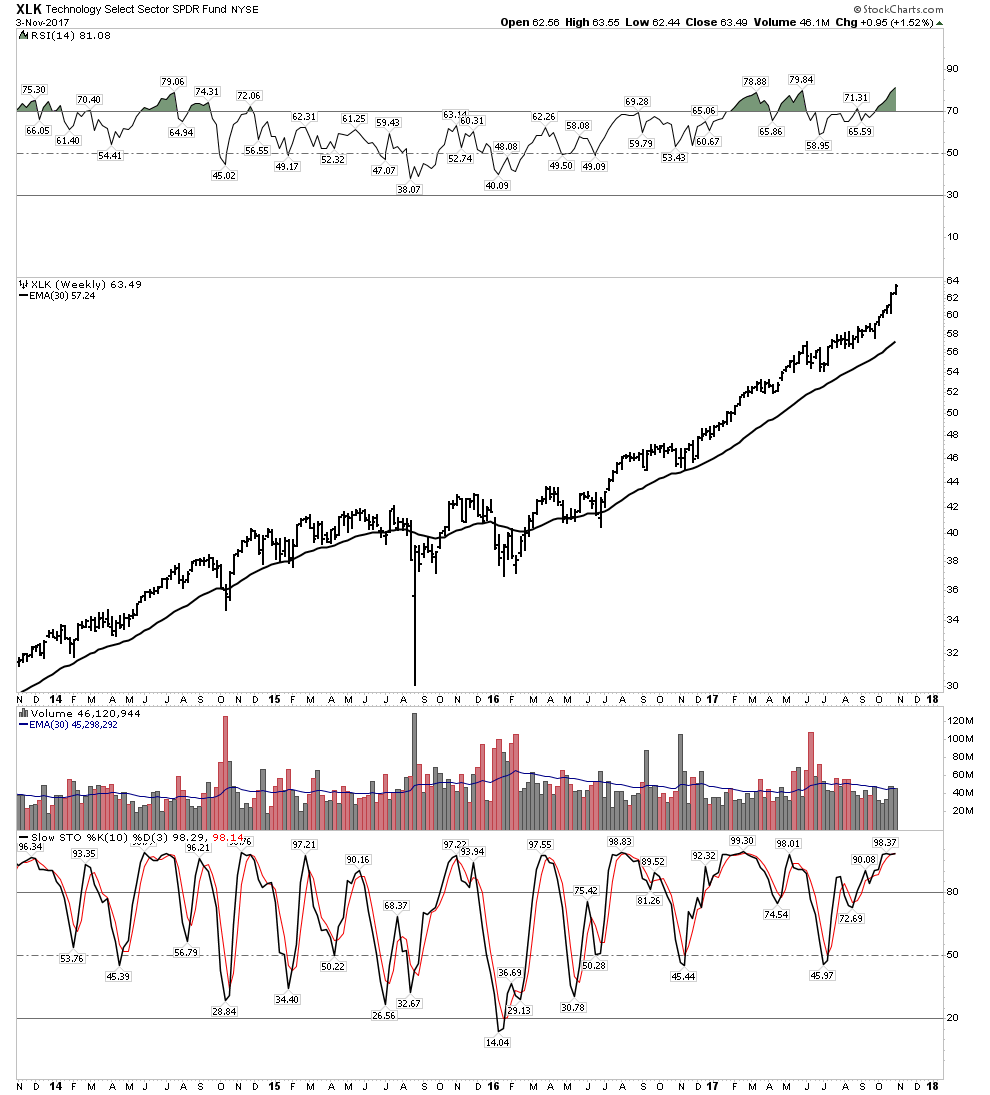
I would like to show just how narrow the advance has become. We all know how the FANG stocks have led the market. The XLK includes a heavy weighting made up of the FANGS and FANG-like stocks. The rise been relentless:
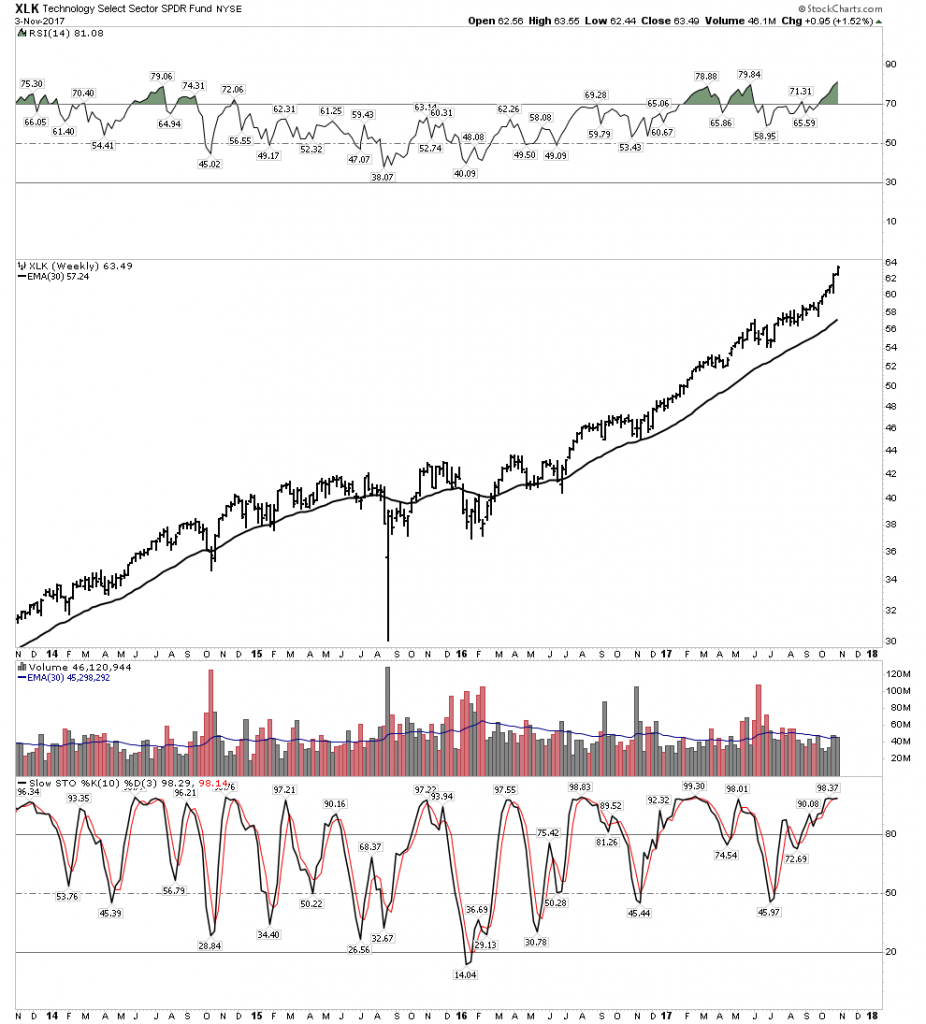
Note how extended stochastics and RSI have become. Also note how volume is trailing off despite this recent blow off move.
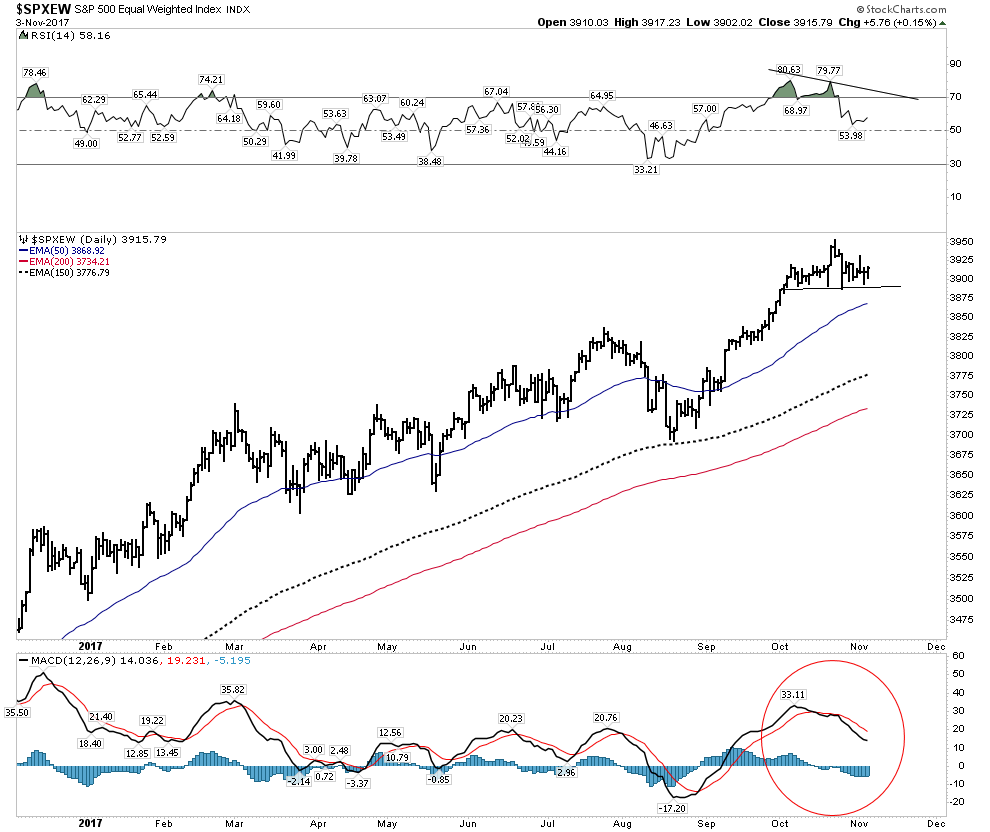
SPX-Equal Weighted Index
Below is the SPX represented as an equal weighted index. It values all 500 stocks equally vs the normal cap weighted measure. Here we see the trend solidly upward, however note that RSI is waning and it may be putting in a H&S top. MACD momentum is also indicating weakness.
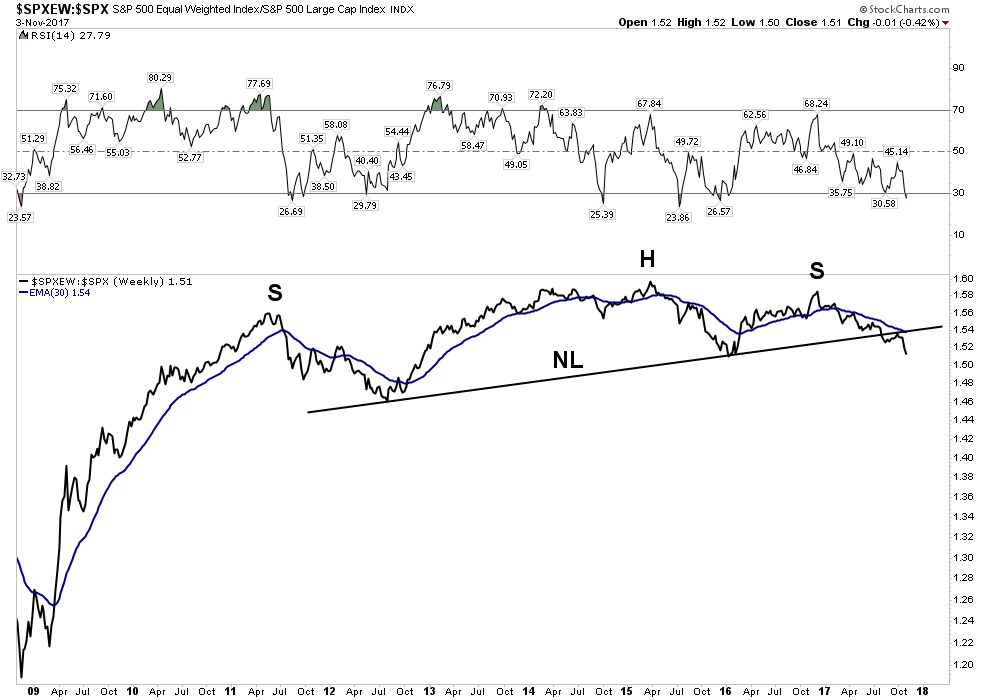
Now let’s go back and view the entire 9 year bull market and subtract out the cap weighted influence of the index as opposed to just neutralizing it. You will see it reveals the core of the market has not really gone anywhere for 7 years and it has recently broken its NL, followed up with a BT and is now resuming its downtrend.
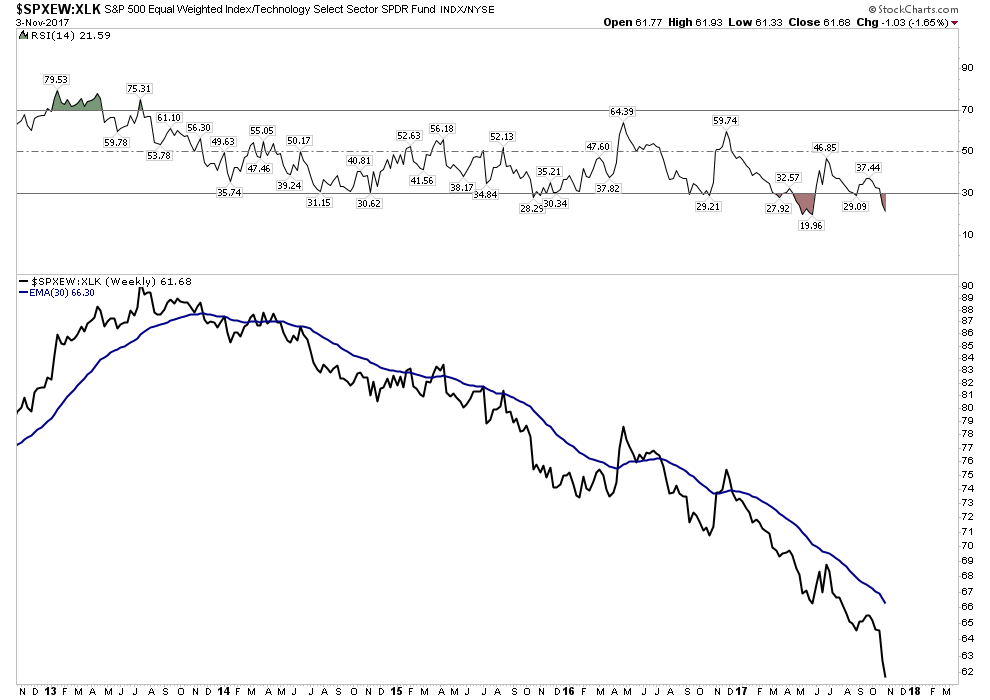
Finally, let’s remove the effect of the super momentum driven XLK for the past 5 years and what is revealed is something really shocking. That of course is a total implosion of the core of the market relative to the momentum driven XLK. The message here for us to understand is that this market is being driven by money flows into an increasingly narrow sector of the market. This is a classic final phase characteristic of a blow off market. It is not announcing an end tomorrow, but it tells one what season we are in.
Let’s look at a few charts that you should be aware of. Again, the message is not that the end is here, but the internals are deteriorating:
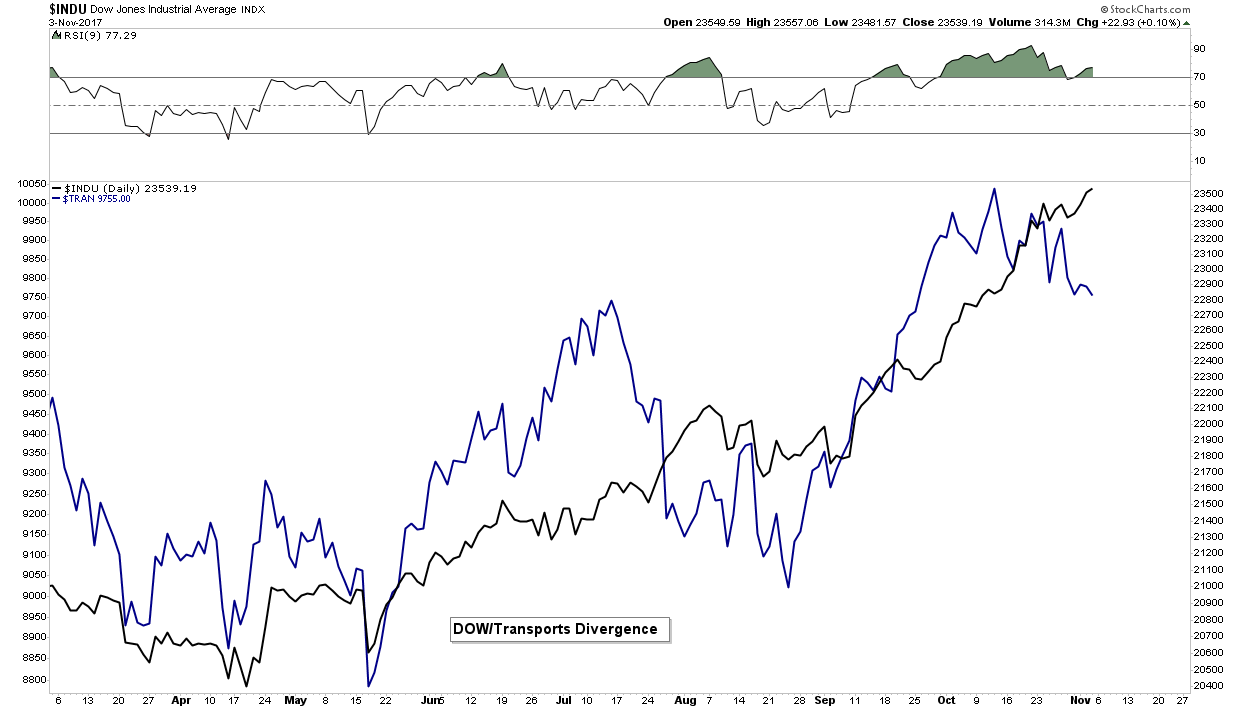
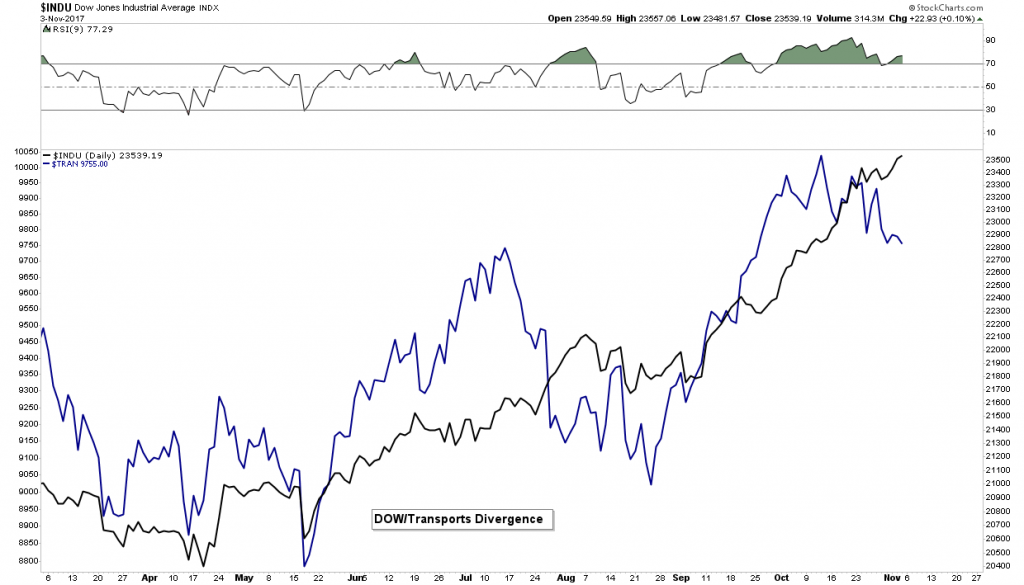
Dow Theory- Non Conformation
It’s only been in effect for three weeks, however this divergence needs to be corrected by the transports resuming its uptrend. Without a reversal upside, it signals trouble ahead:
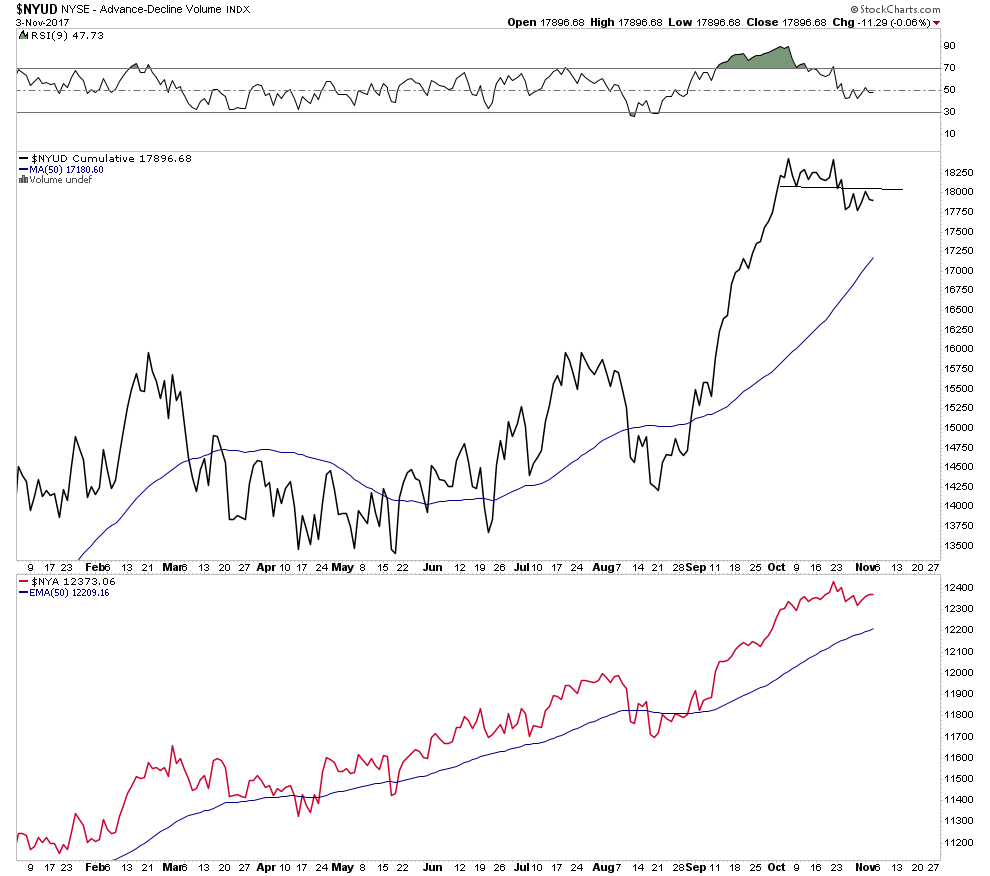
Advanced Decline Volume:
It’s too soon to call a top, however here we see the first step down in Adv/Decline volume indicating internal weakness.
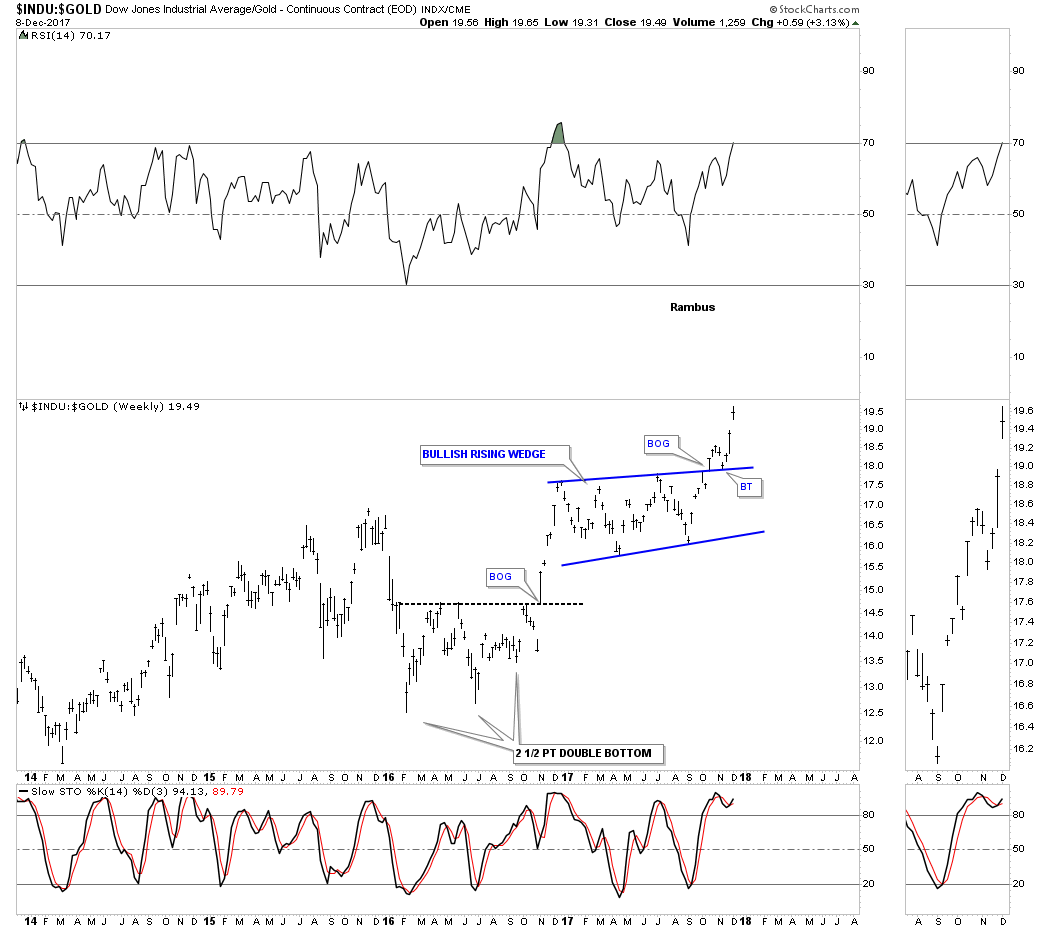
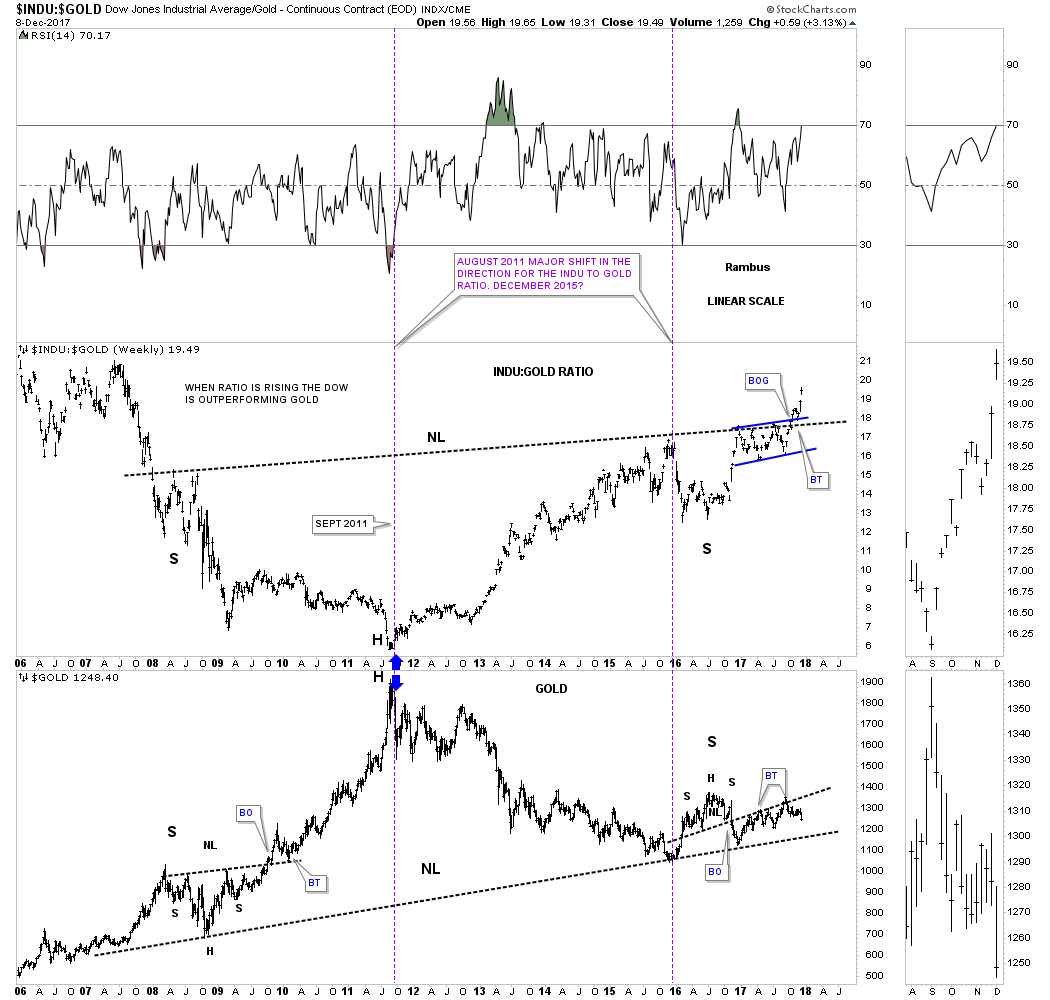
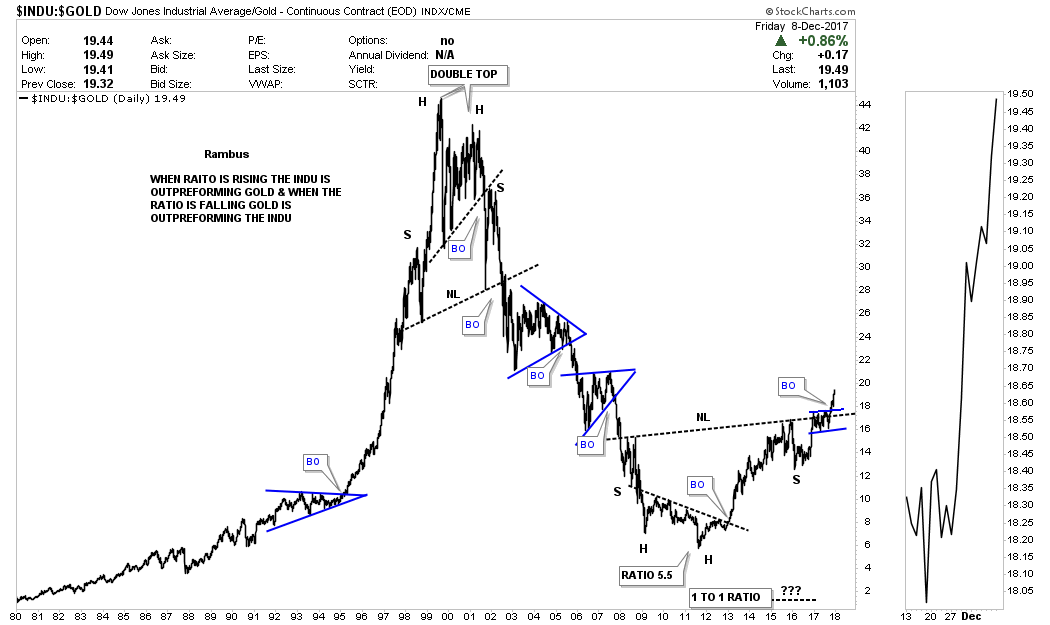
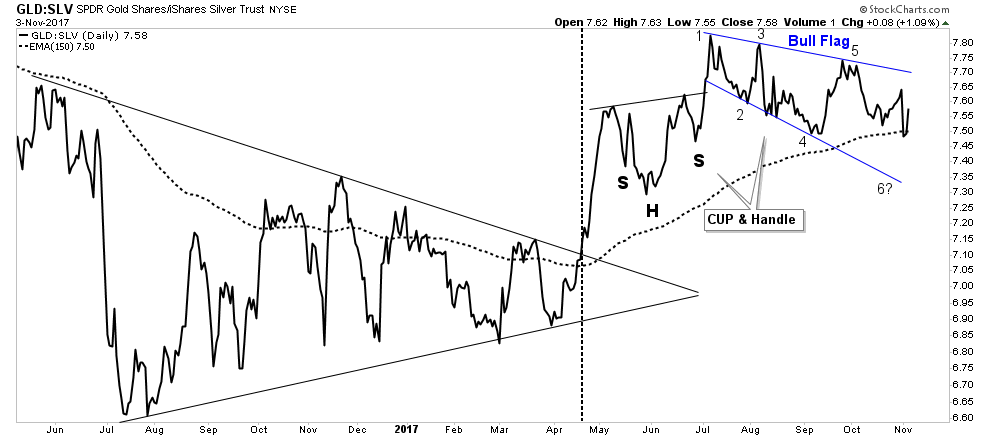
GSR- Update
We don’t expect a breakout until after a market peak is in place, however it continues to progress doing it’s technical work:
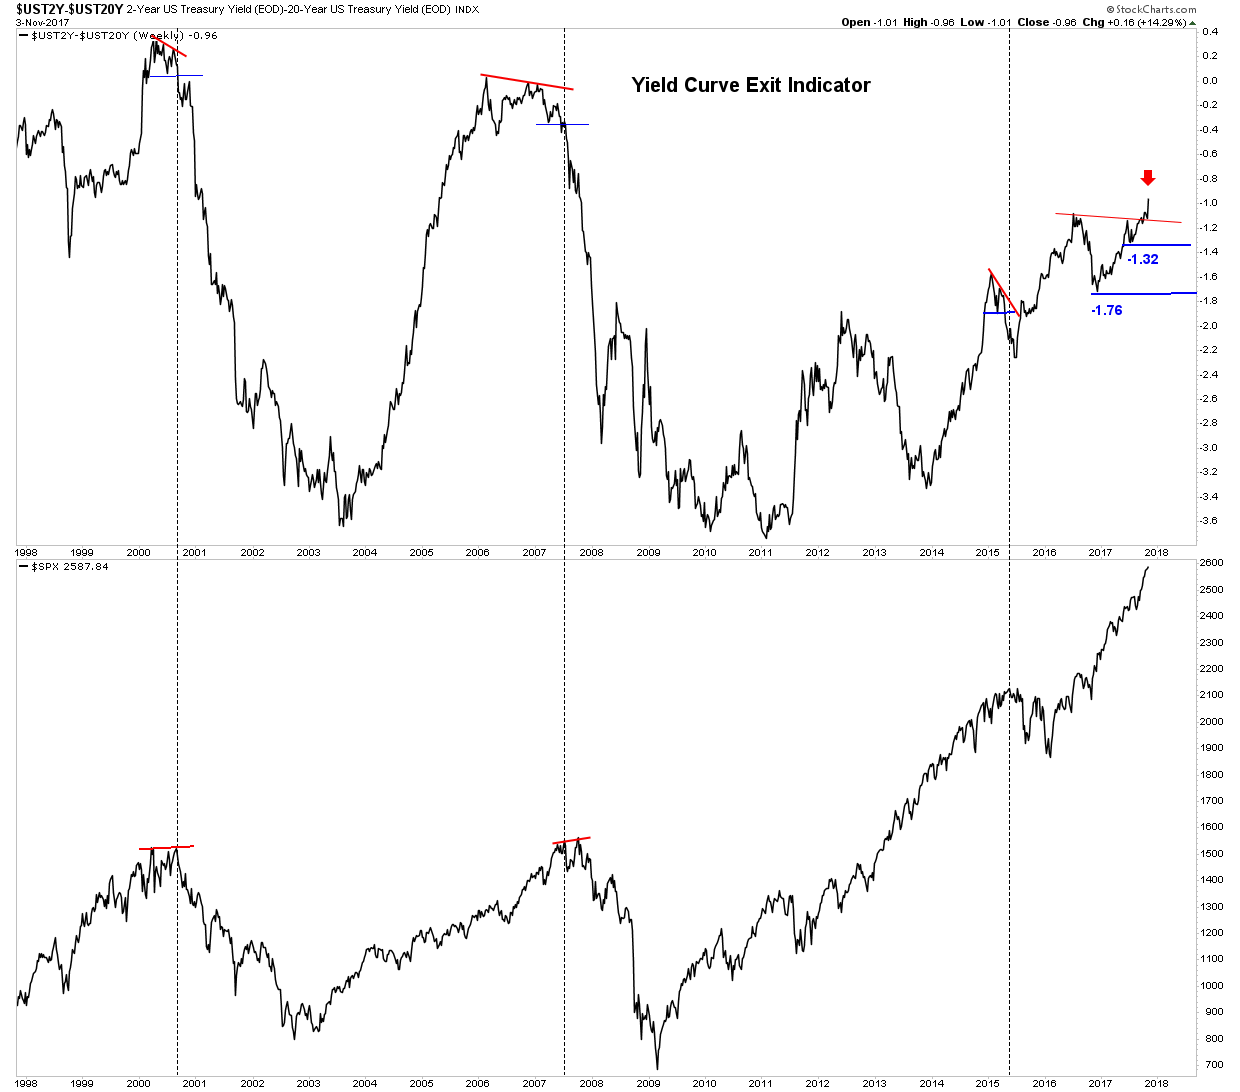
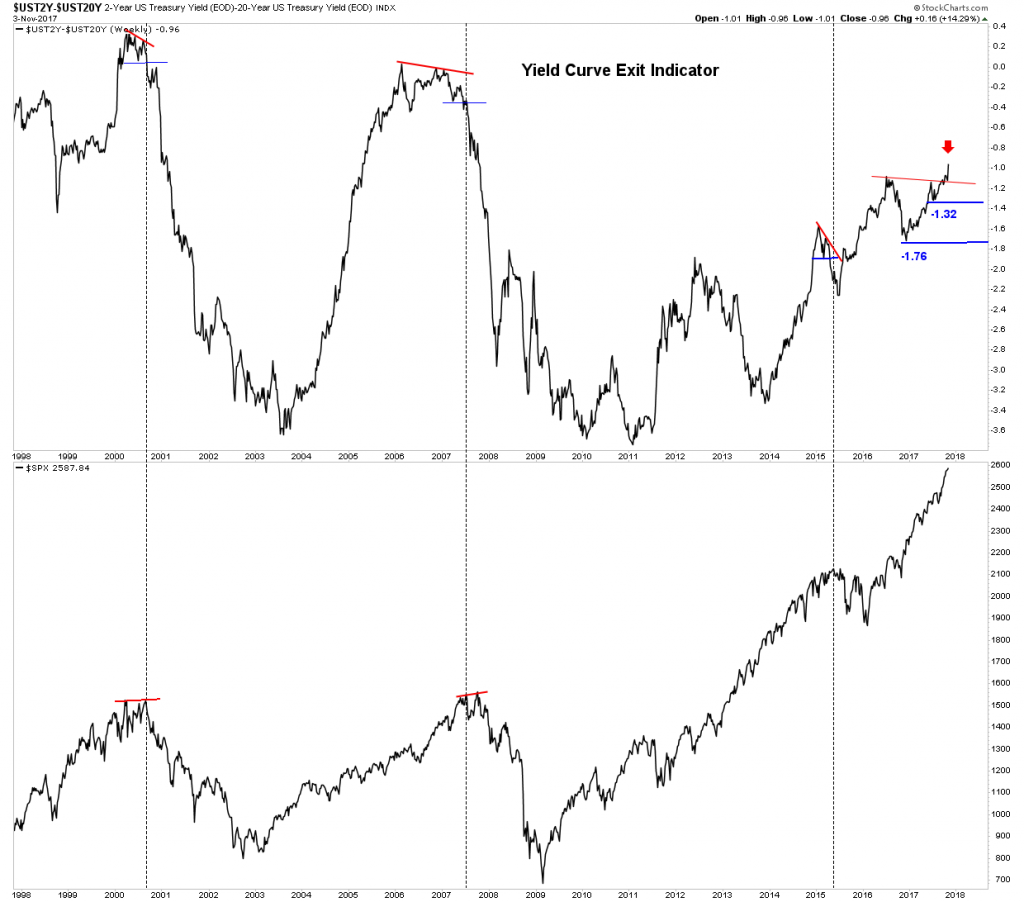
Yield Curve Exit Indicator:
It is saying don’t exit yet despite these initial internal indicators deteriorating.
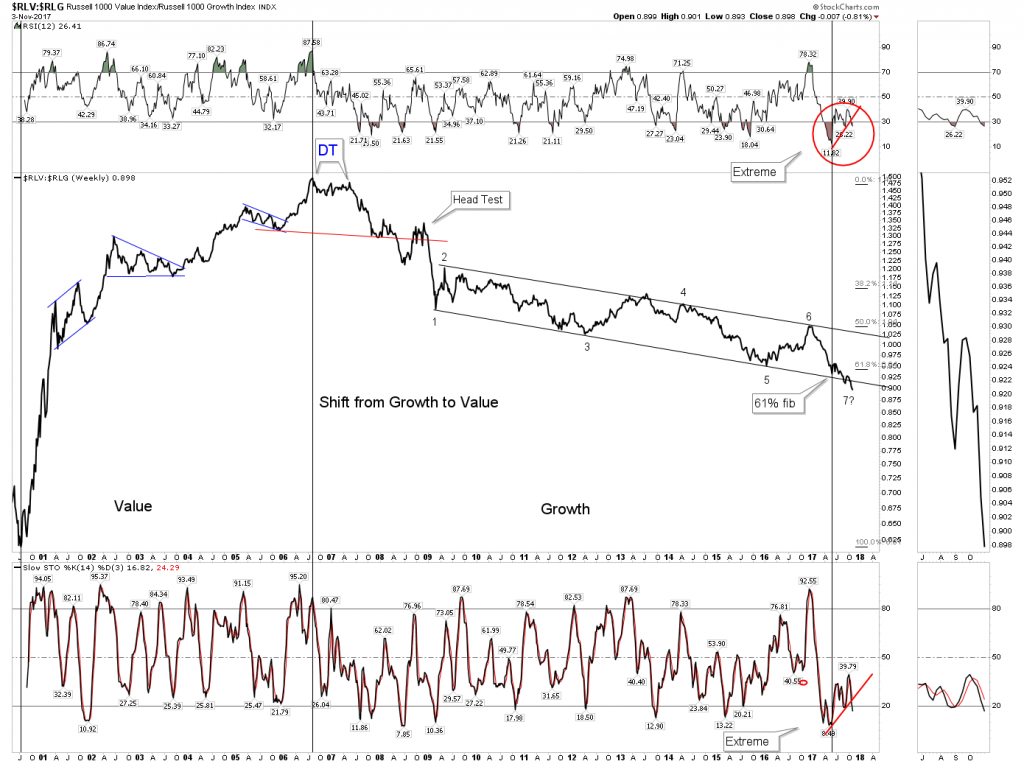
Value vs Growth indicator:
This chart indicates the market preference for growth over value continues even though it is extremely stretched
Bottom Line stock market– Stay the course if you are long, however the market is screaming it is in final blow off mode. Be careful and know that eventually you will need to exit to protect your capital.
The New FED Chair– Say Hello to the New Boss- Same as the Old Boss.
Peter Townsend would be proud of Trump’s pick this week of Jerome Powell as the new FED head. There had been hope of a libertarian disruptor to the established order, but the reality turned that hope into a pipe dream… of course. What this appointment assures is the money printing will continue and Wall Street will be assured of a bailout when the next crisis arrives. The Greenspan/Bernanke/Yellen legacy will be maintained and the Everything Bubble will continue to be pumped if it ever shows signs of deflating.
It is important to know where this man came from. He was a partner at the Carlisle Group, private equity firm. Their business model of course is using cheap capital to perform acquisitions. Their model is a classic case of mal-investment since these “deals” are not driven by consumer demand but are enabled by leveraging-up a balance sheet and “playing” the difference between their cost of capital and the markets cost. So the acquisitions they do are not due to business innovation, but instead from financial engineering. A recent example of this process completing the full circle is Toys “R” Us.
To understand Powell’s perspective and his understanding of economics this is all you really need to know. It will ultimately be all about saving his Wall Street friends whenever the next financial crisis arrives. The libertarian dream of disrupting the crony system of bailouts is not going to happen- meet the new boss!
Precious Metals and the PM Stocks
I discussed the new FED chief in the previous section because ultimately it will have a major impact on the precious metals. When the expanding bubble eventually pops, the gold price and the course of the gold miners will be in relation to the size of the credit bubble created by the FED. Remember a credit bubble is caused by the monetization of debt.
The strengthening US Dollar has been suppressing the price of Gold. This is why I have emphasized one should view gold and the metal stocks through both clear analytical CAD glasses and USD rose colored glasses. With the USD rising the rose colored glasses have now been shattered and reality has asserted itself and its getting ugly.
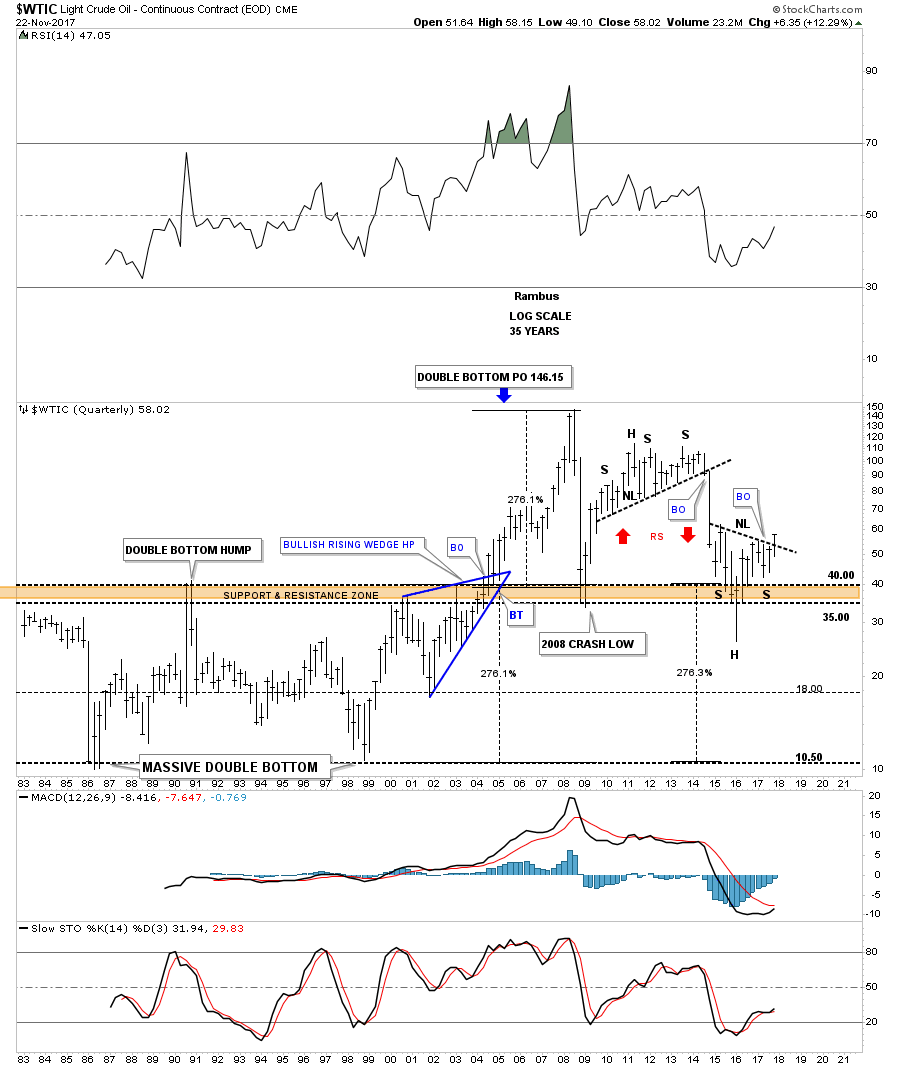
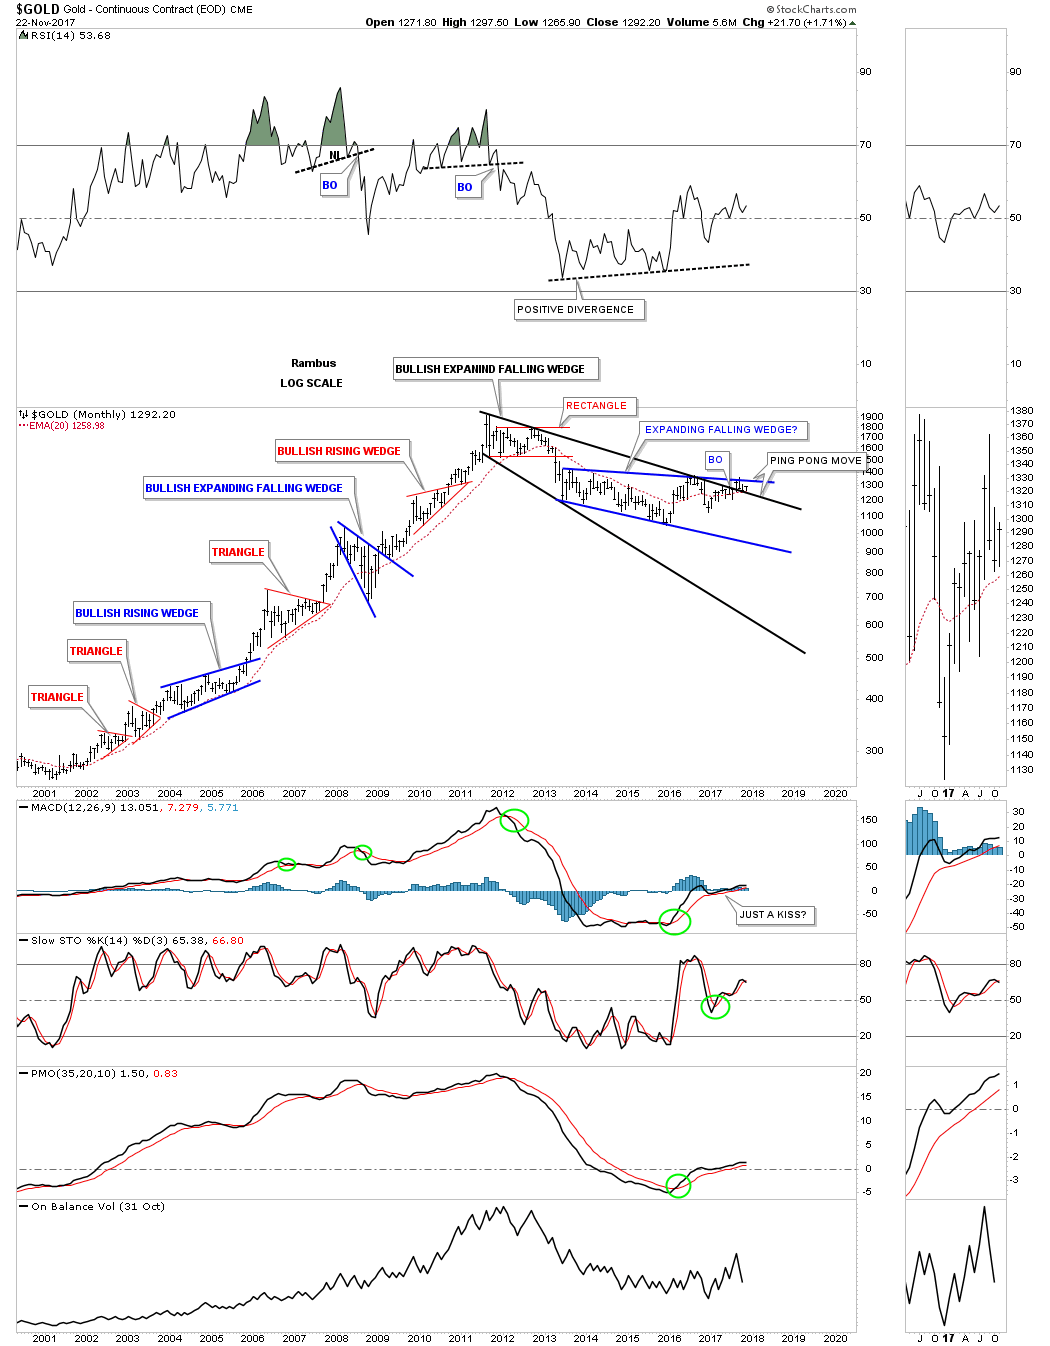
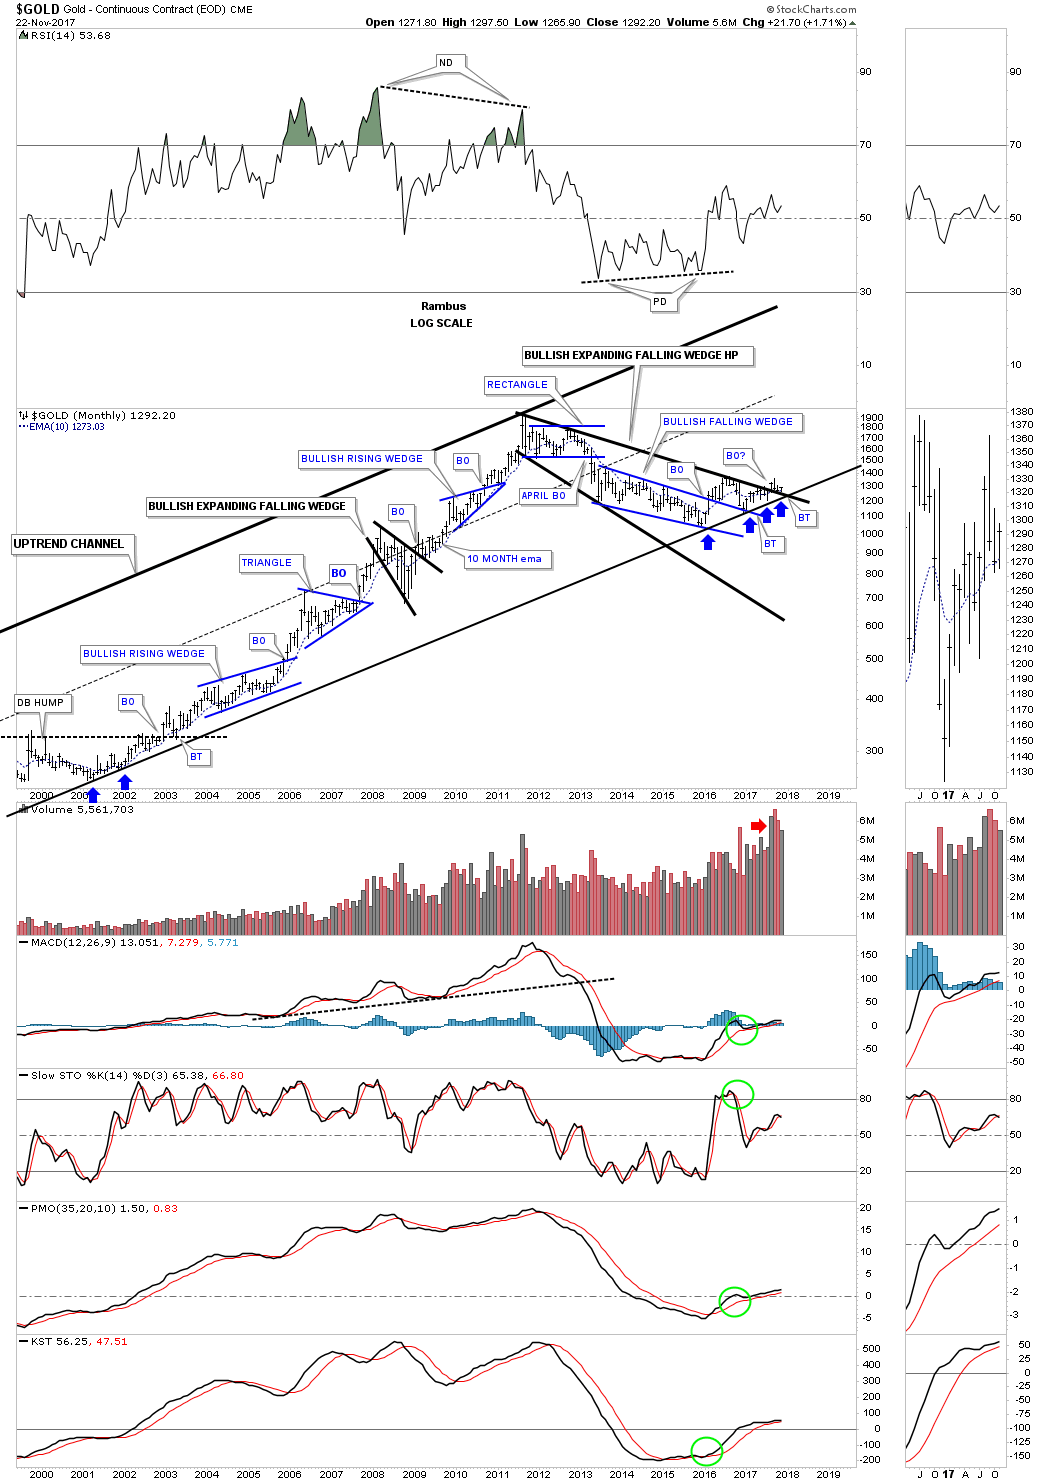
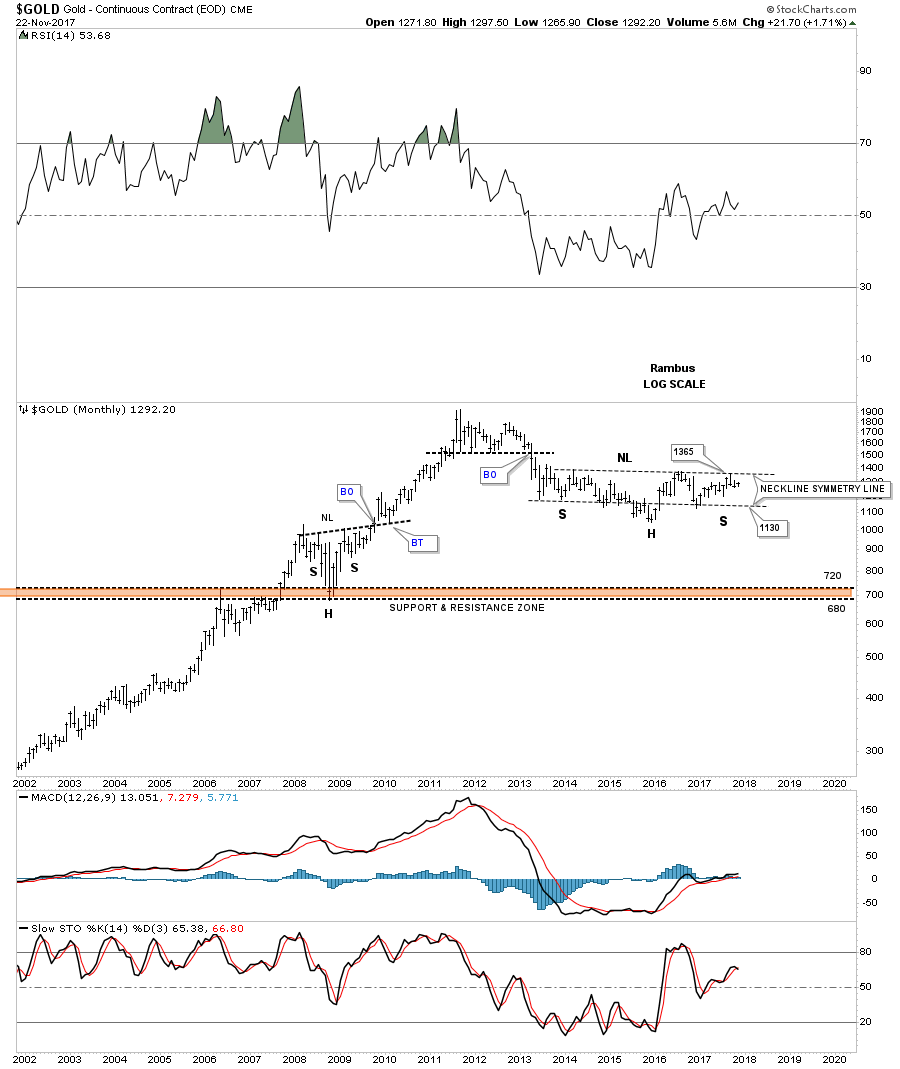
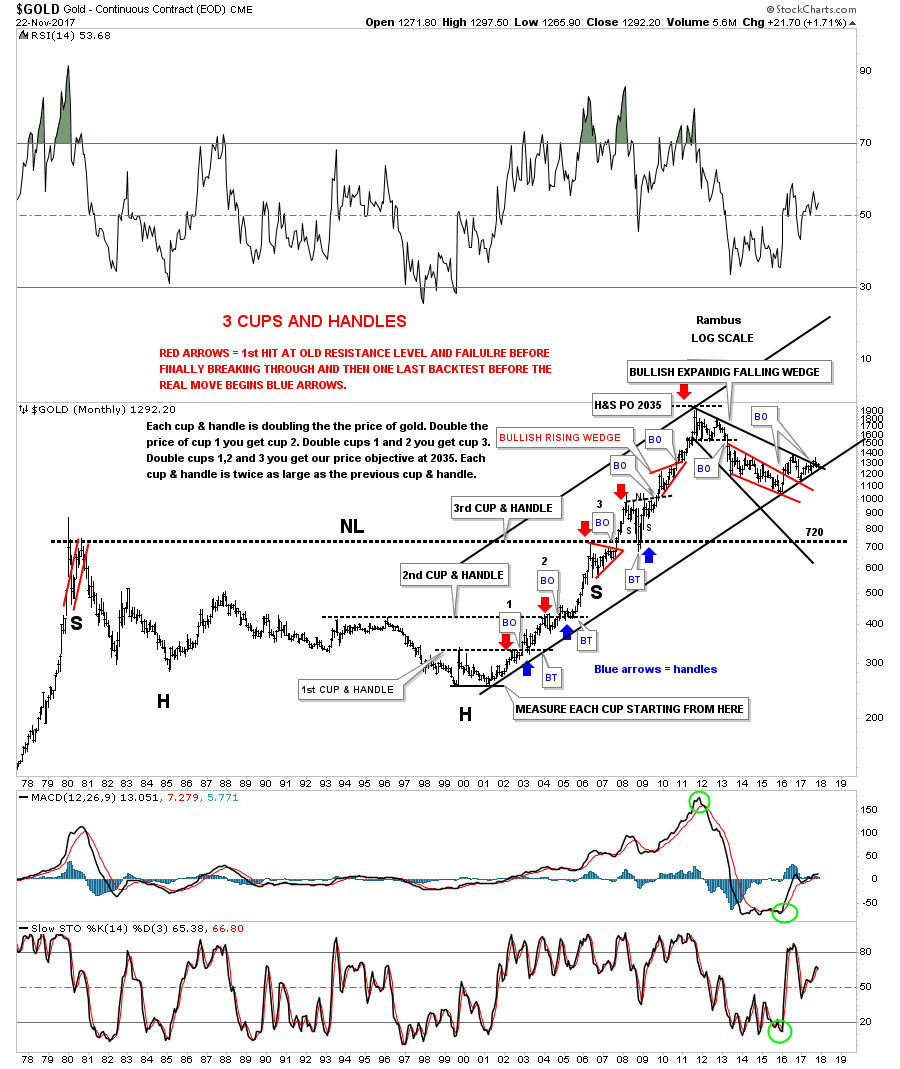
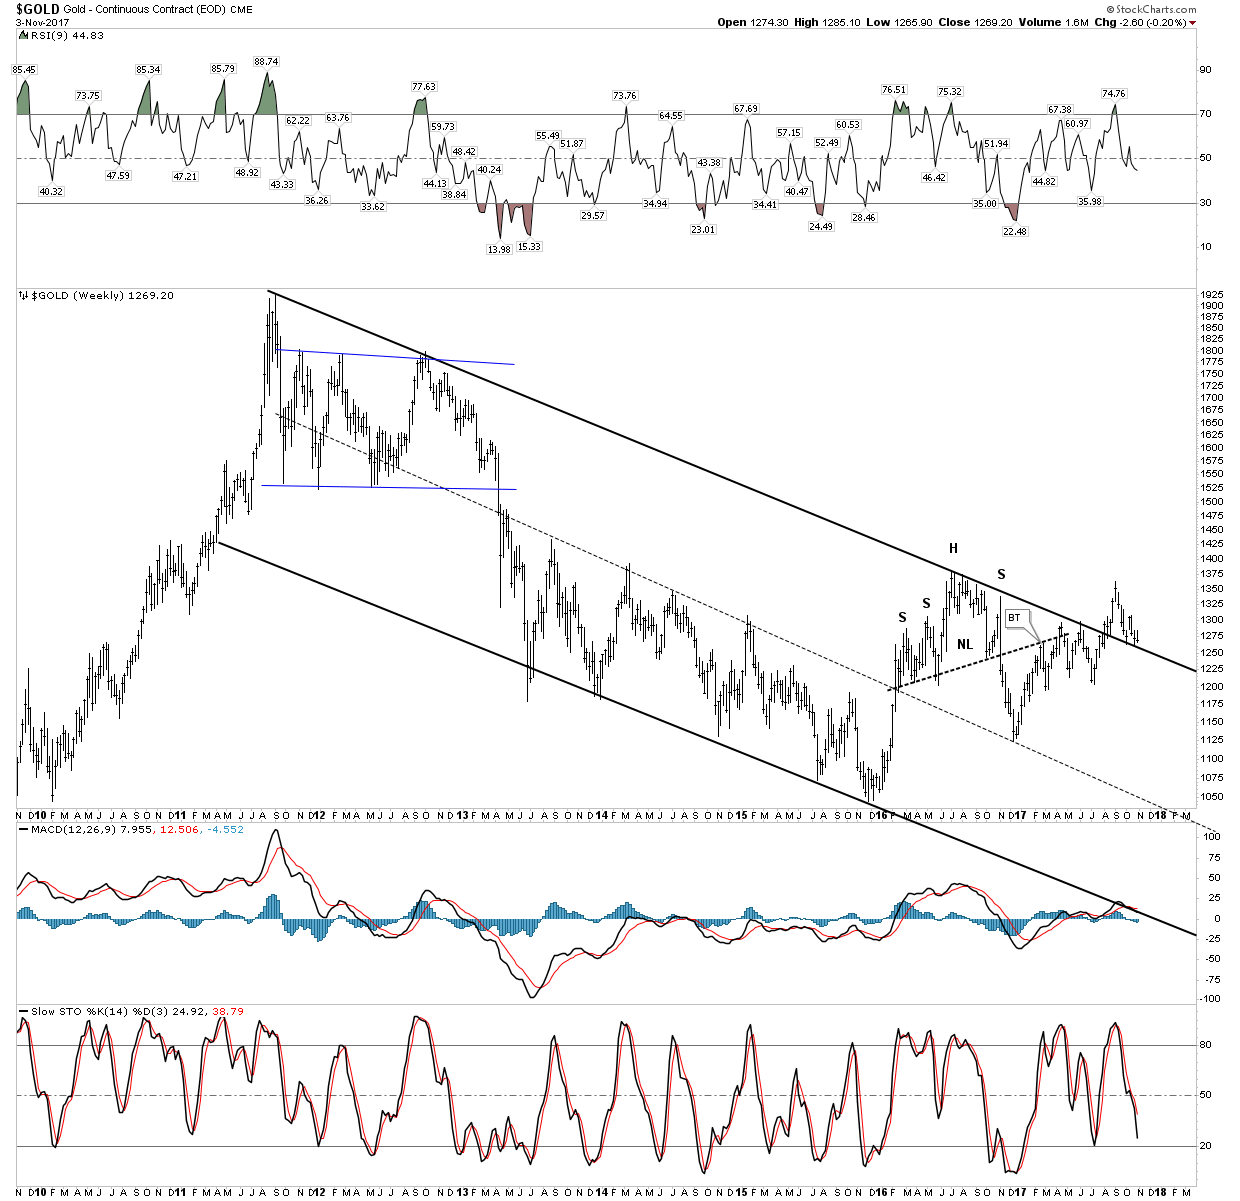
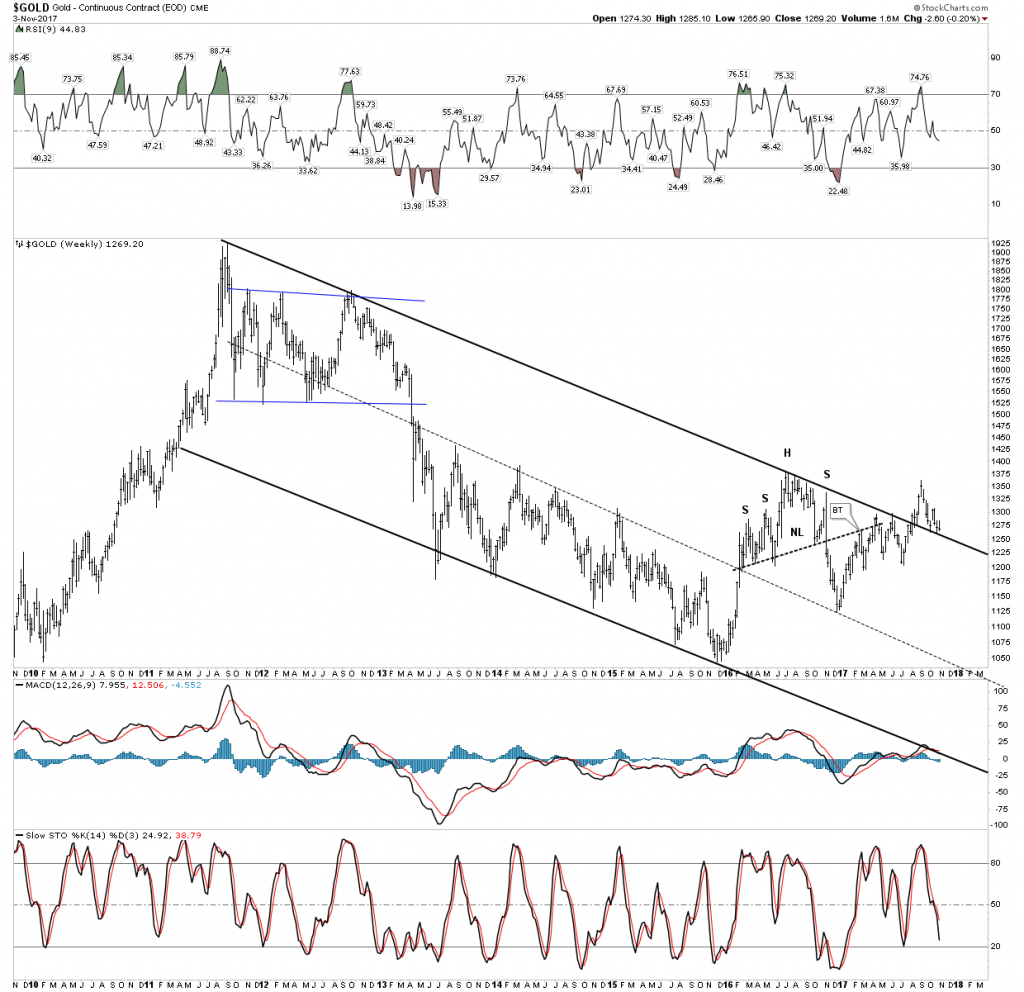
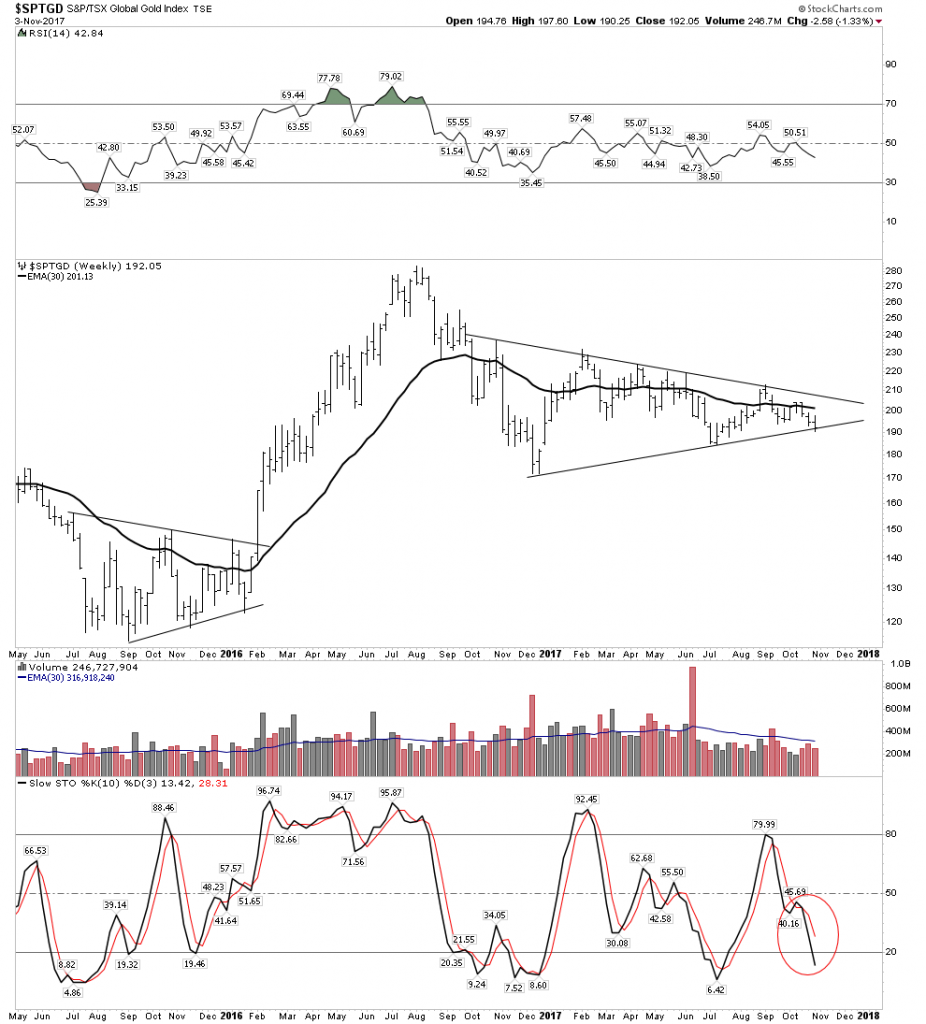
Gold Big Picture:
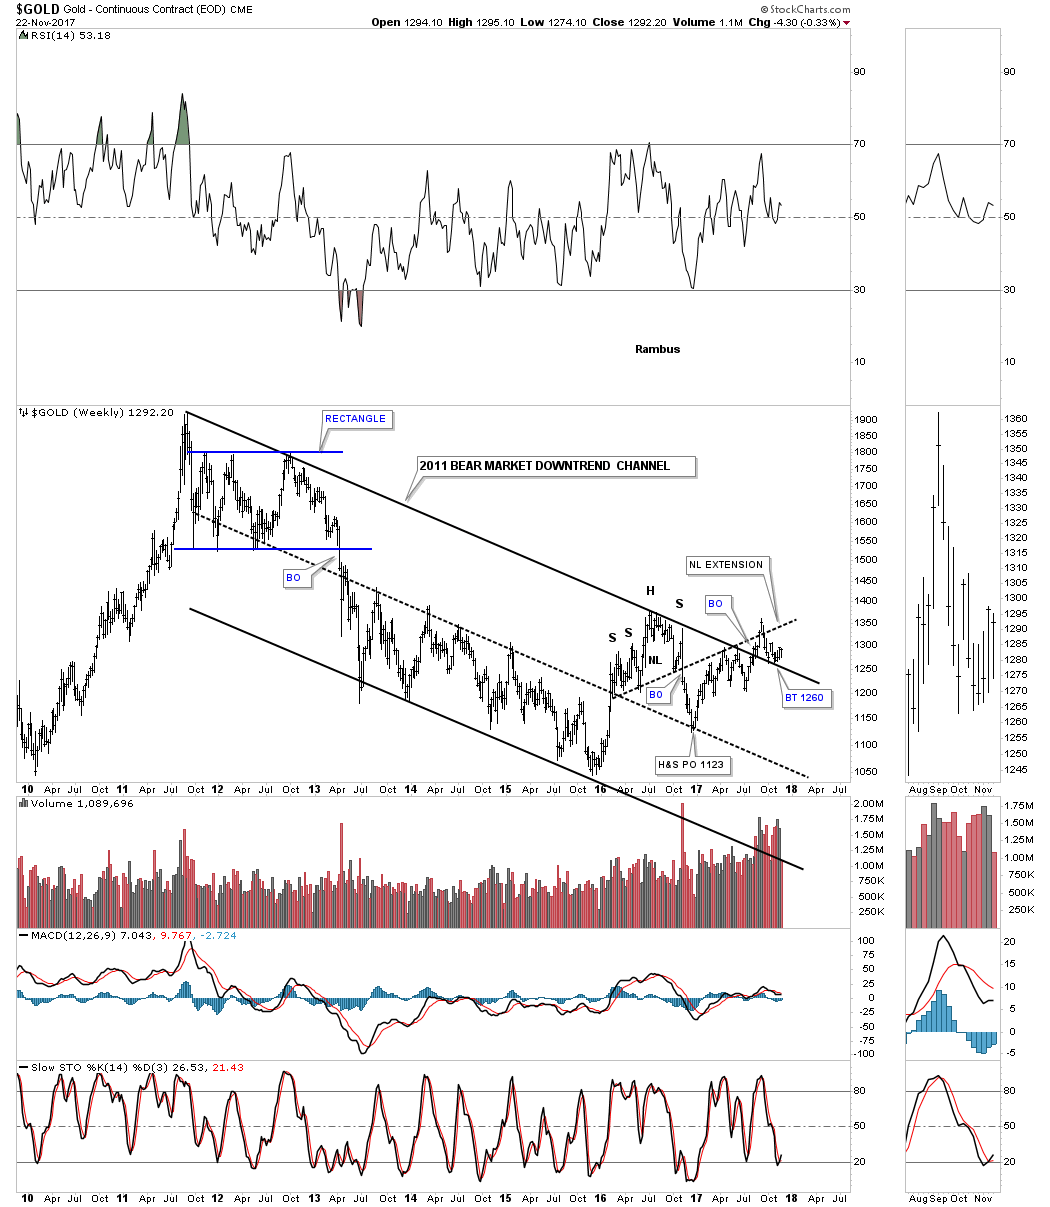
Gold is still hanging in there above the down channel even in USD terms but it is clearly at a critical juncture. If it can resume its uptrend from here that would be very bullish, however stochastics point lower indicating it is set-up to violate the downtrend channel to the downside. Watch this chart closely
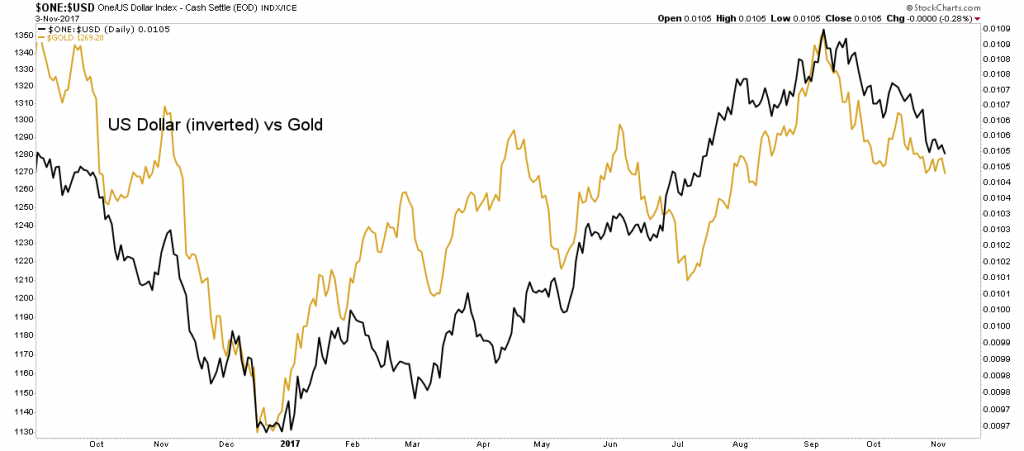
This view is backed up by the below chart which shows gold in lock step with the inverse of the USD. Again this points to the likelihood of lower gold prices, given a rising USD.
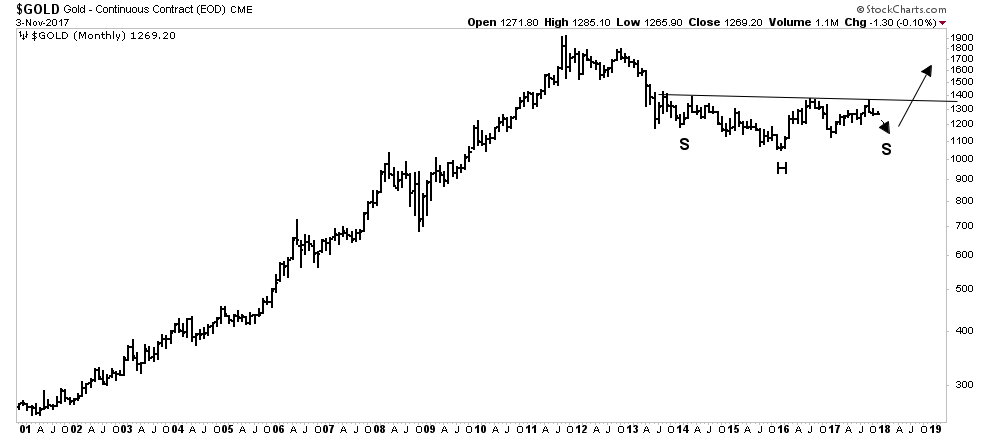
The chart below shows that even if we break down from these levels it is not the end of the world, just a temporary set-back since gold all the way down to 1150 would still be considered basing action of the big saucer consolidation. Gold could be ready for prime time as soon as early 2018.
Gold stocks weaker than the metal:
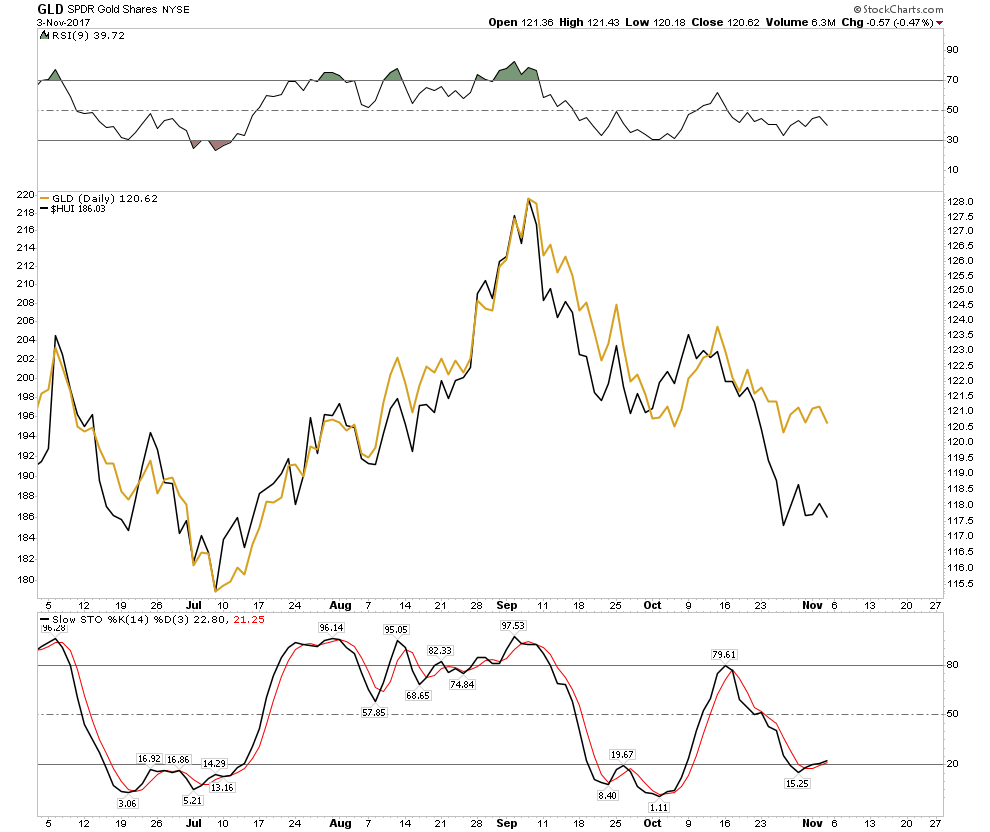
This is not what we want to see. An uptrend should show the gold stocks rising ahead of the metal.
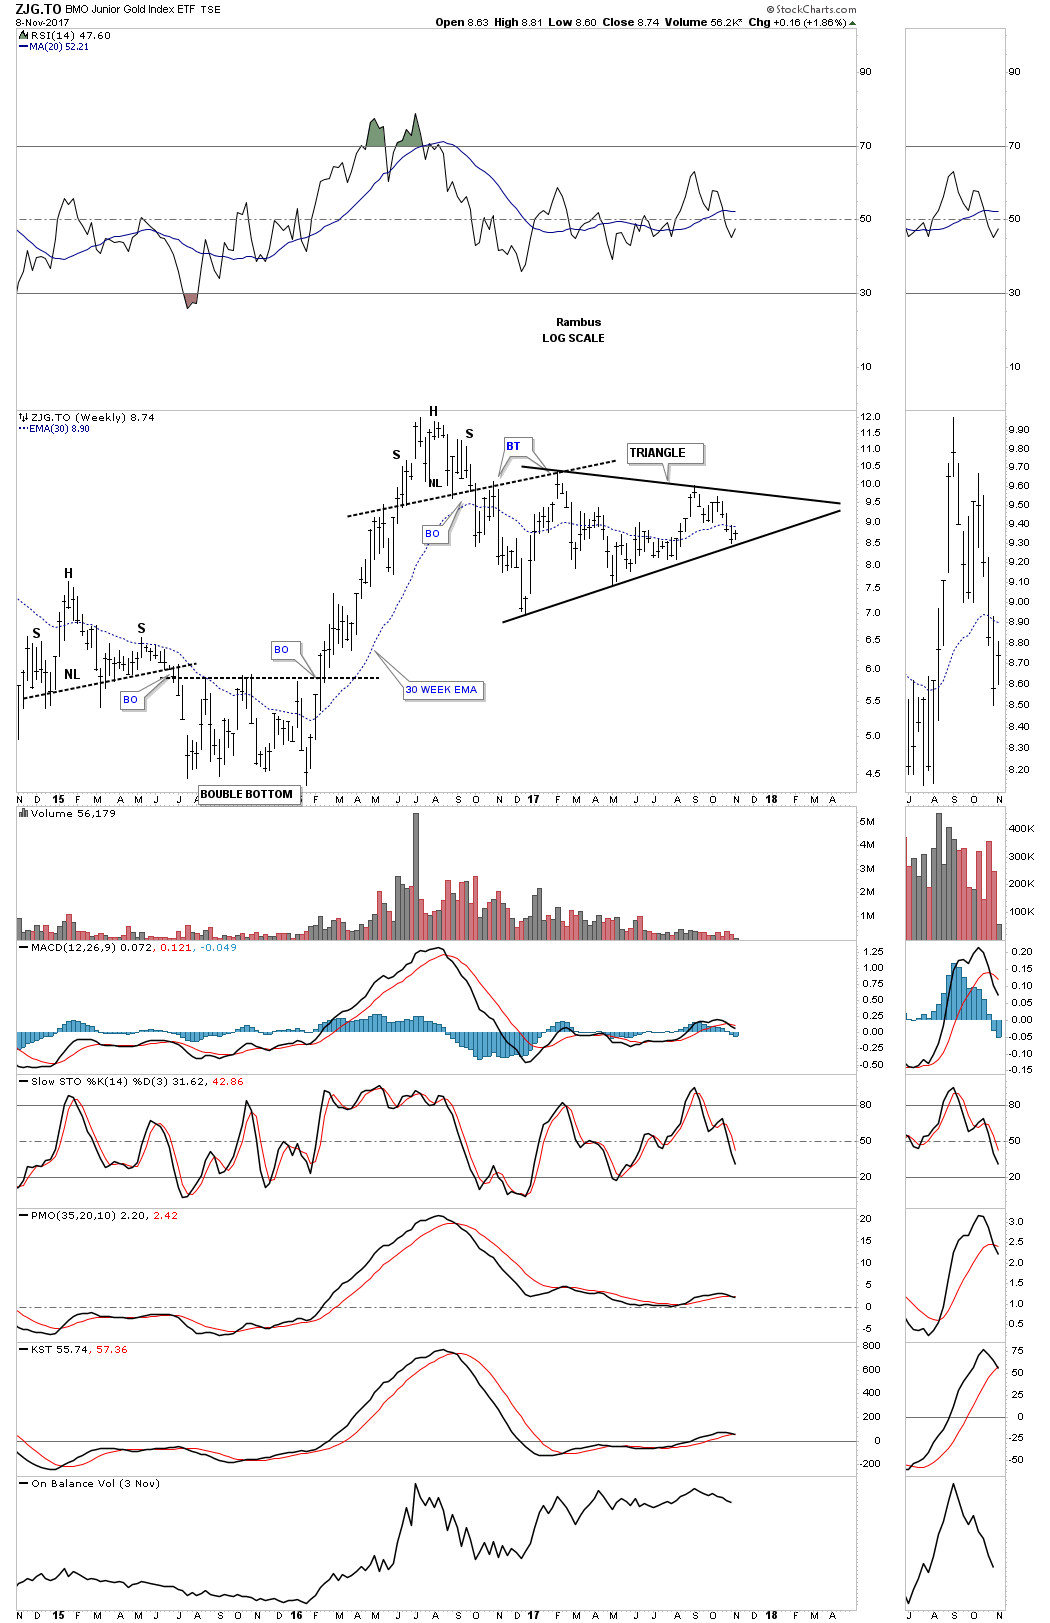
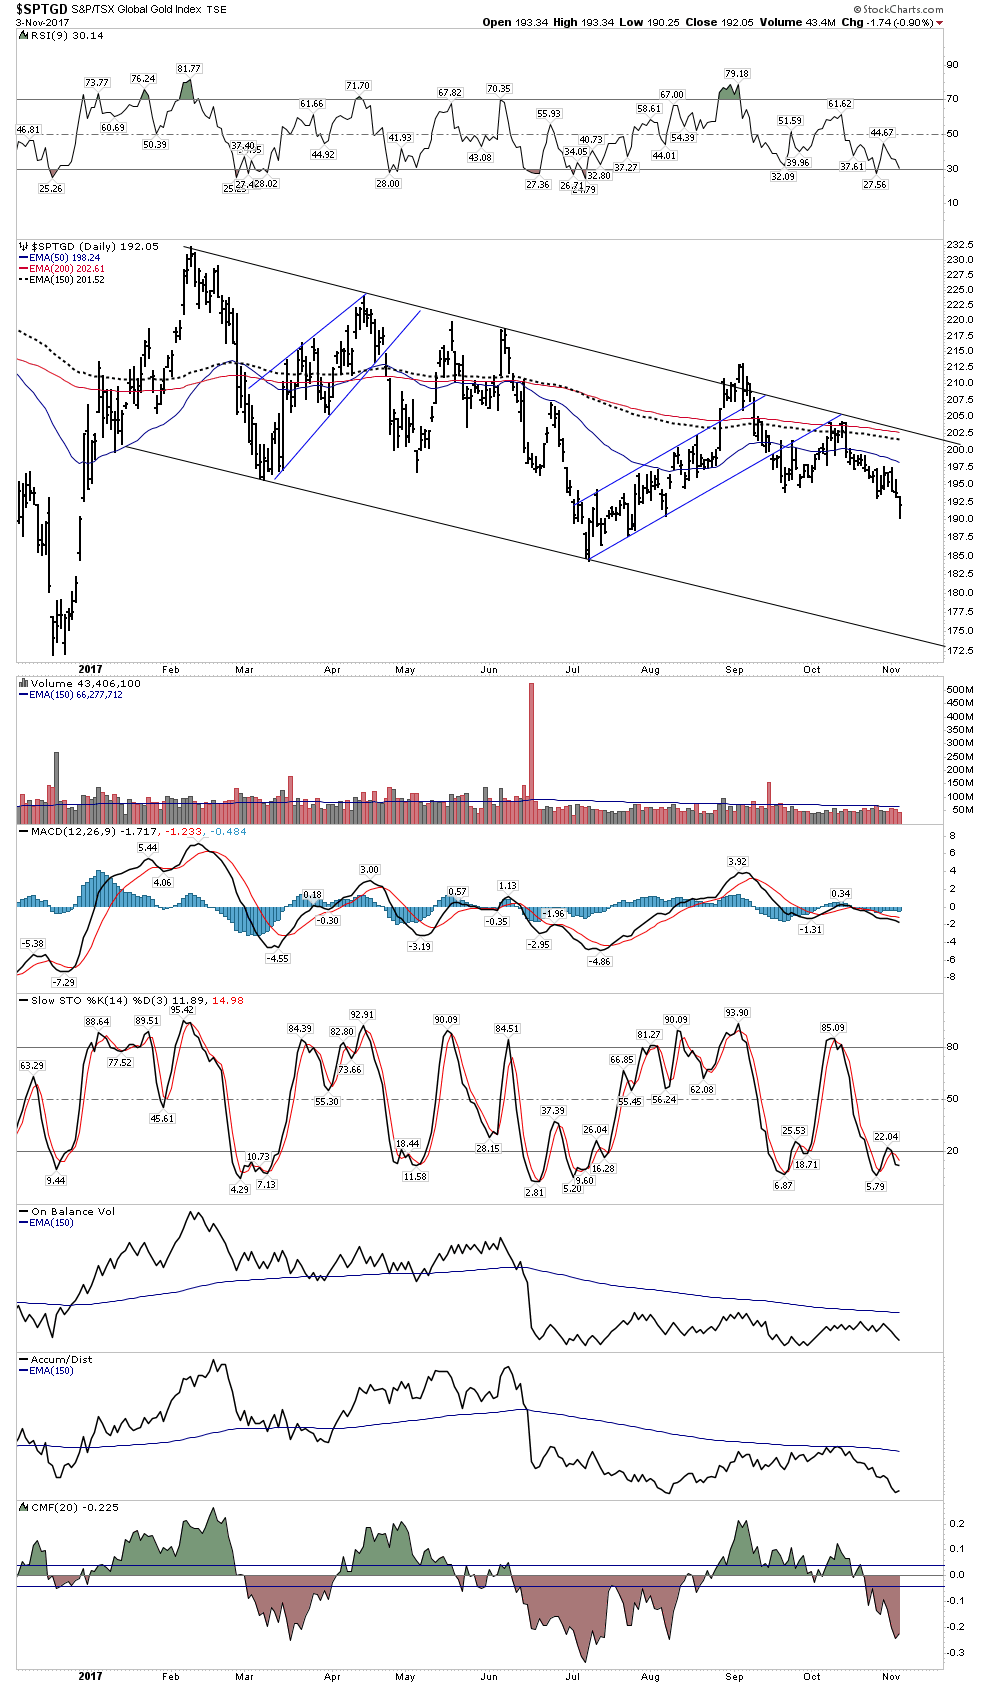
Gold Stocks in $CAD terms:
The weekly chart again shows the PM stocks at a critical juncture. It needs to immediately reverse upward or is in danger of breaking down. Note it is below a declining 30 EMA with stochastics pointed straight down on waning volume…not a pretty picture.
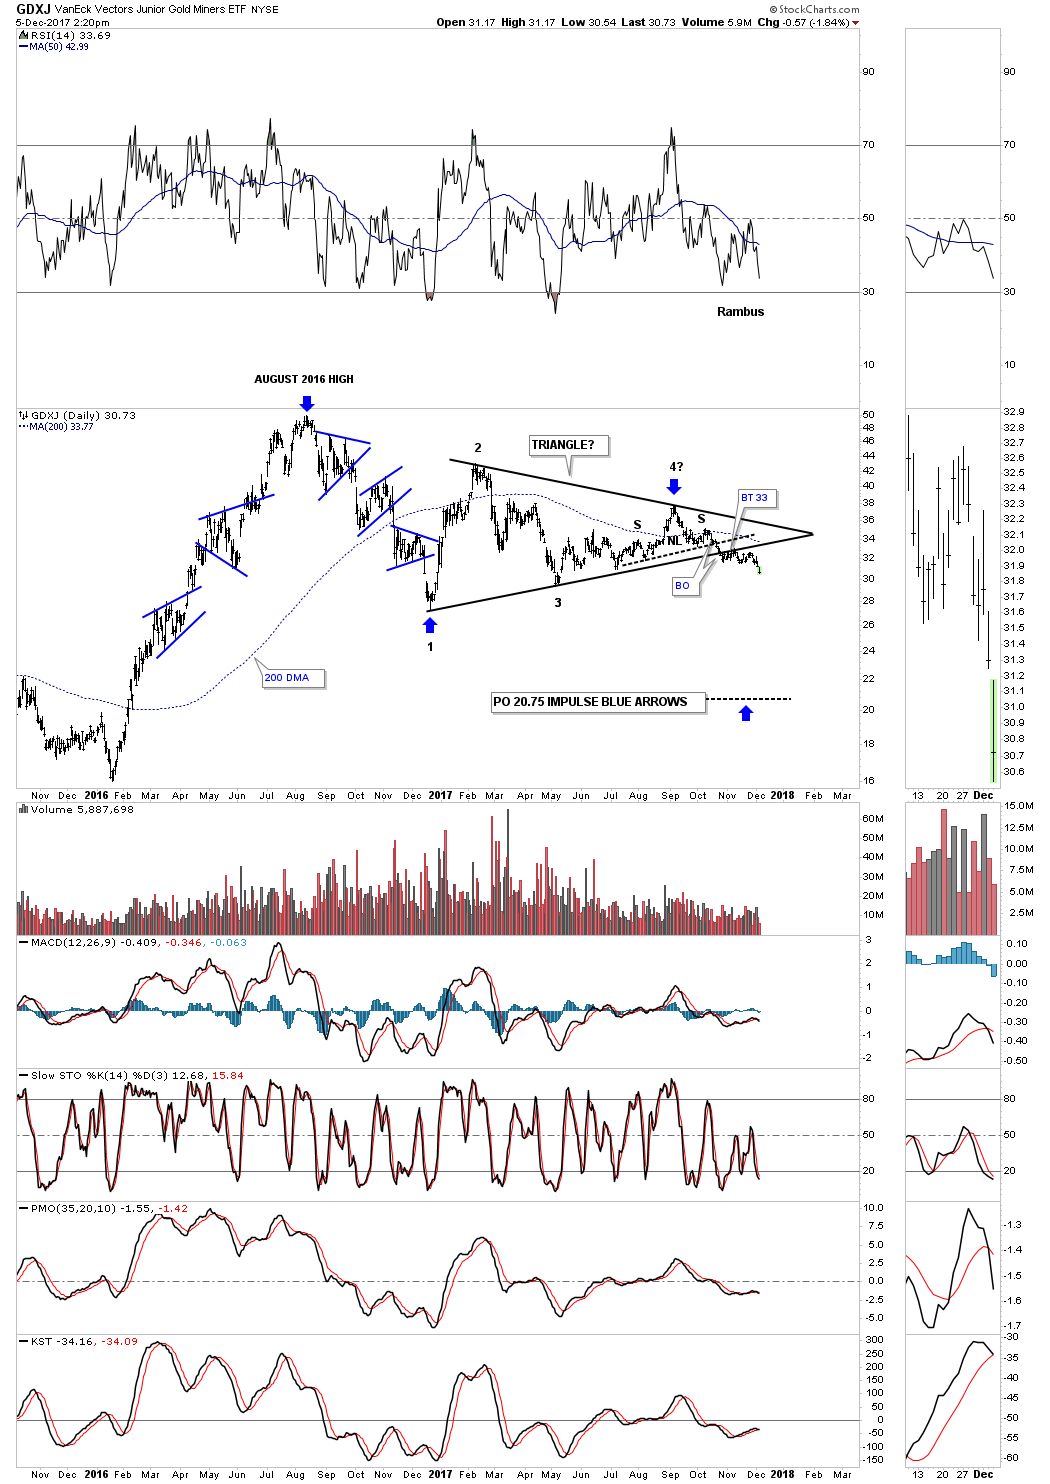
The daily chart looks grim as well. Locked in its downtrend probing new lows, volume collapsing with all indicators headed down. What is going to turn it around?

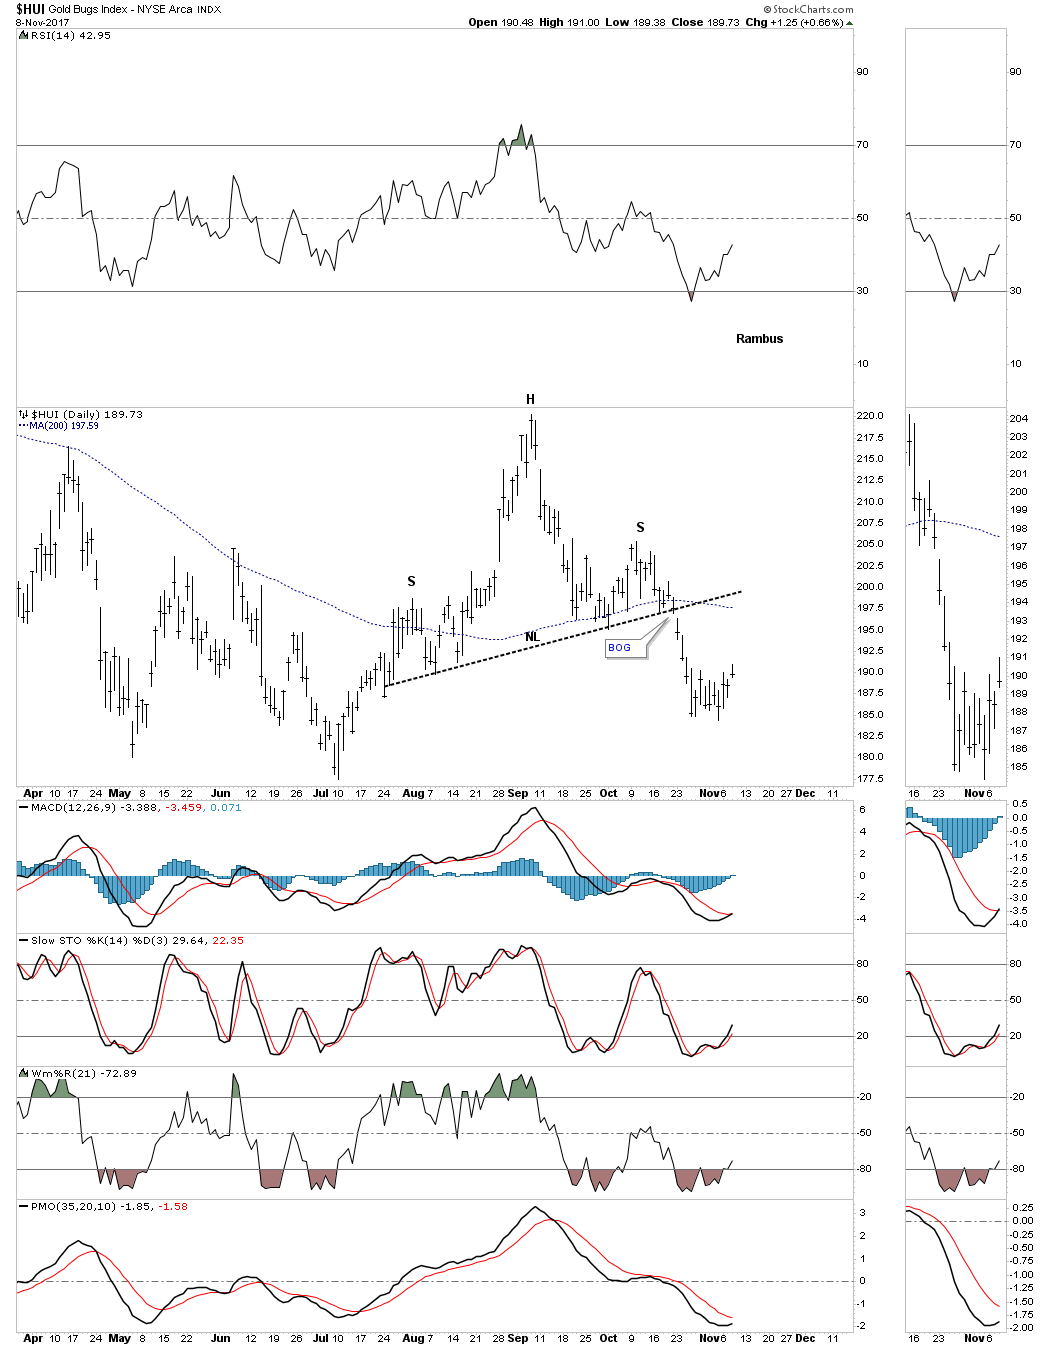
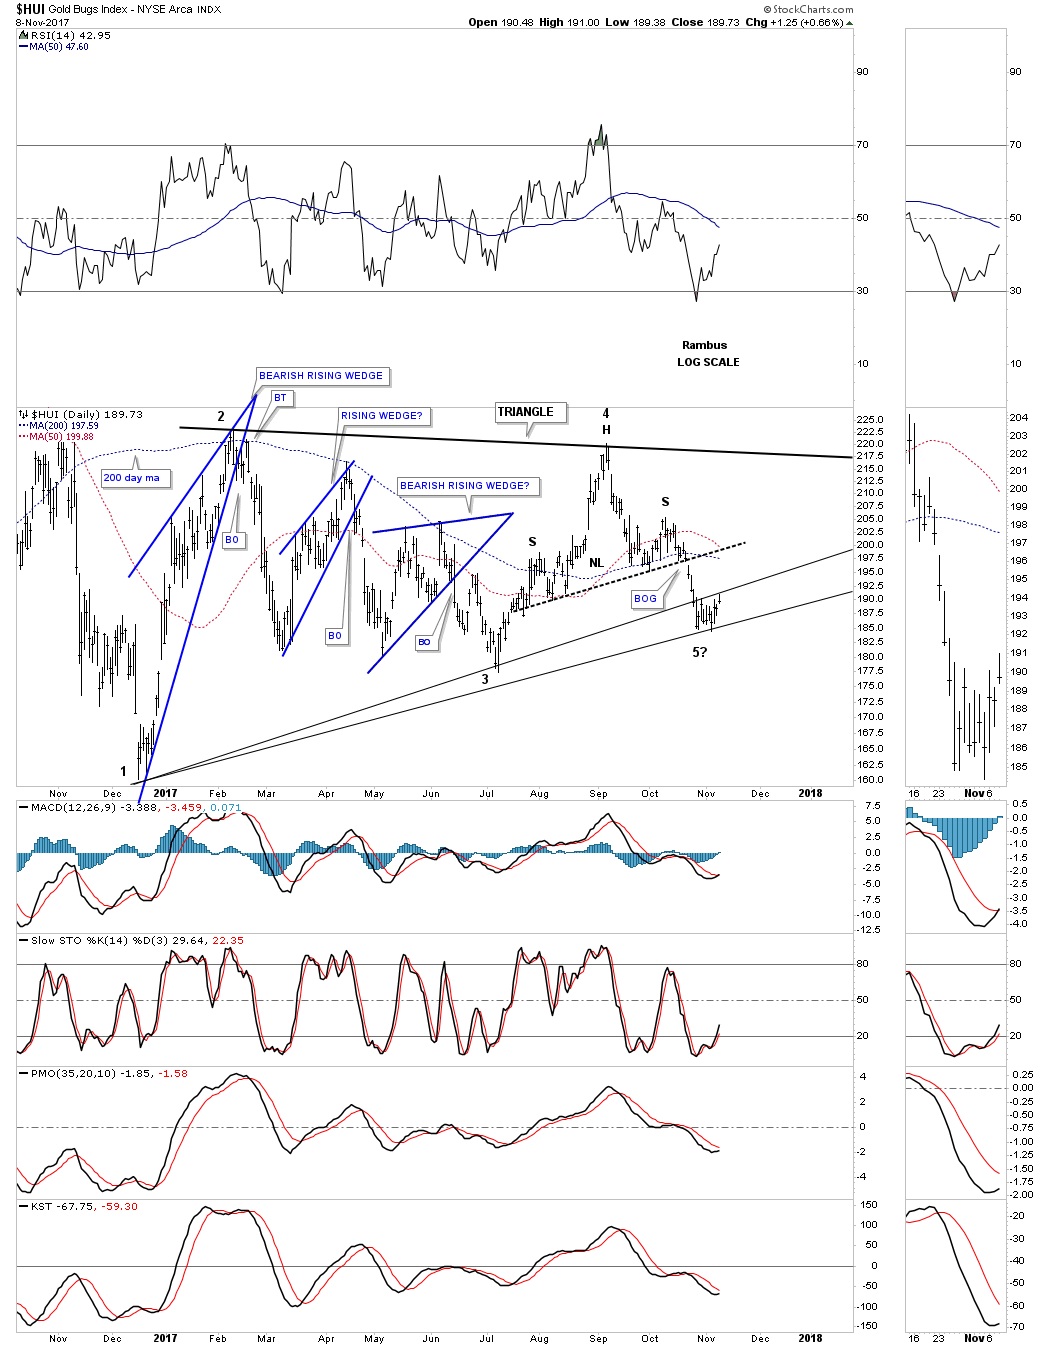
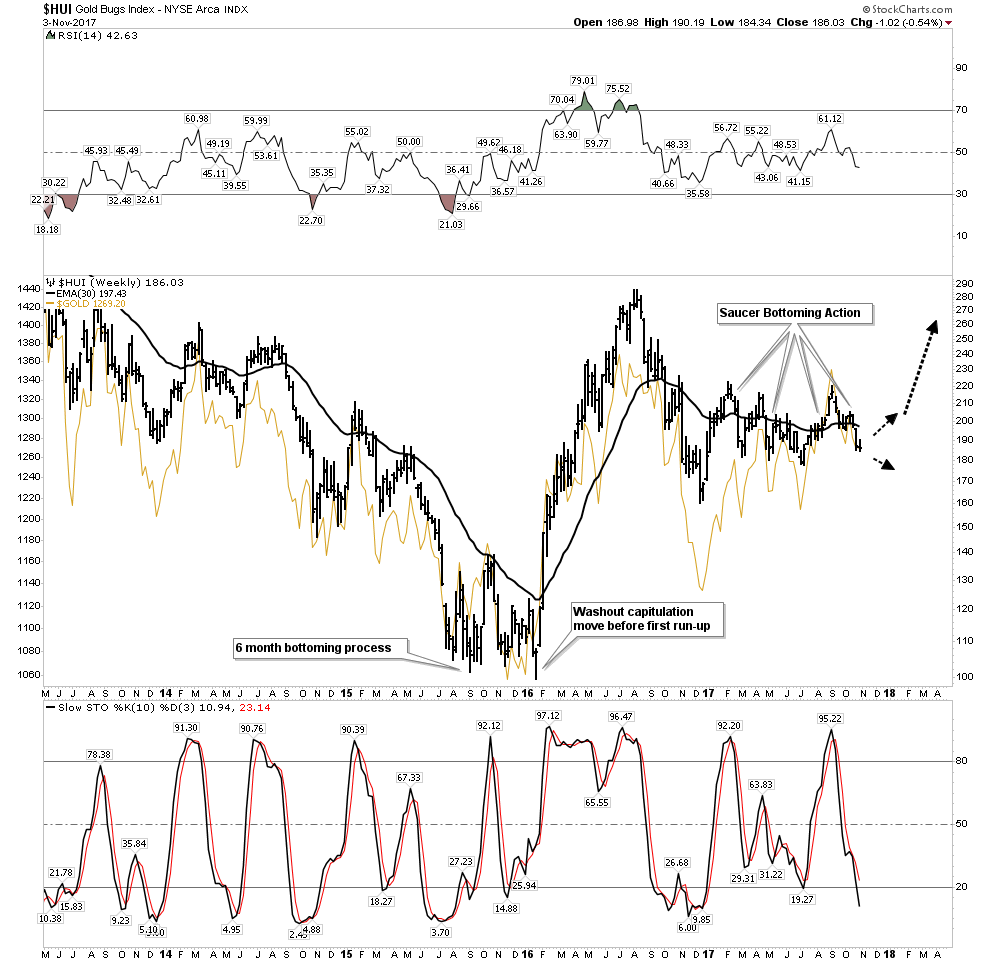
Gold Stocks in USD terms
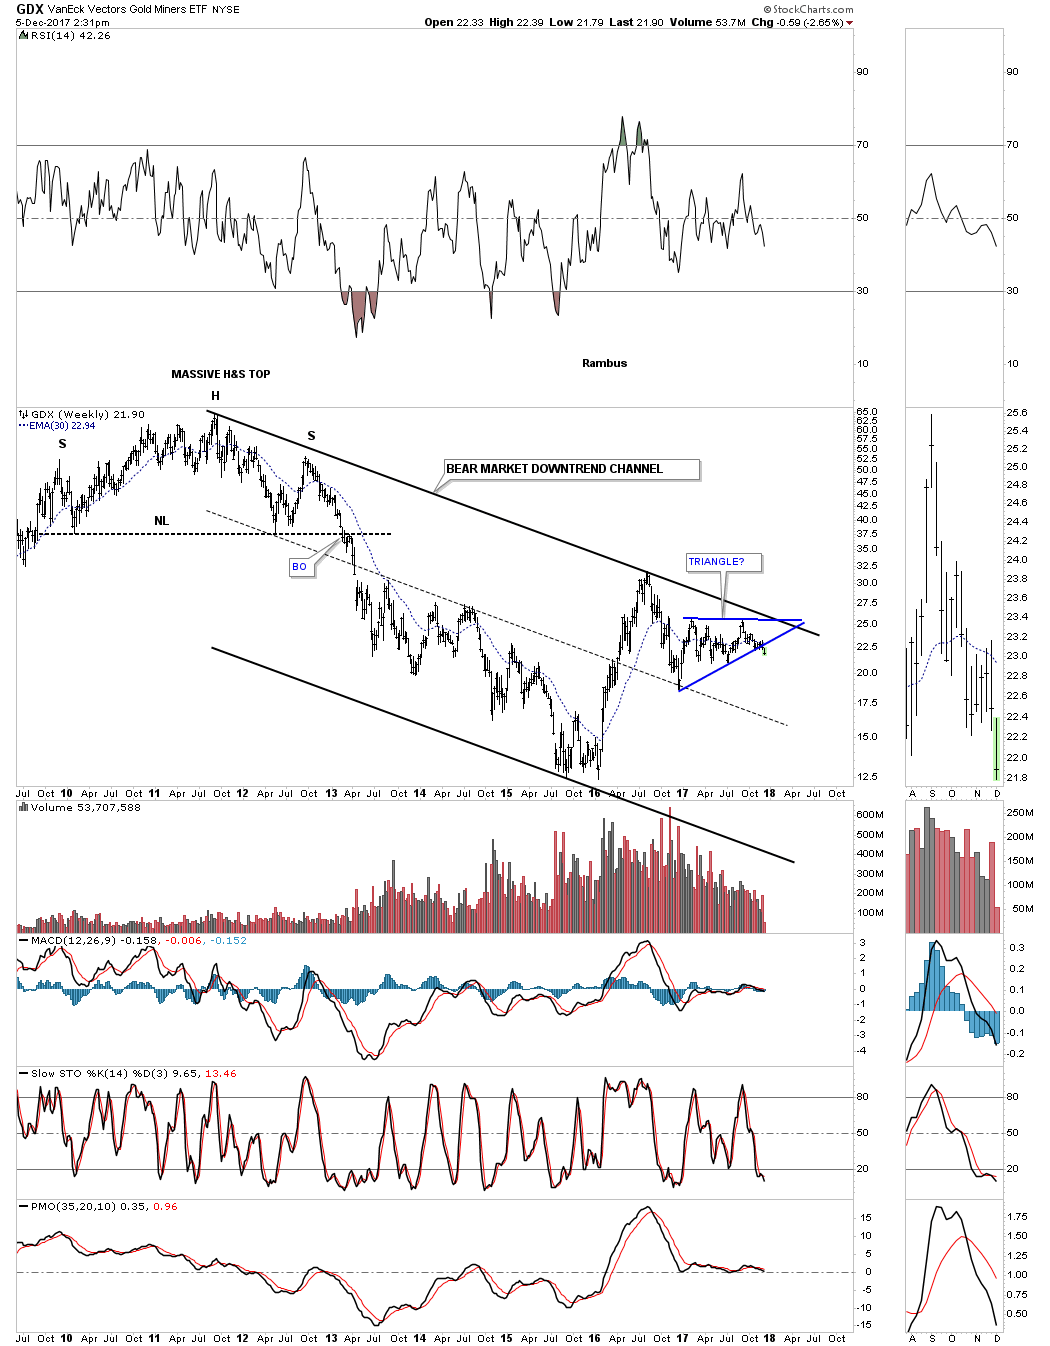
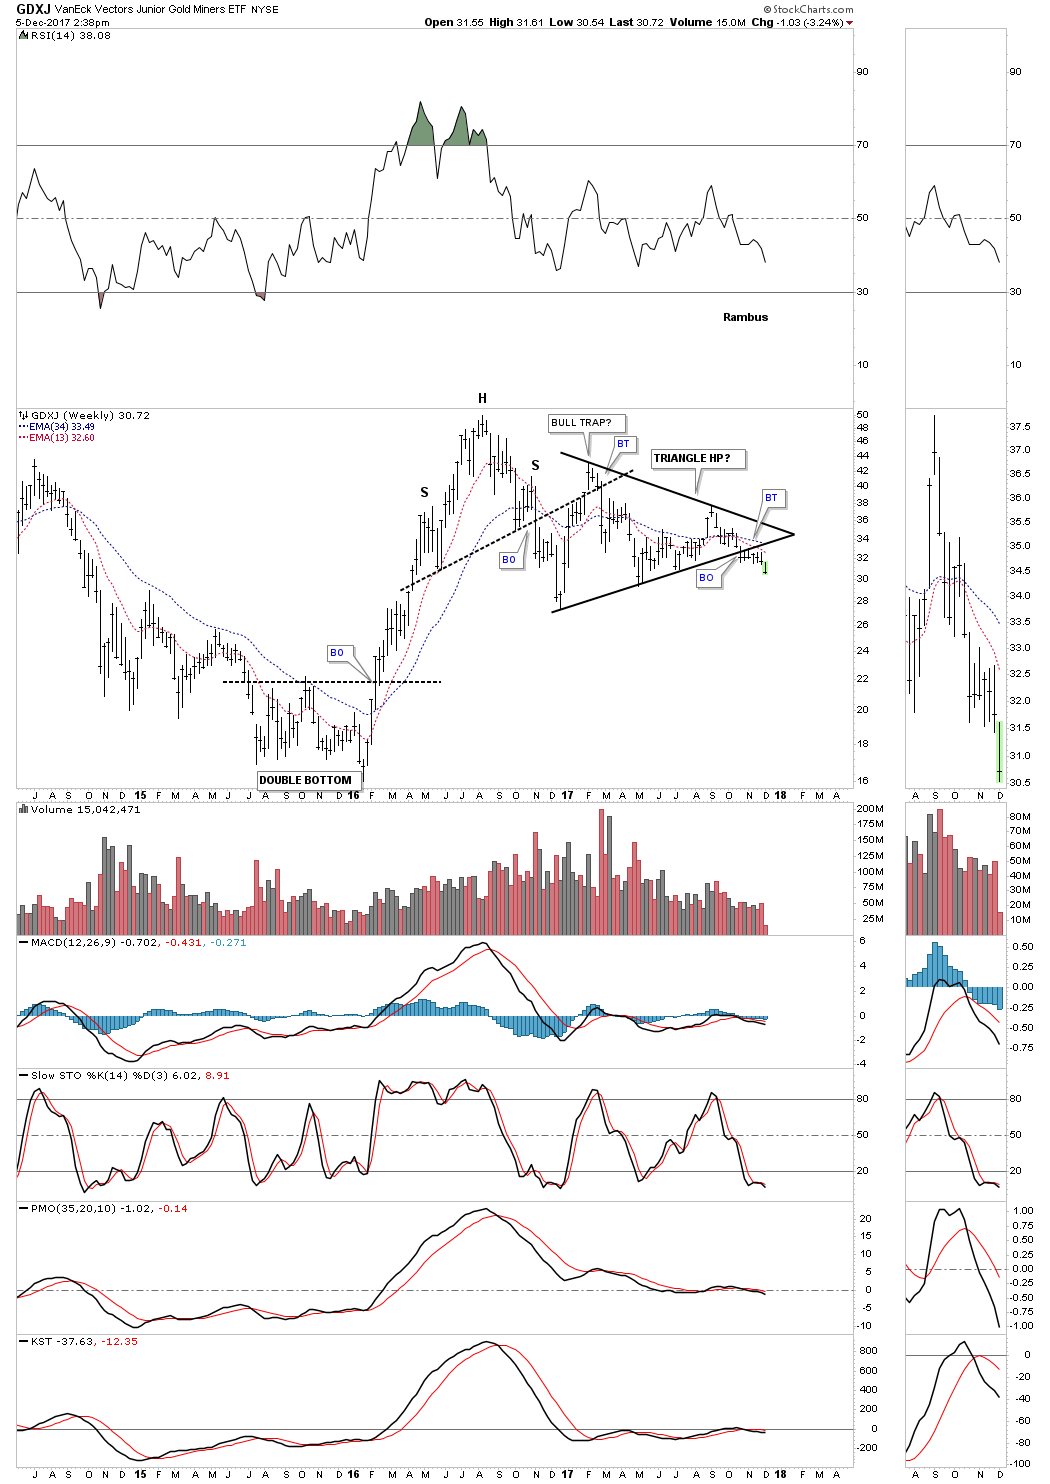
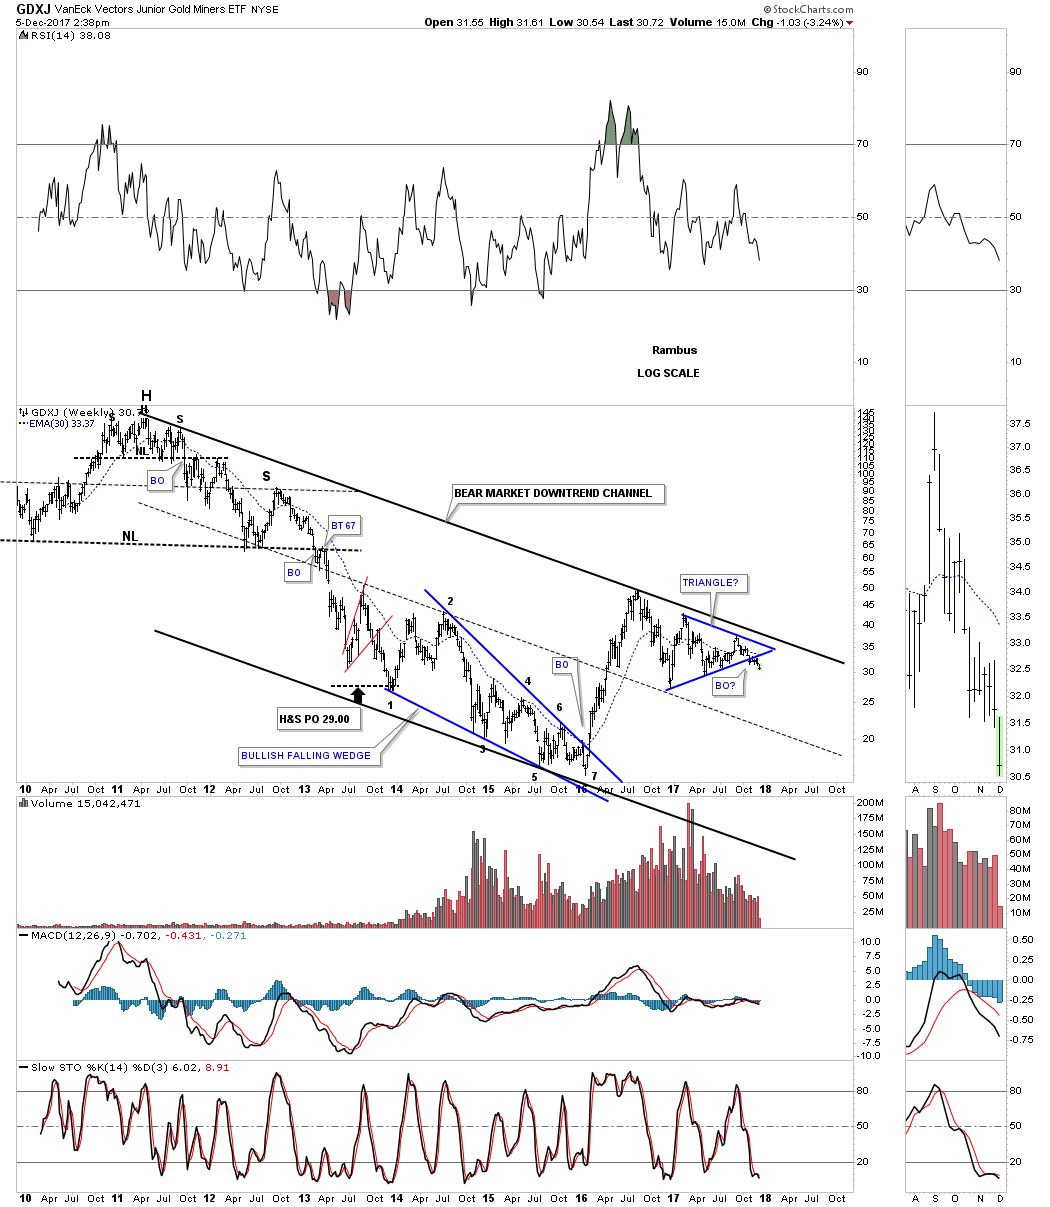
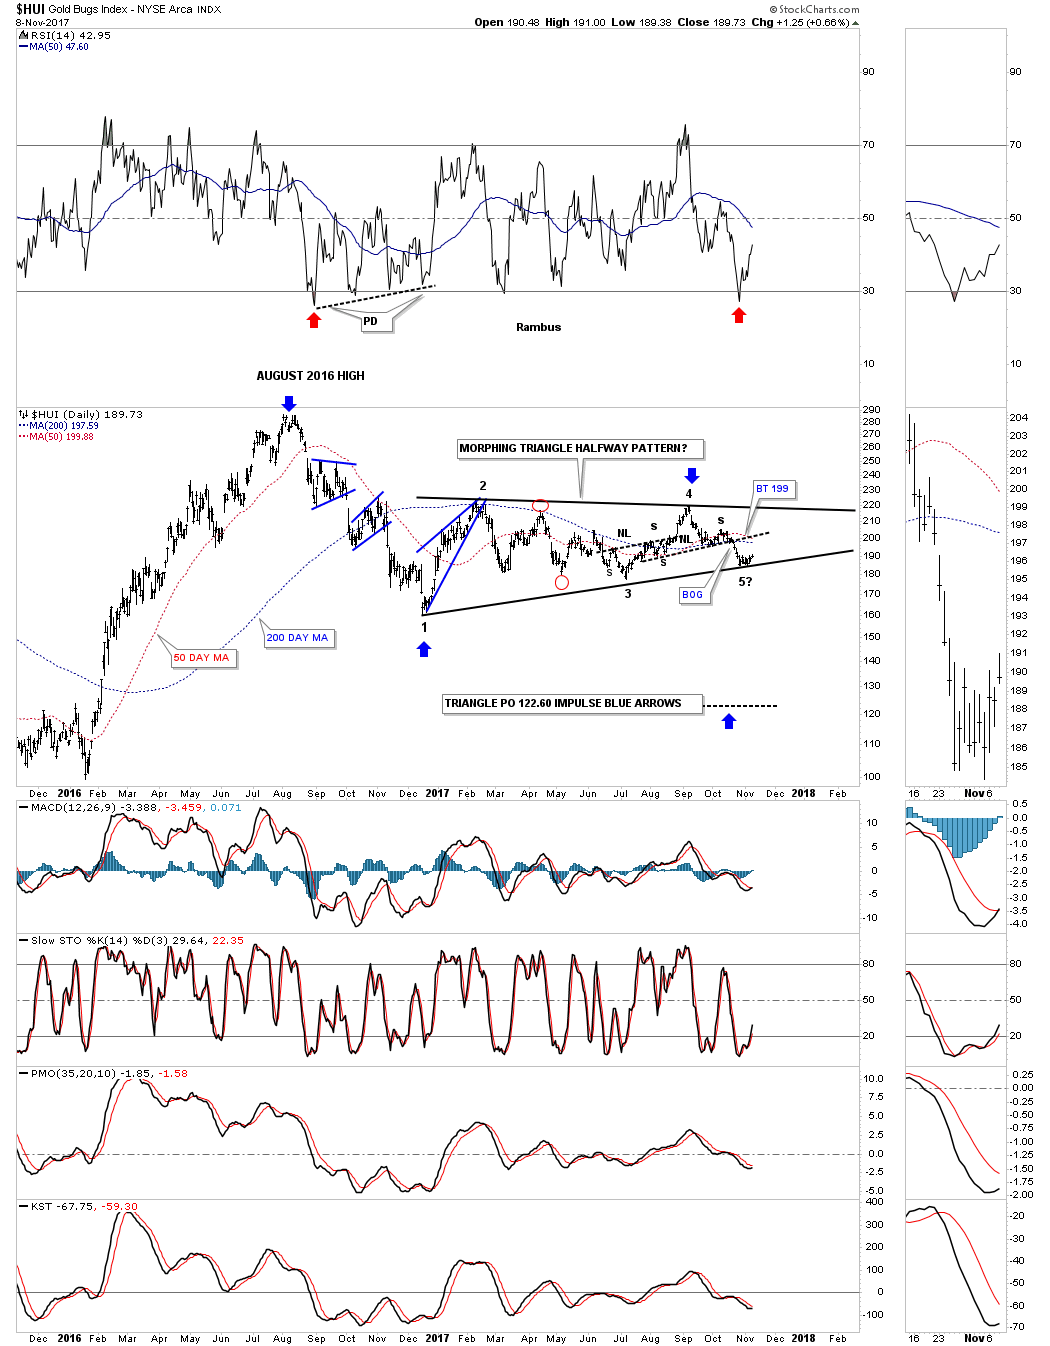
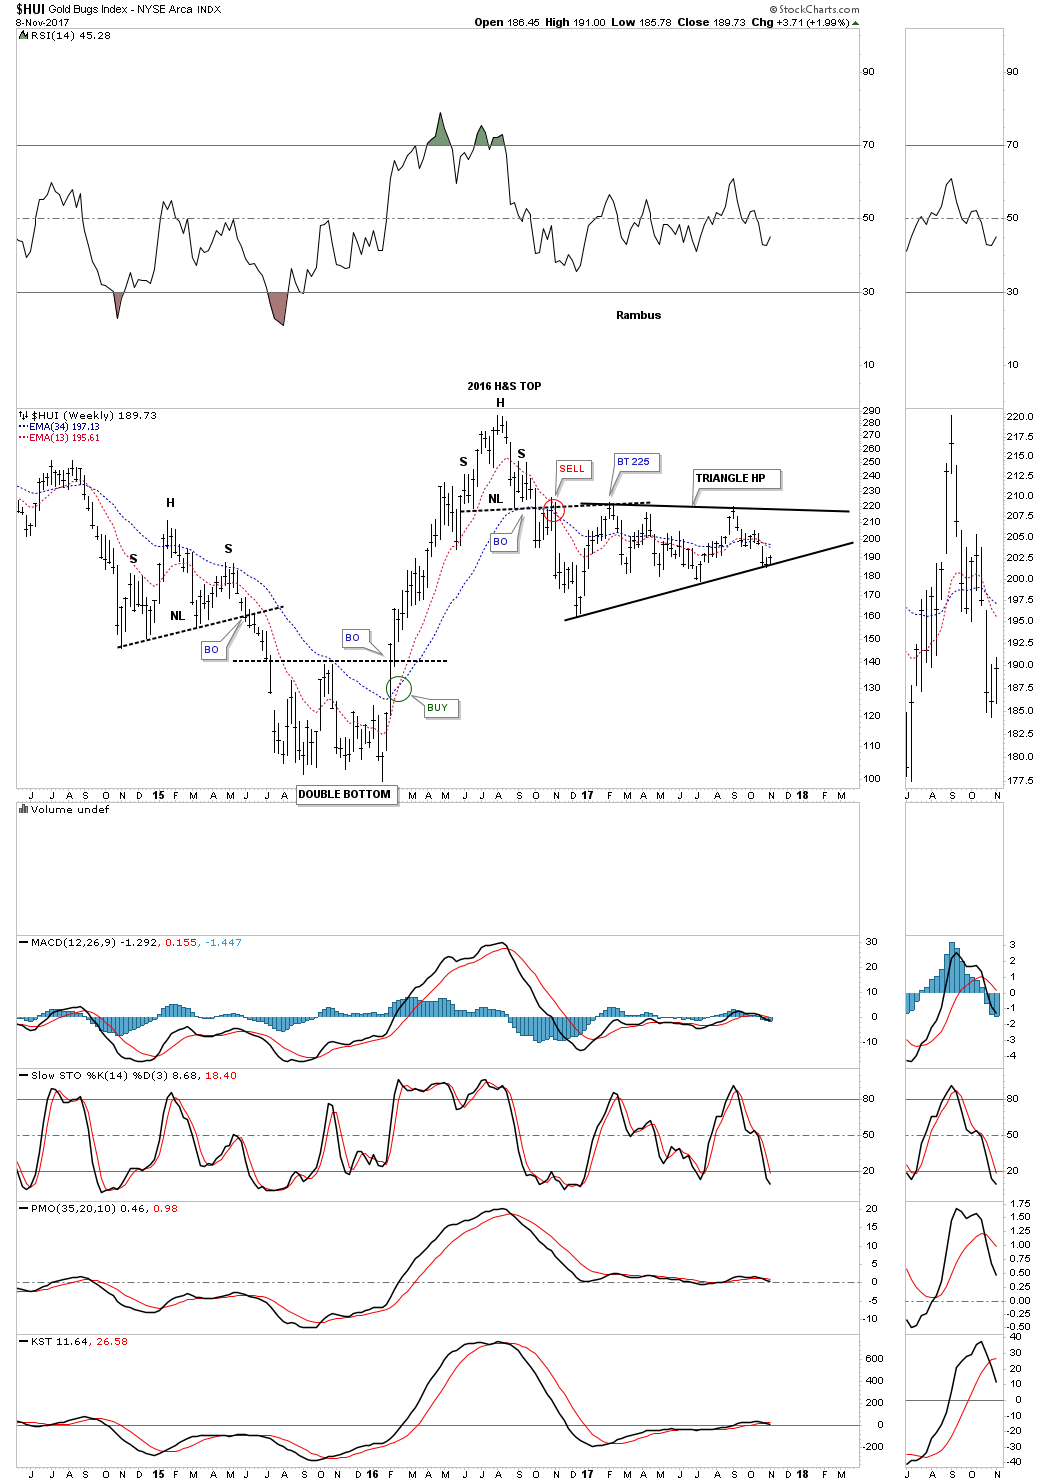
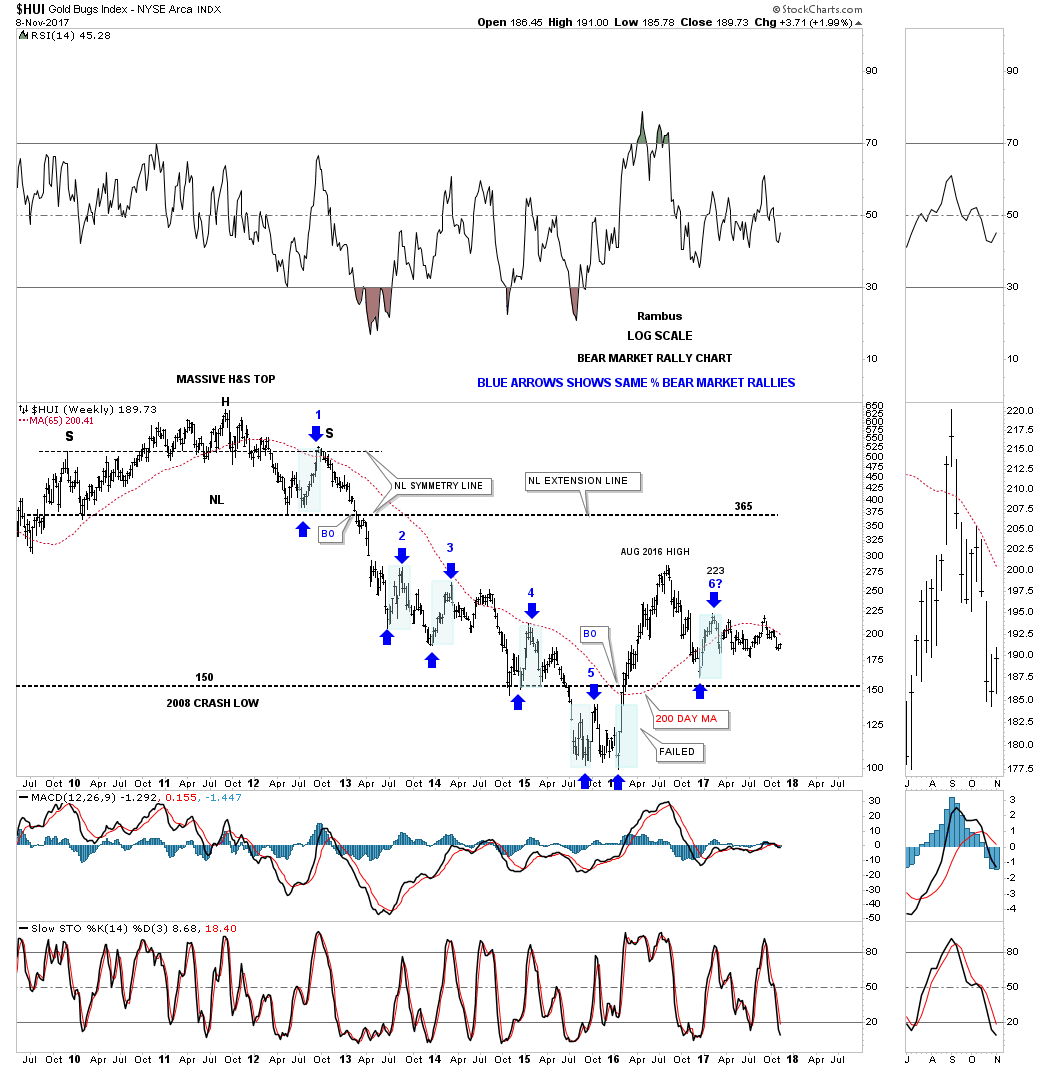
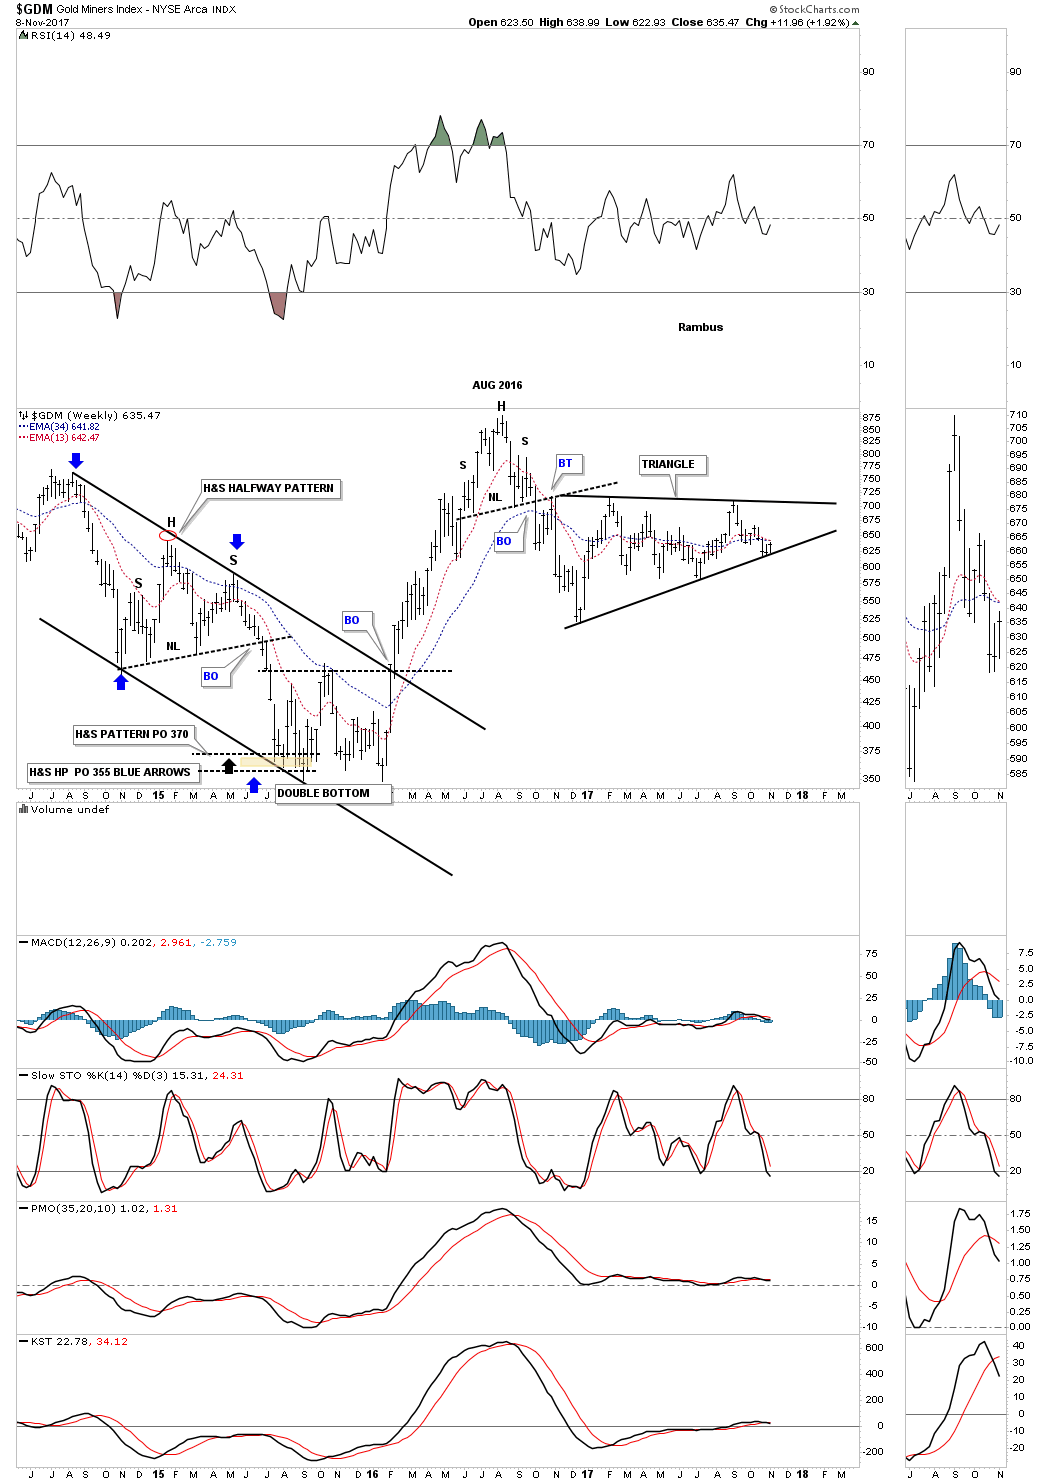
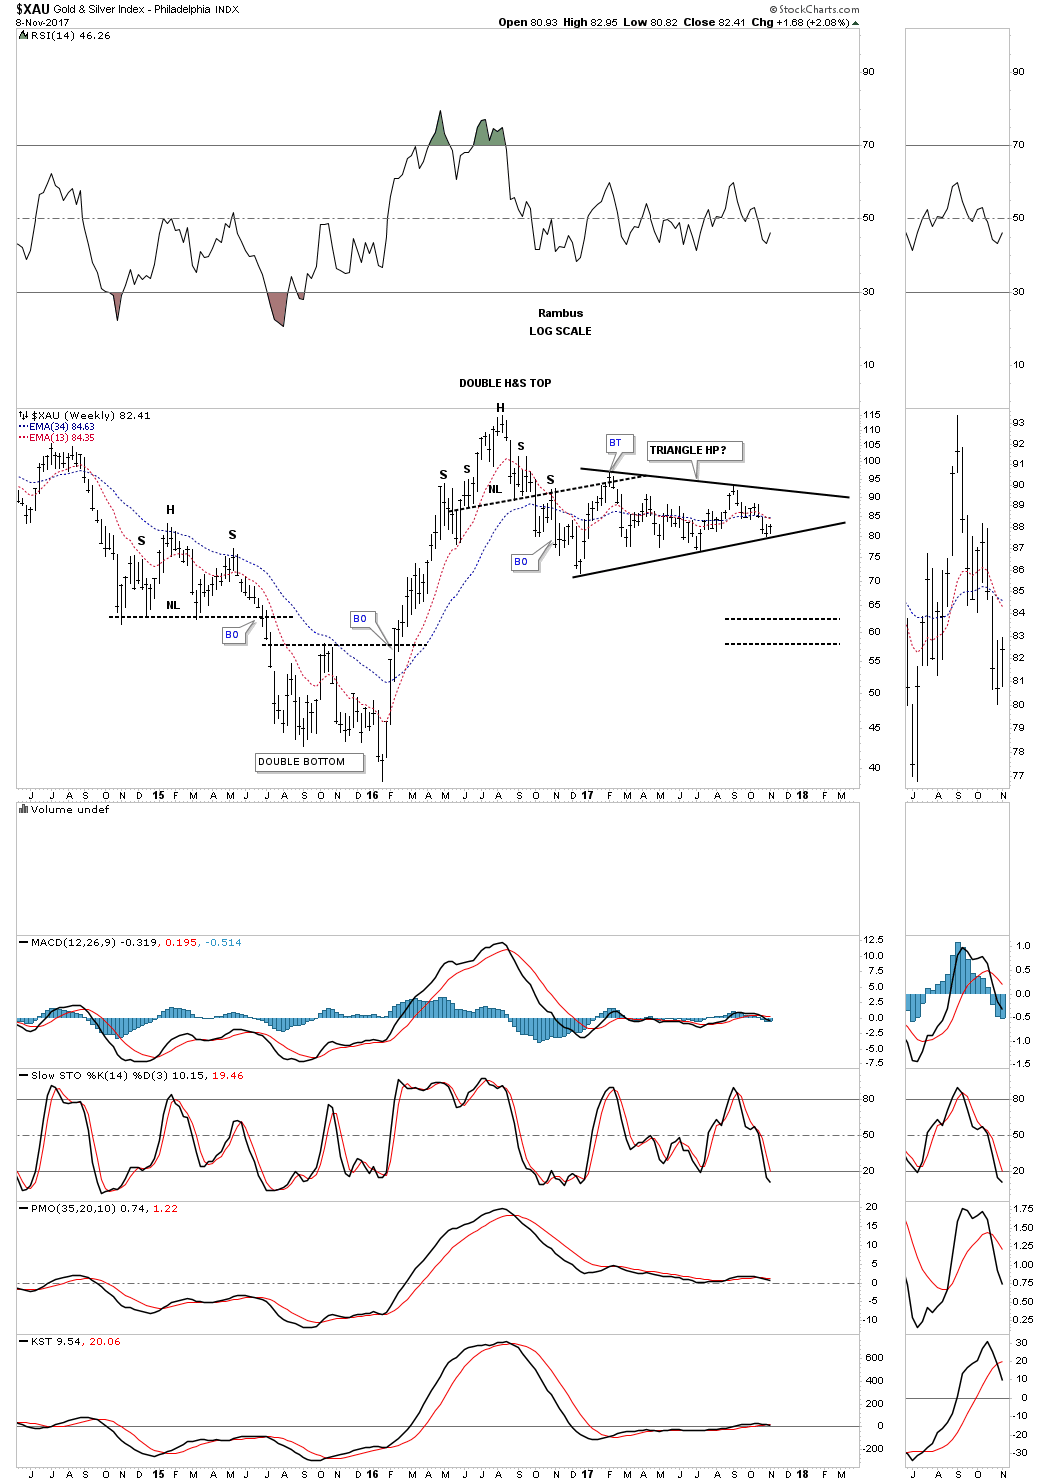
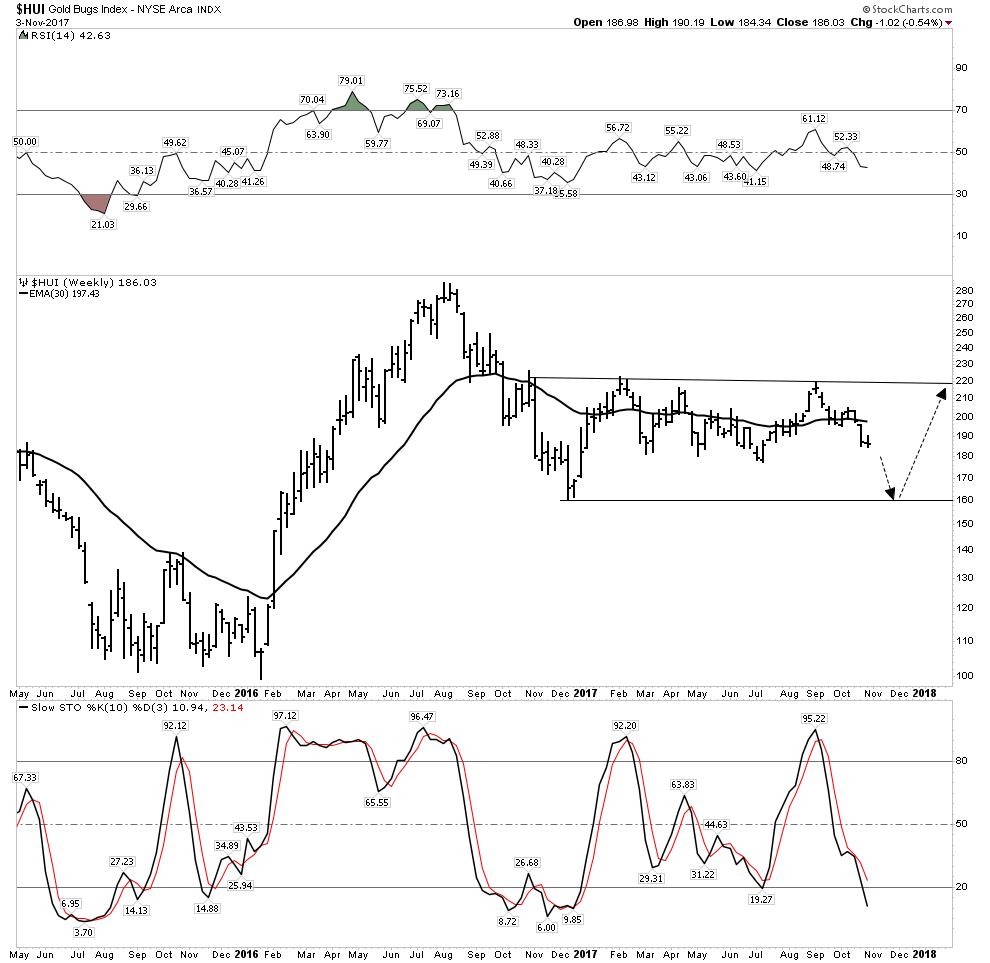
With the USD rallying, gold stocks no longer have a tail wind and the charts reveal this. The weekly HUI shows the saucer bottom continuing to develop, but it is very heavy.
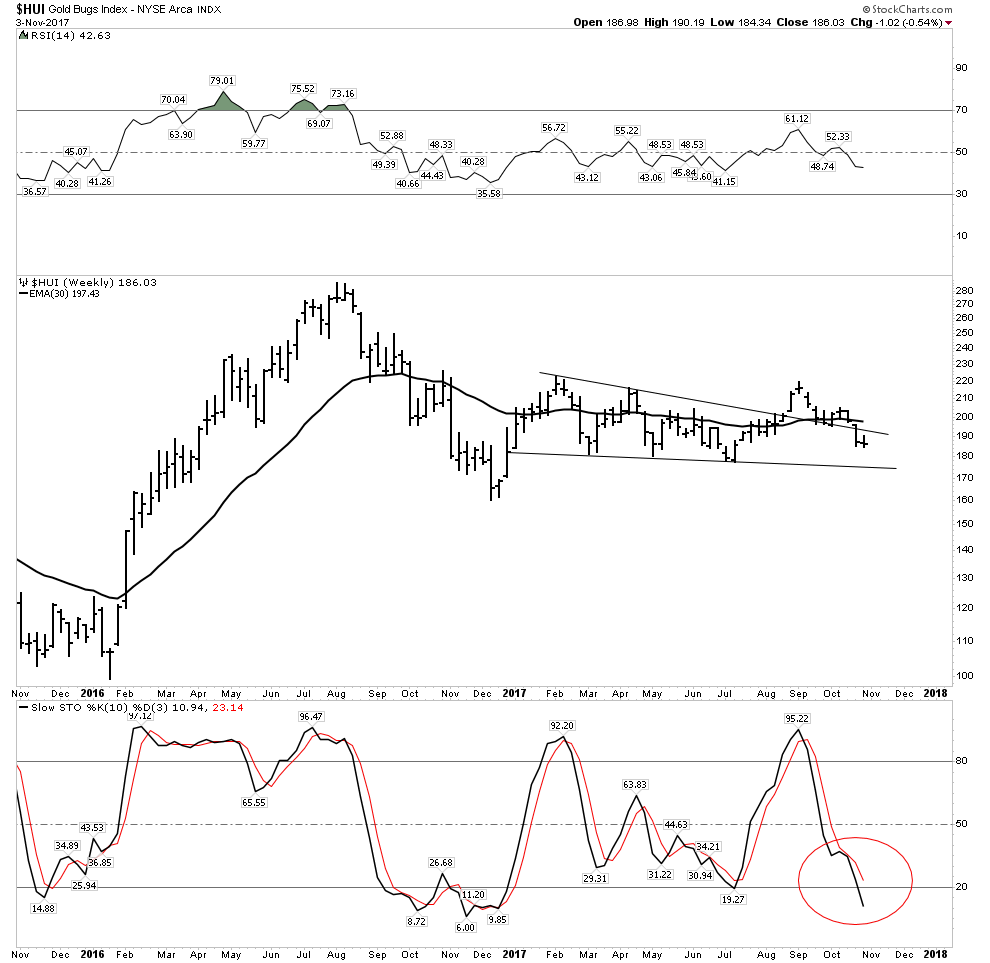
A close up of the weekly HUI below shows how it has dropped down into its consolidation triangle. Below a declining 30 EMA with stochastics pointing sharply lower with no hint of reversing. This chart is indicating price is likely to drop at least to the low 170’s.
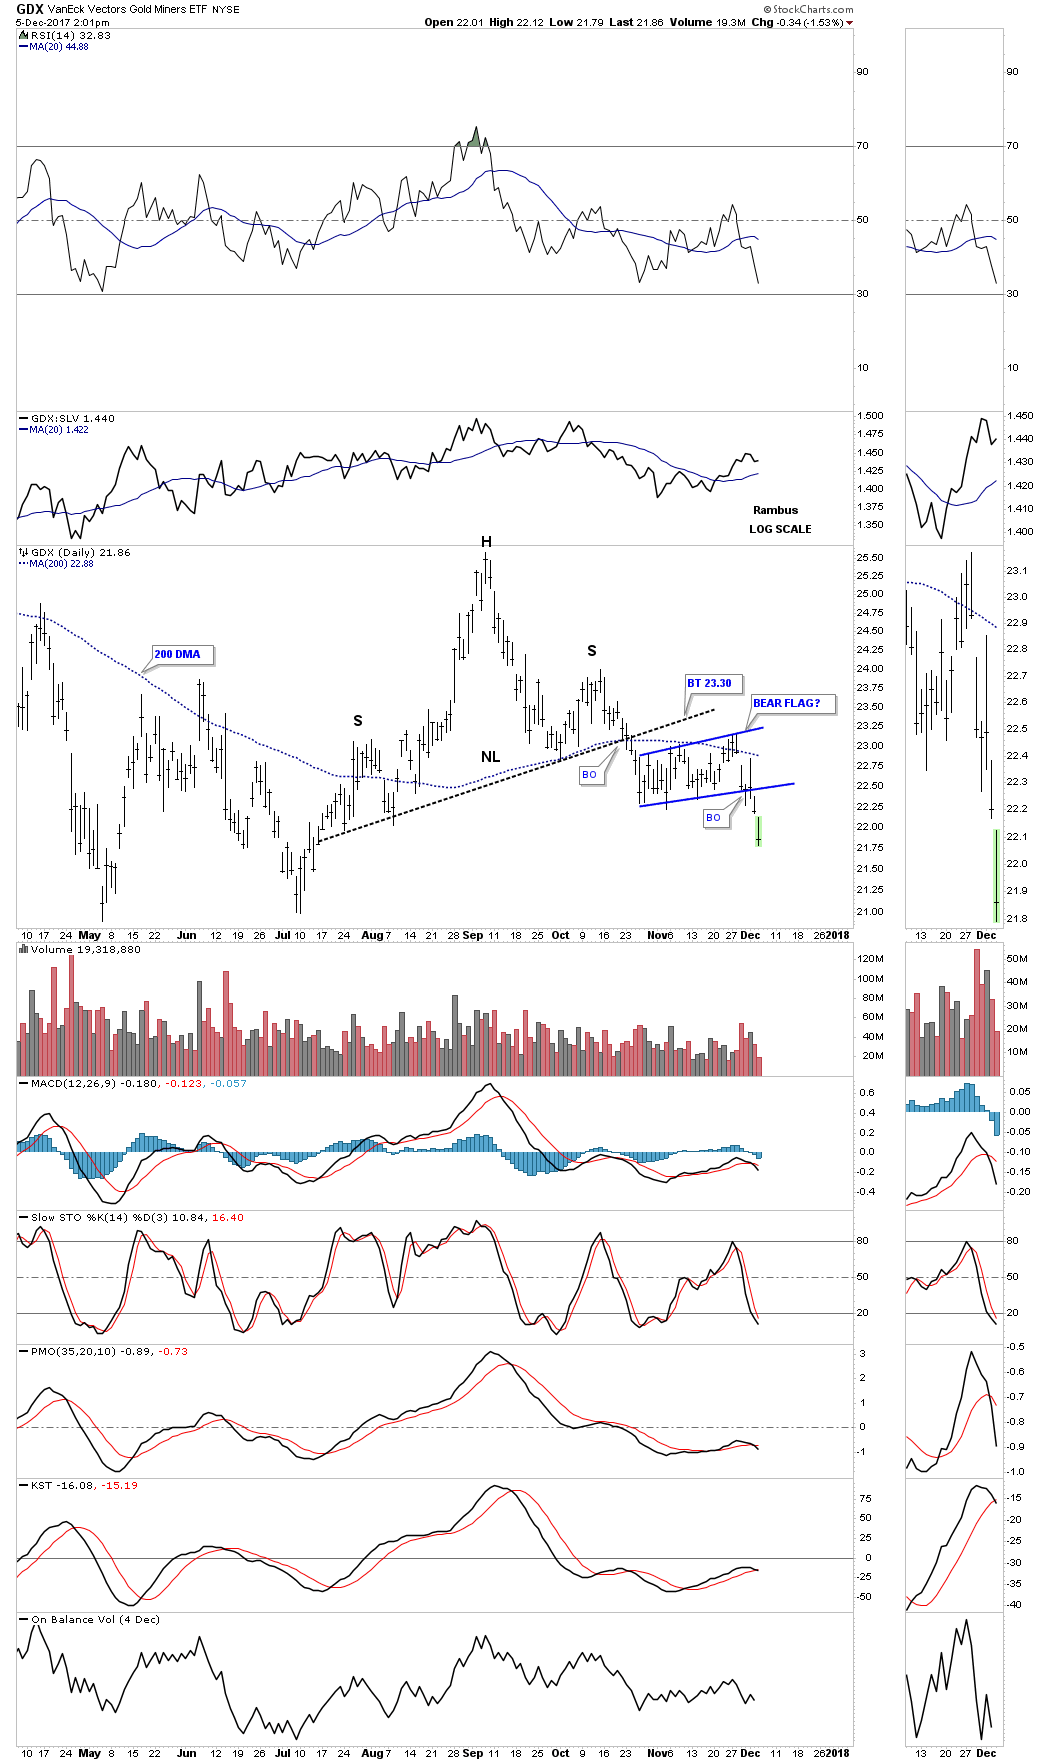
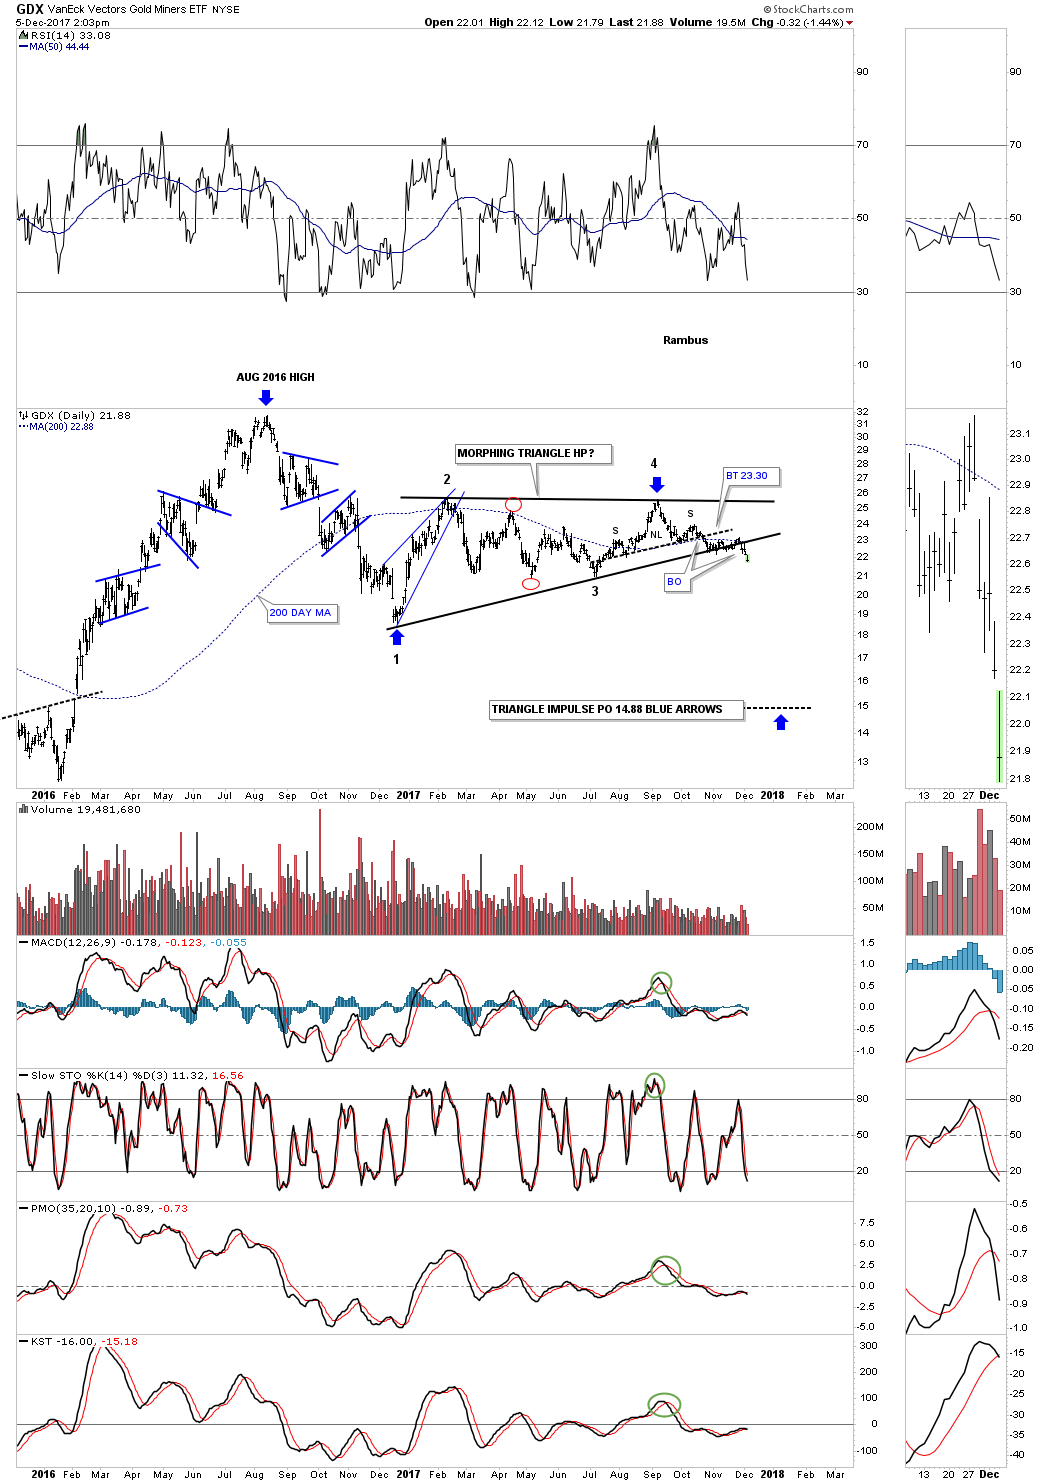
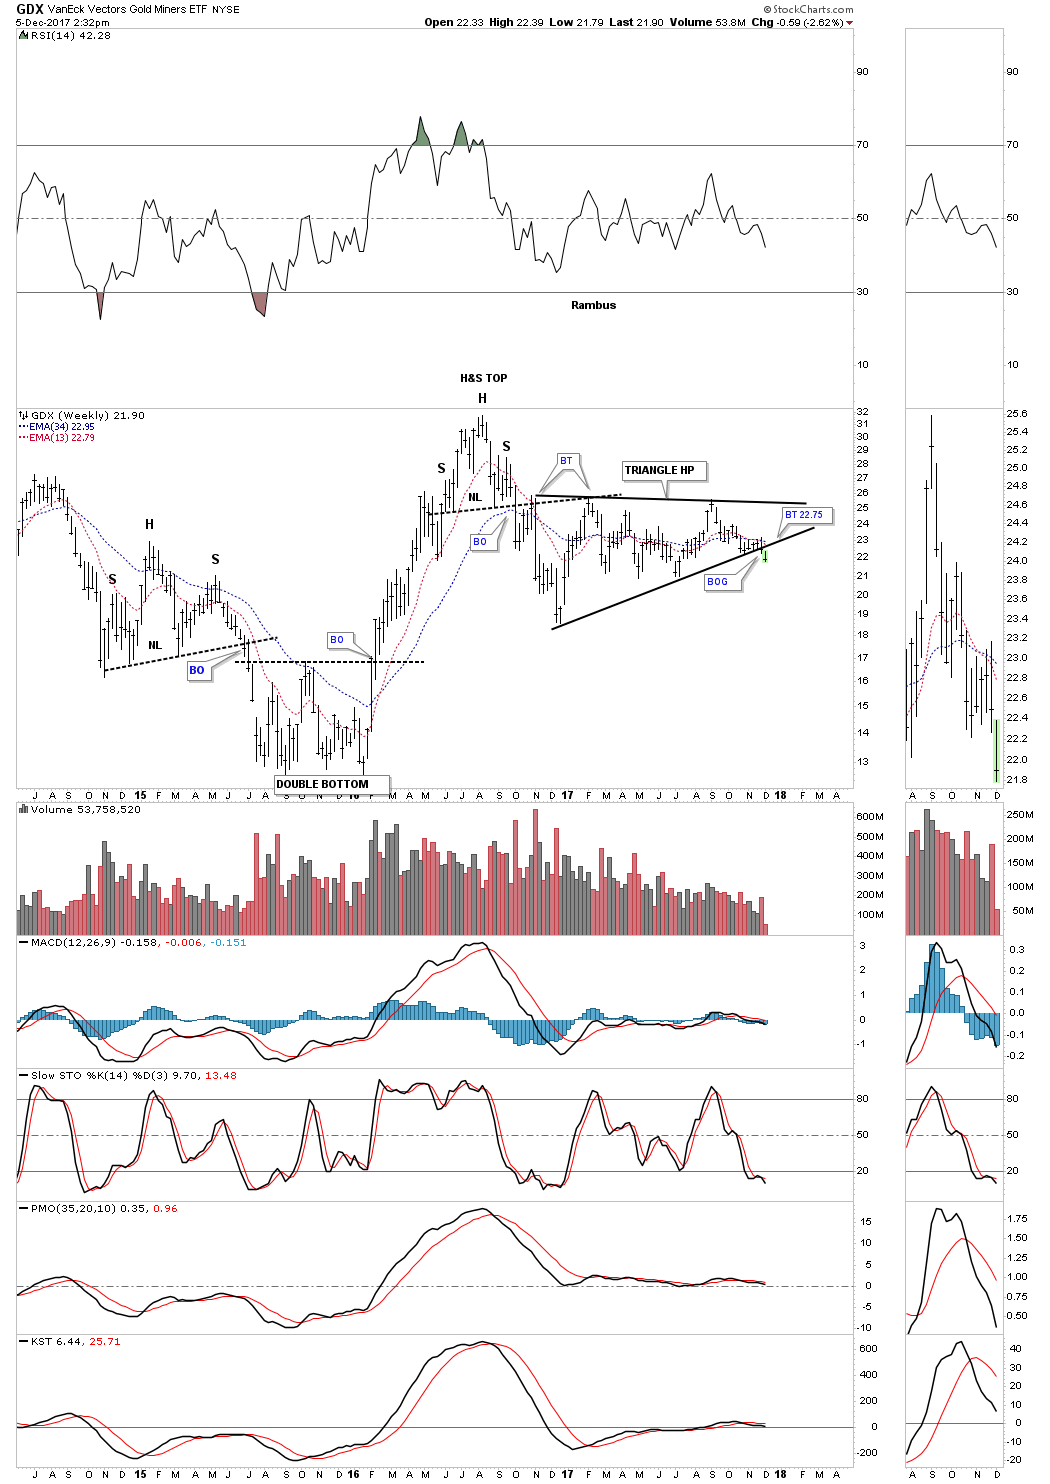
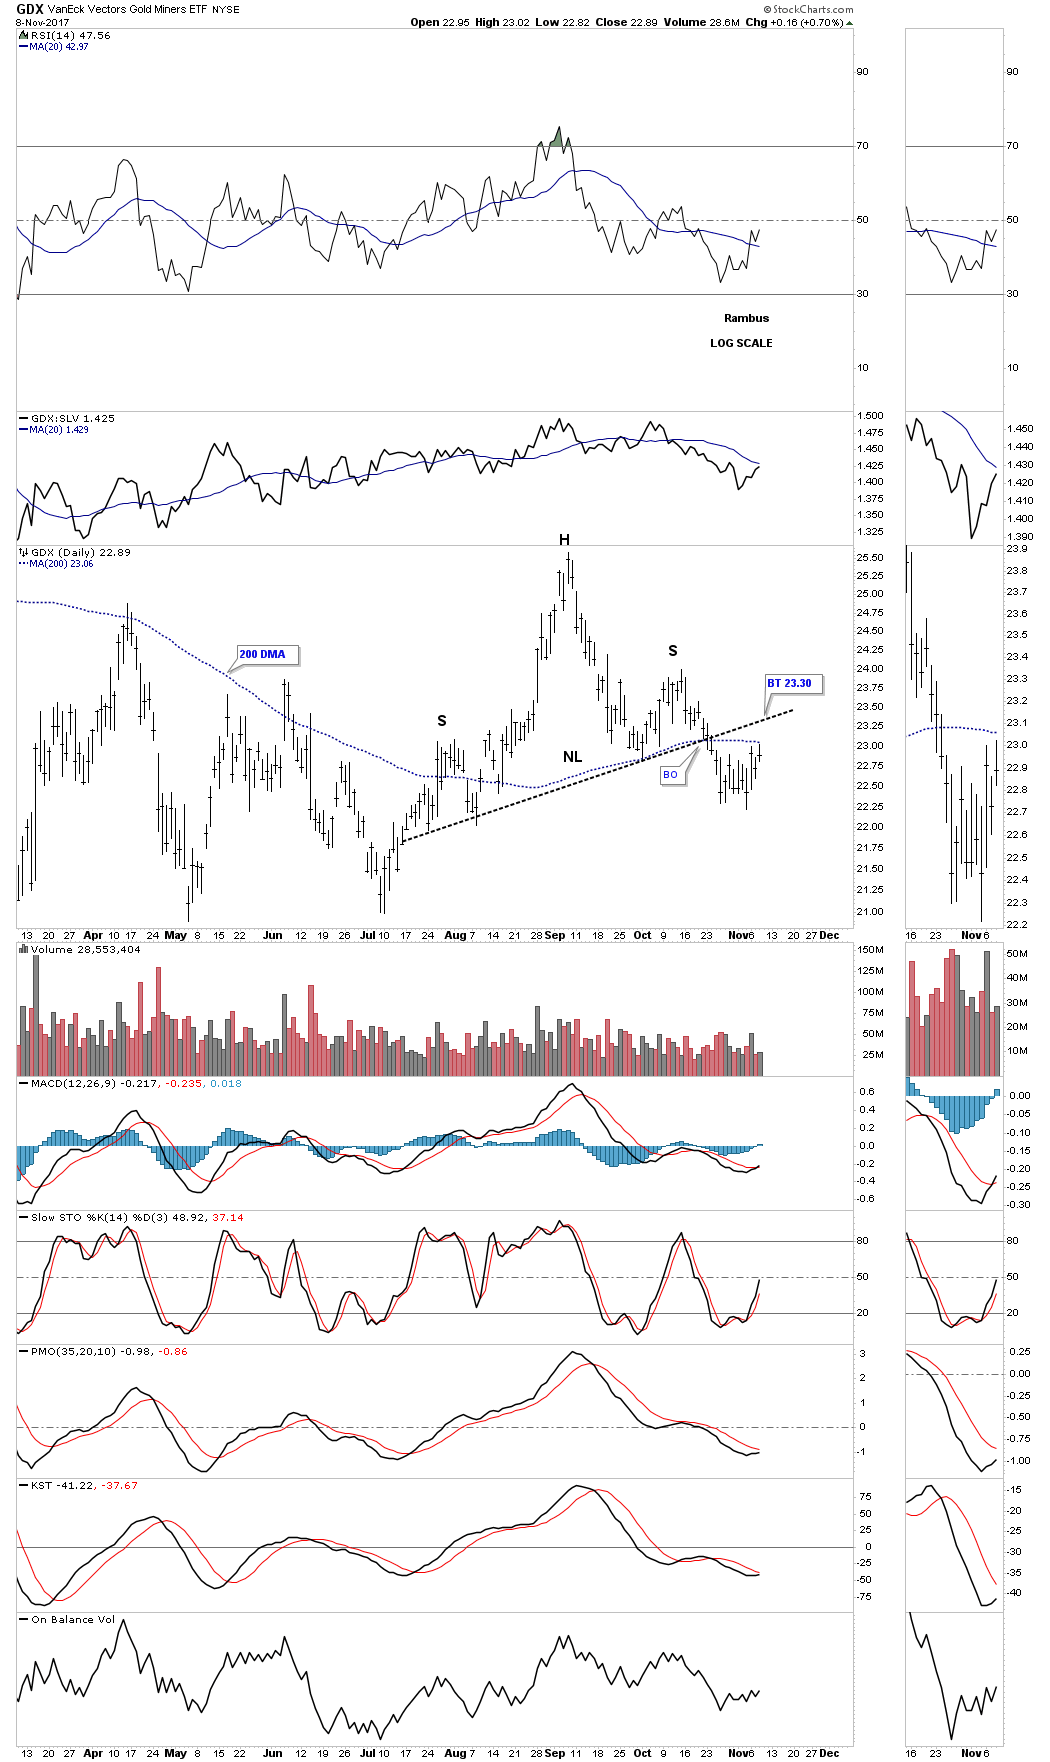
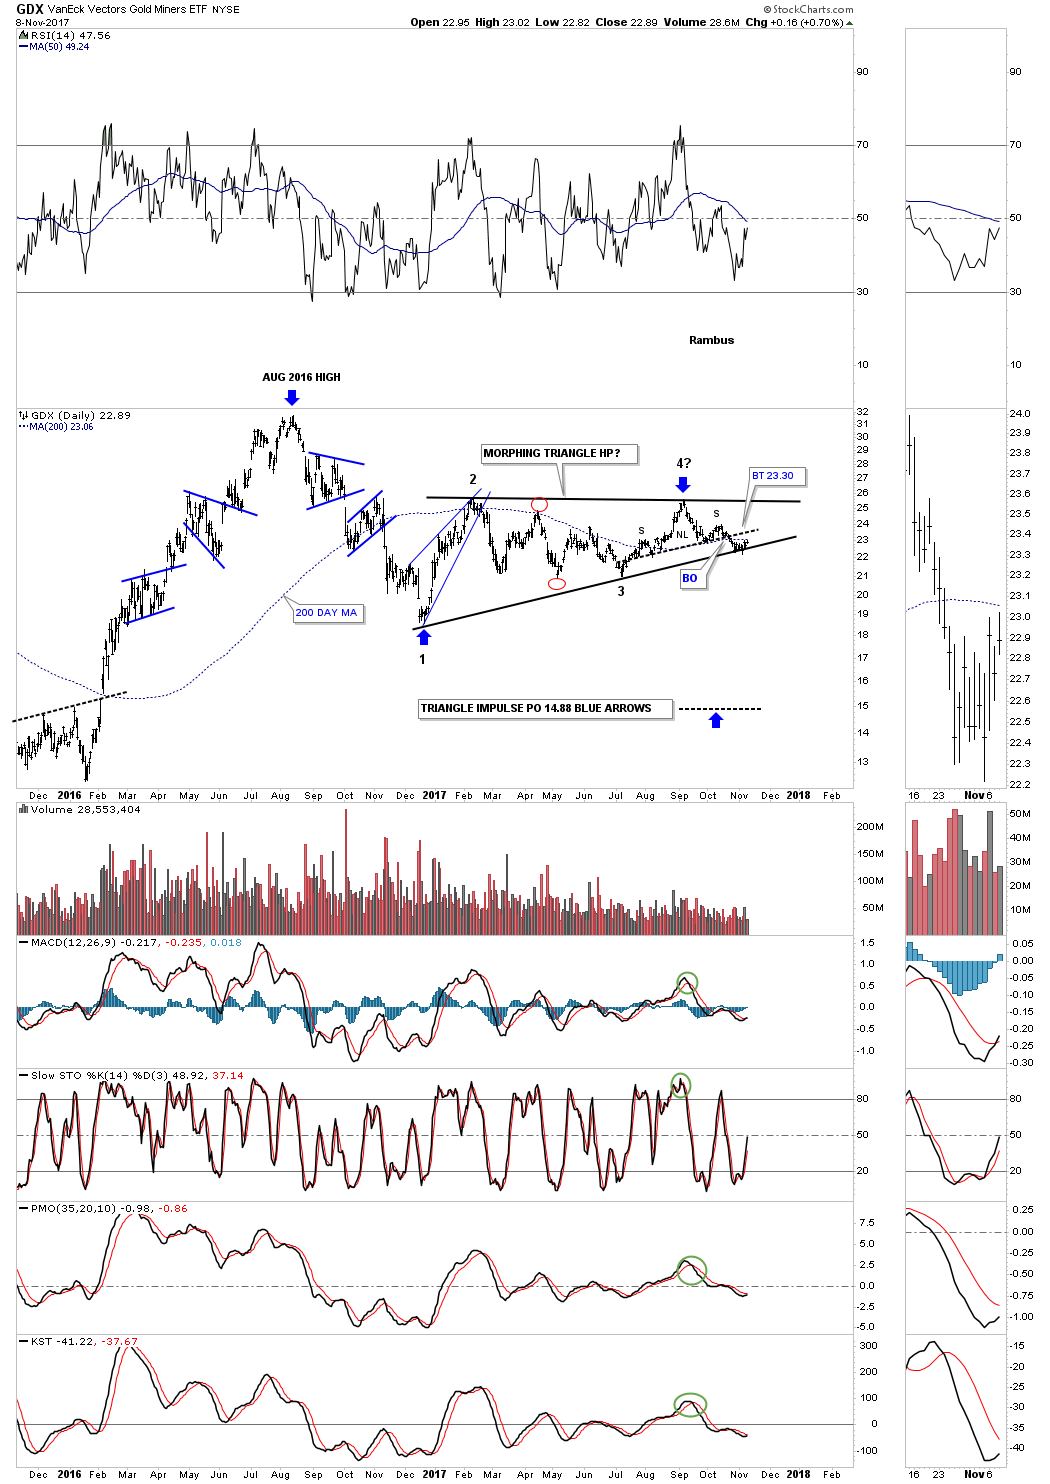
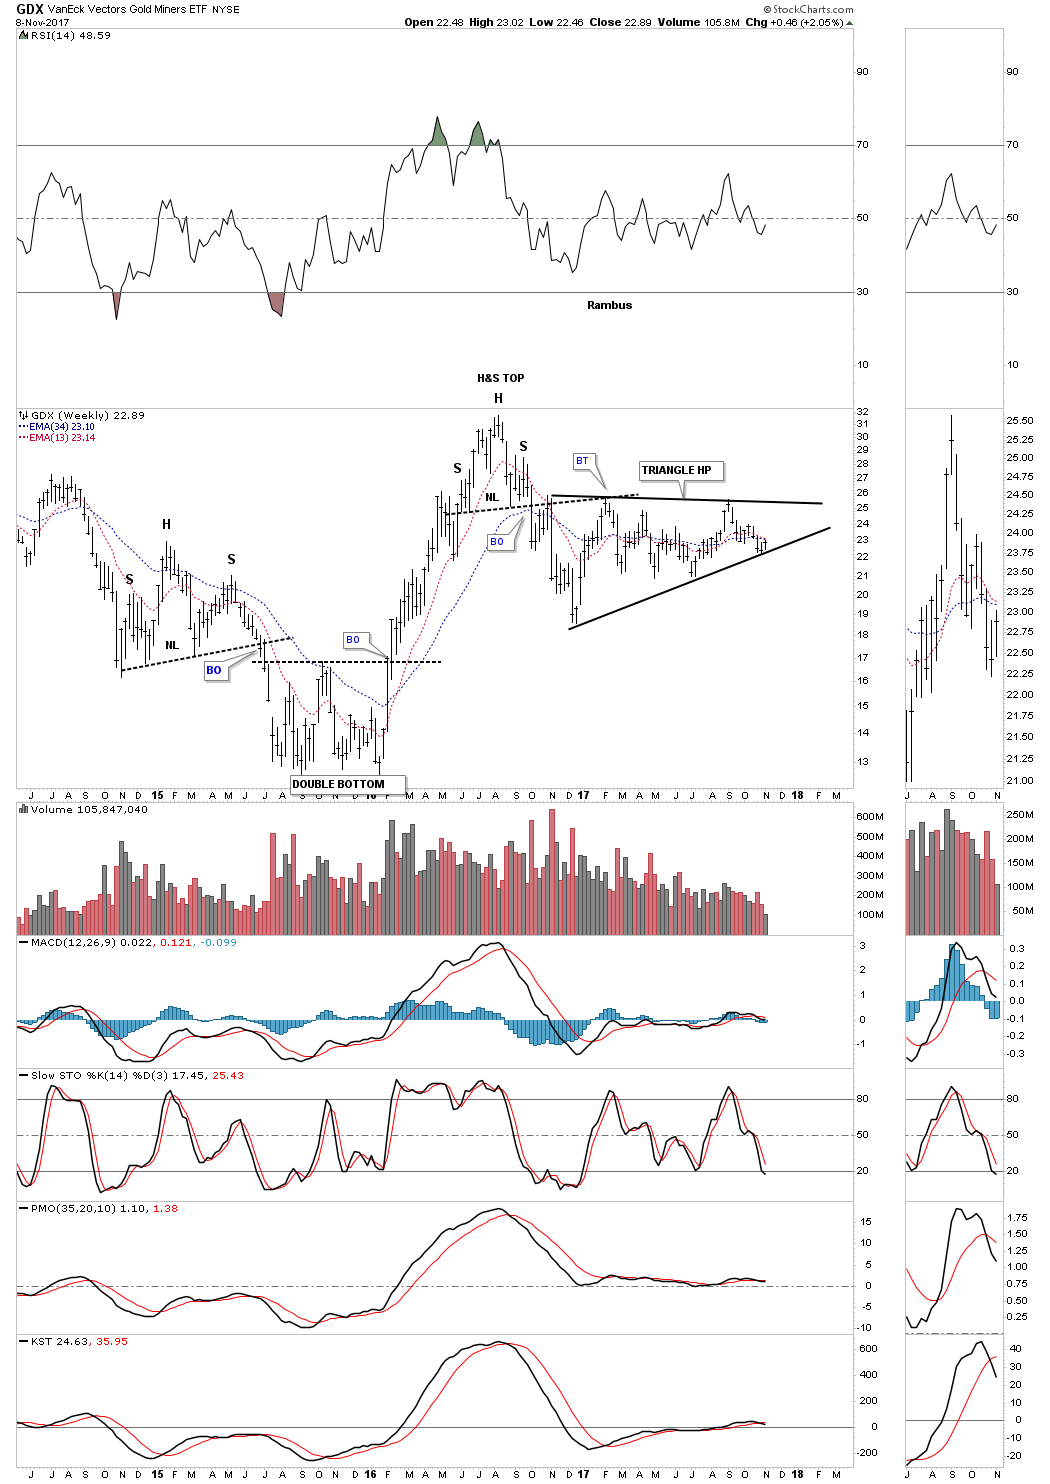
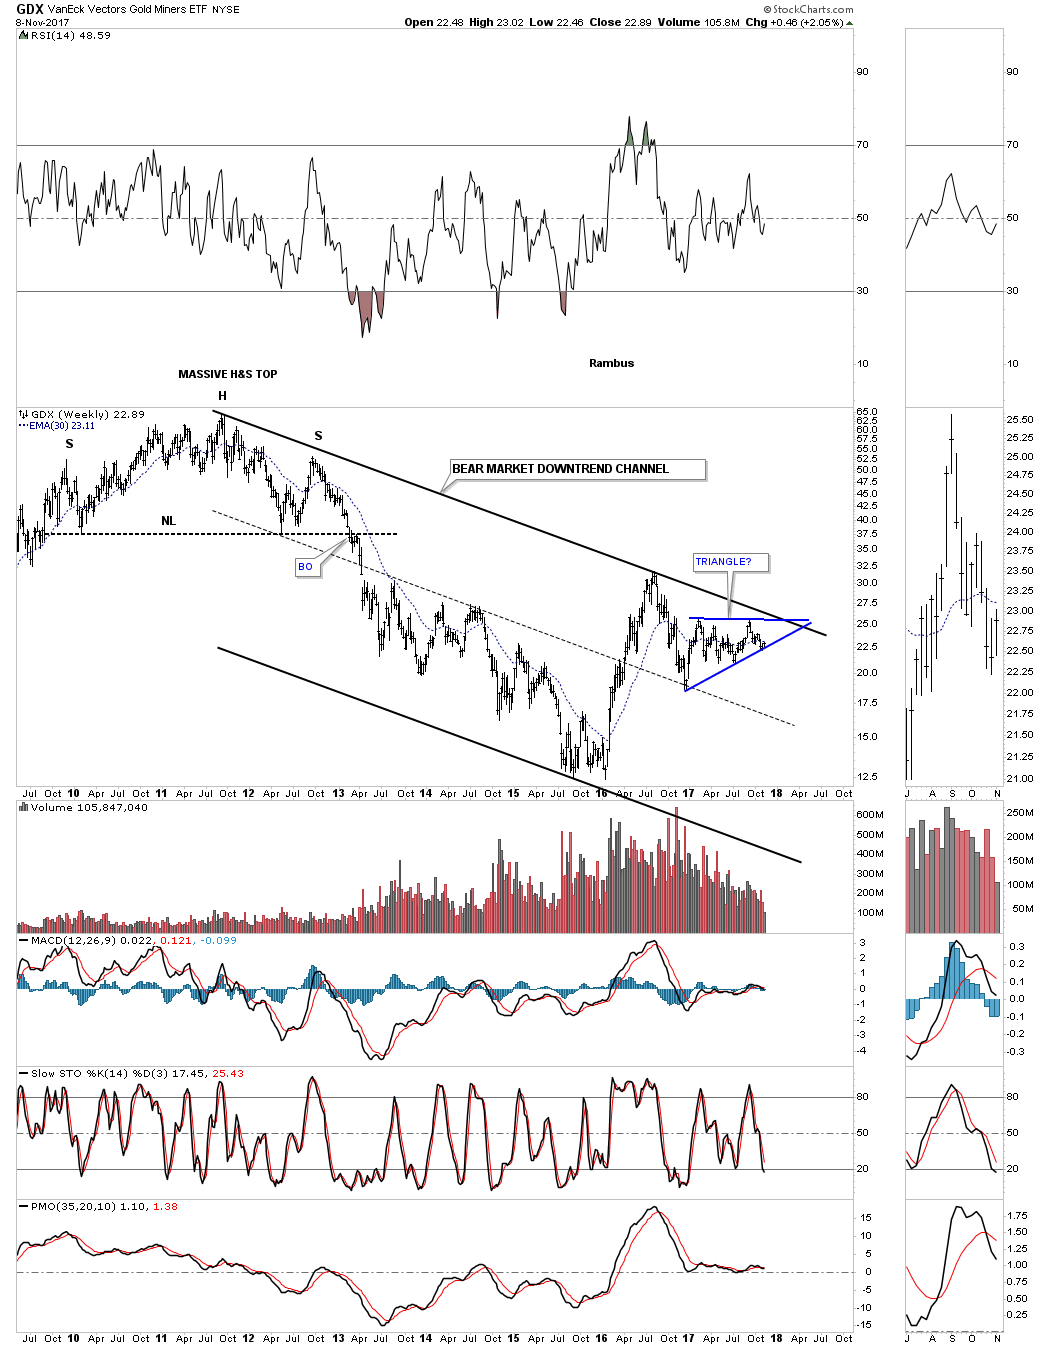
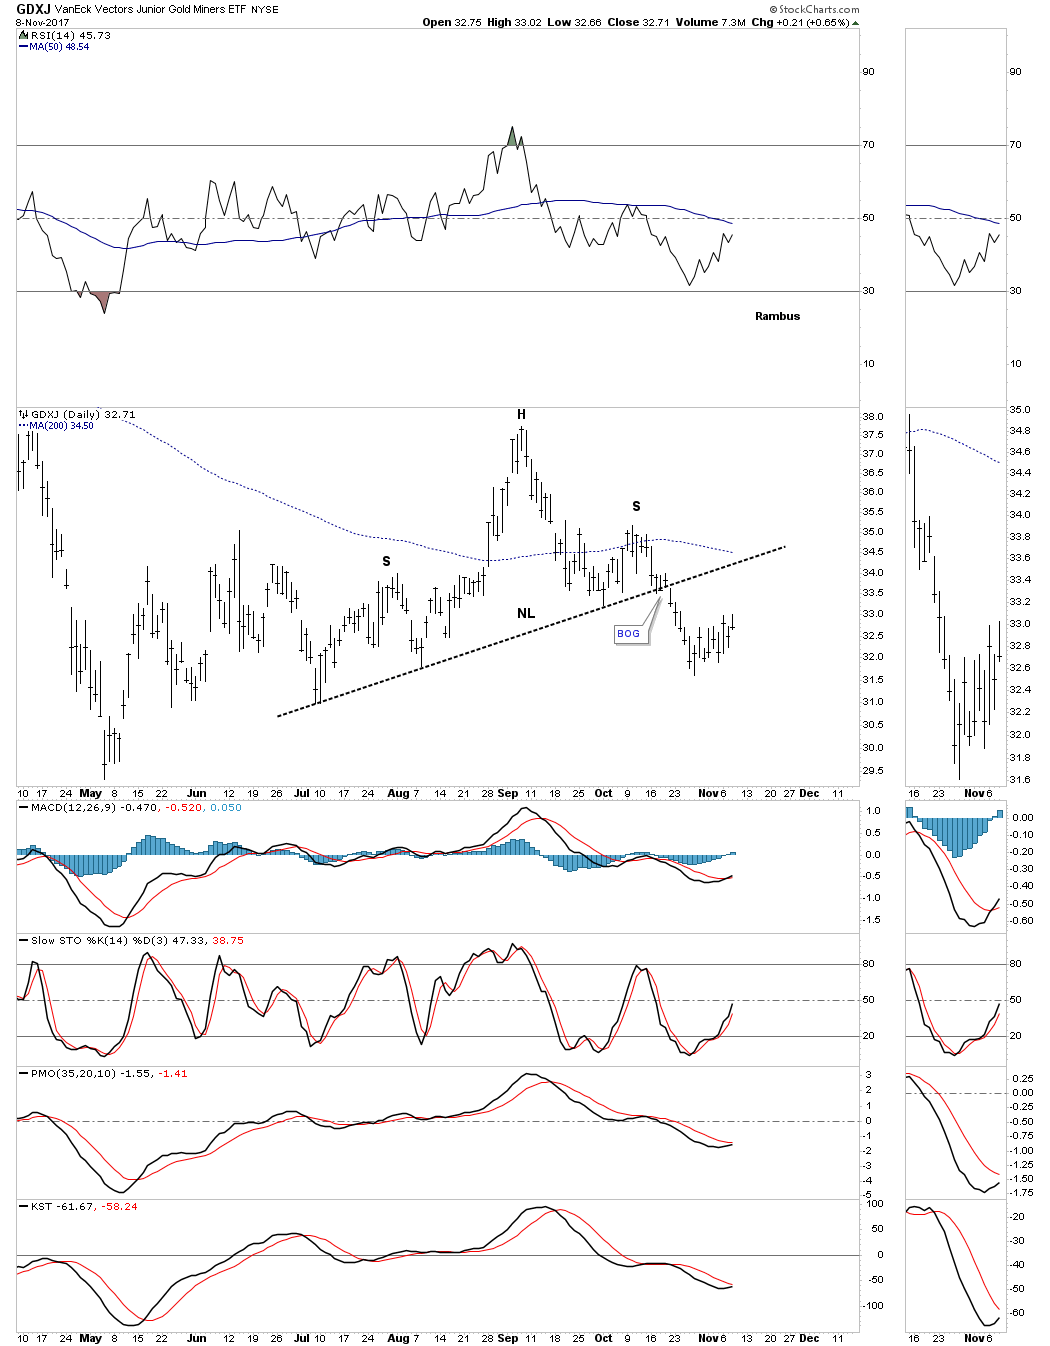
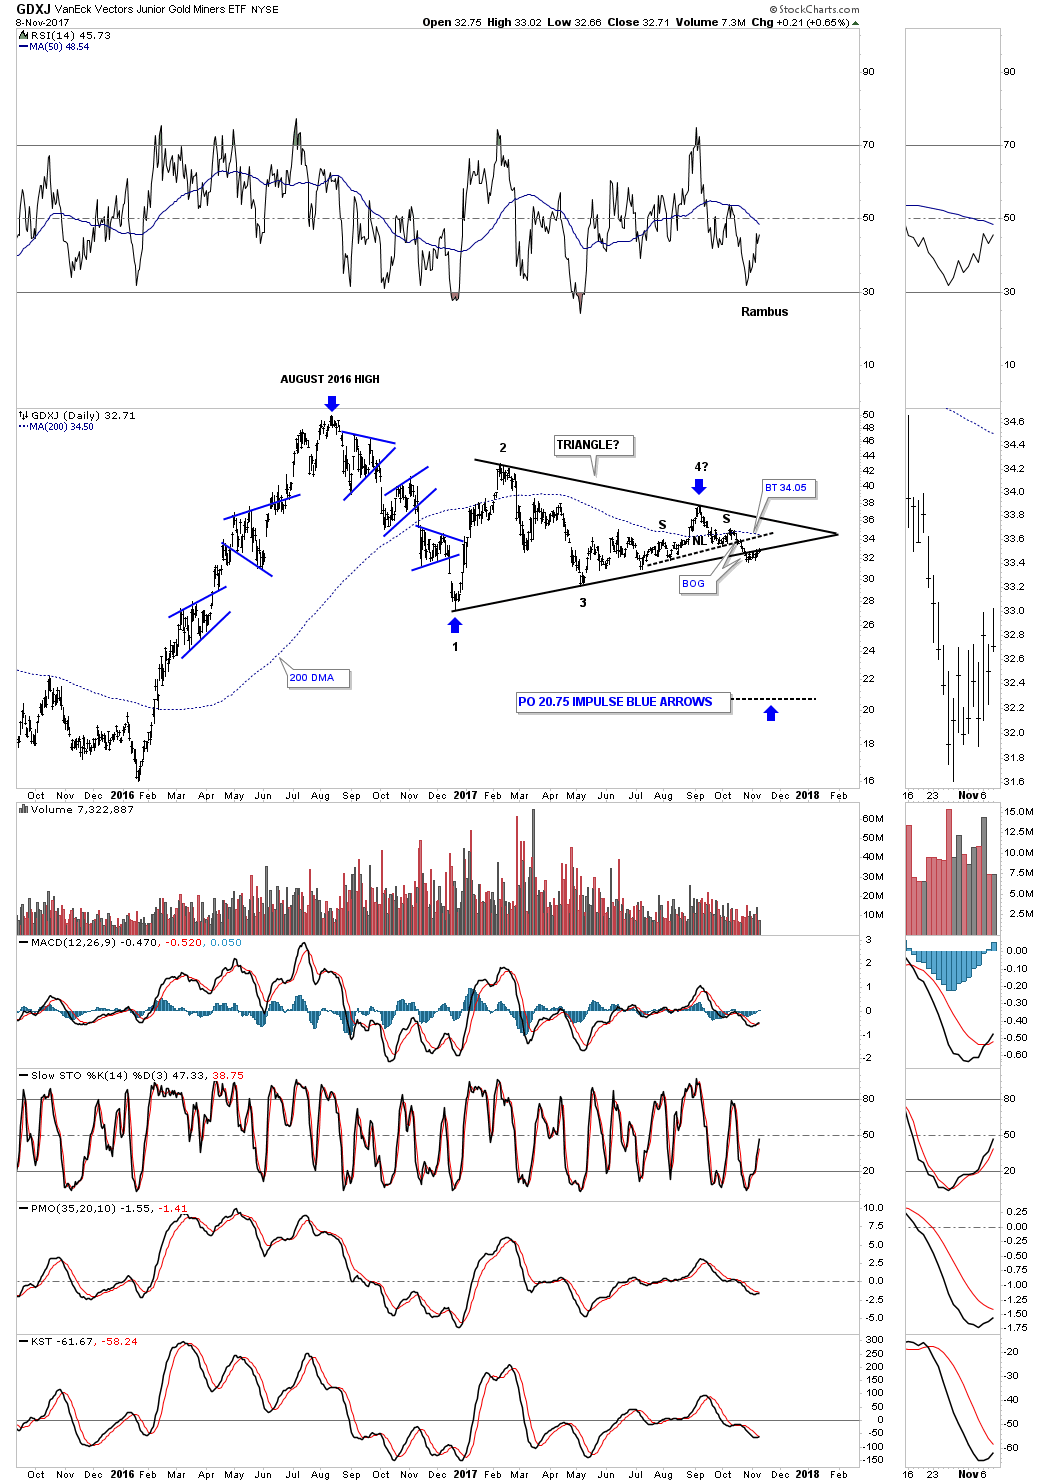
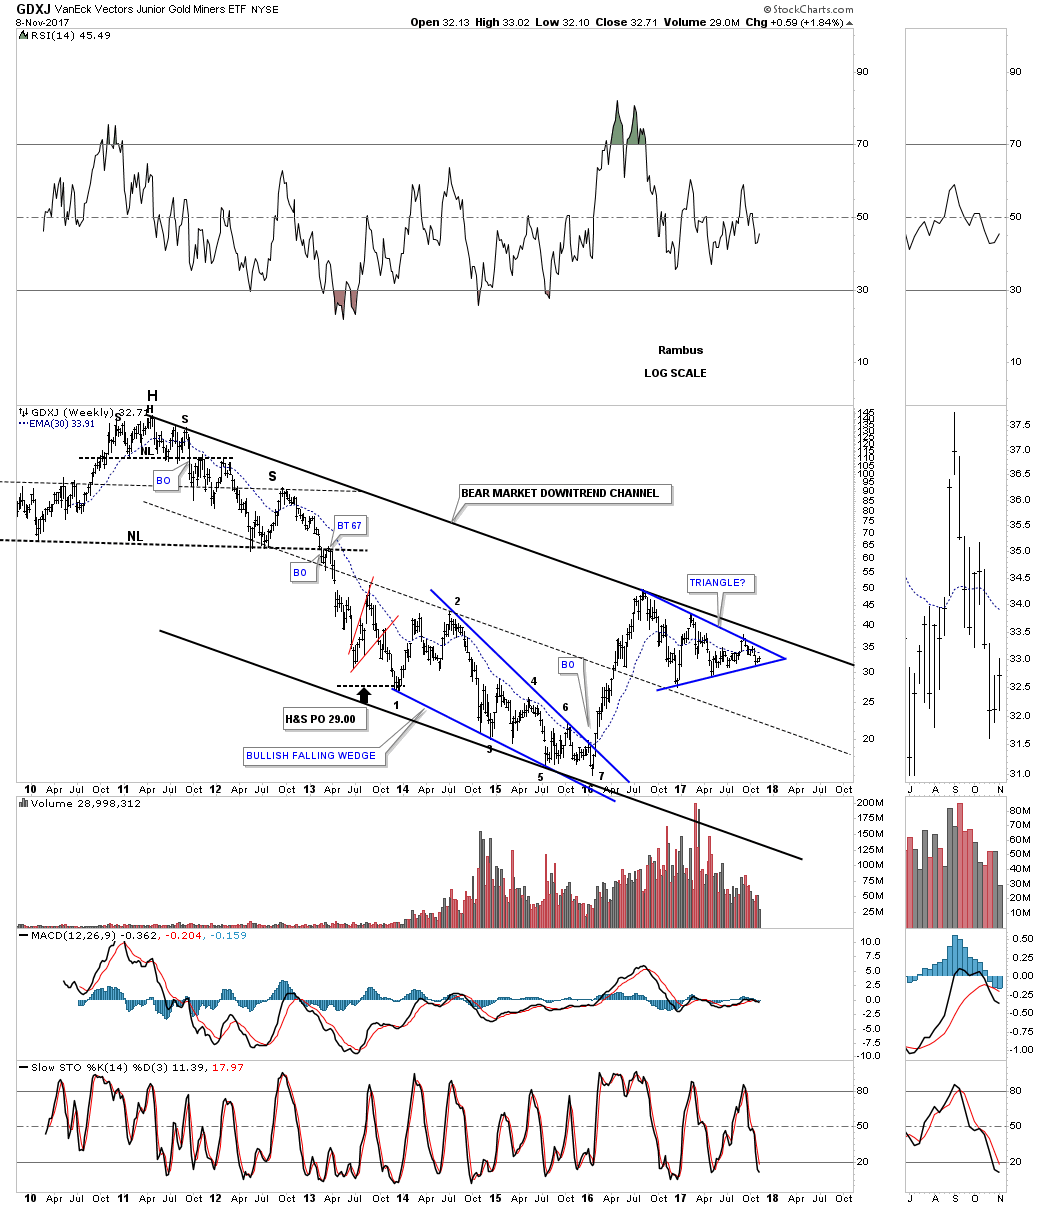
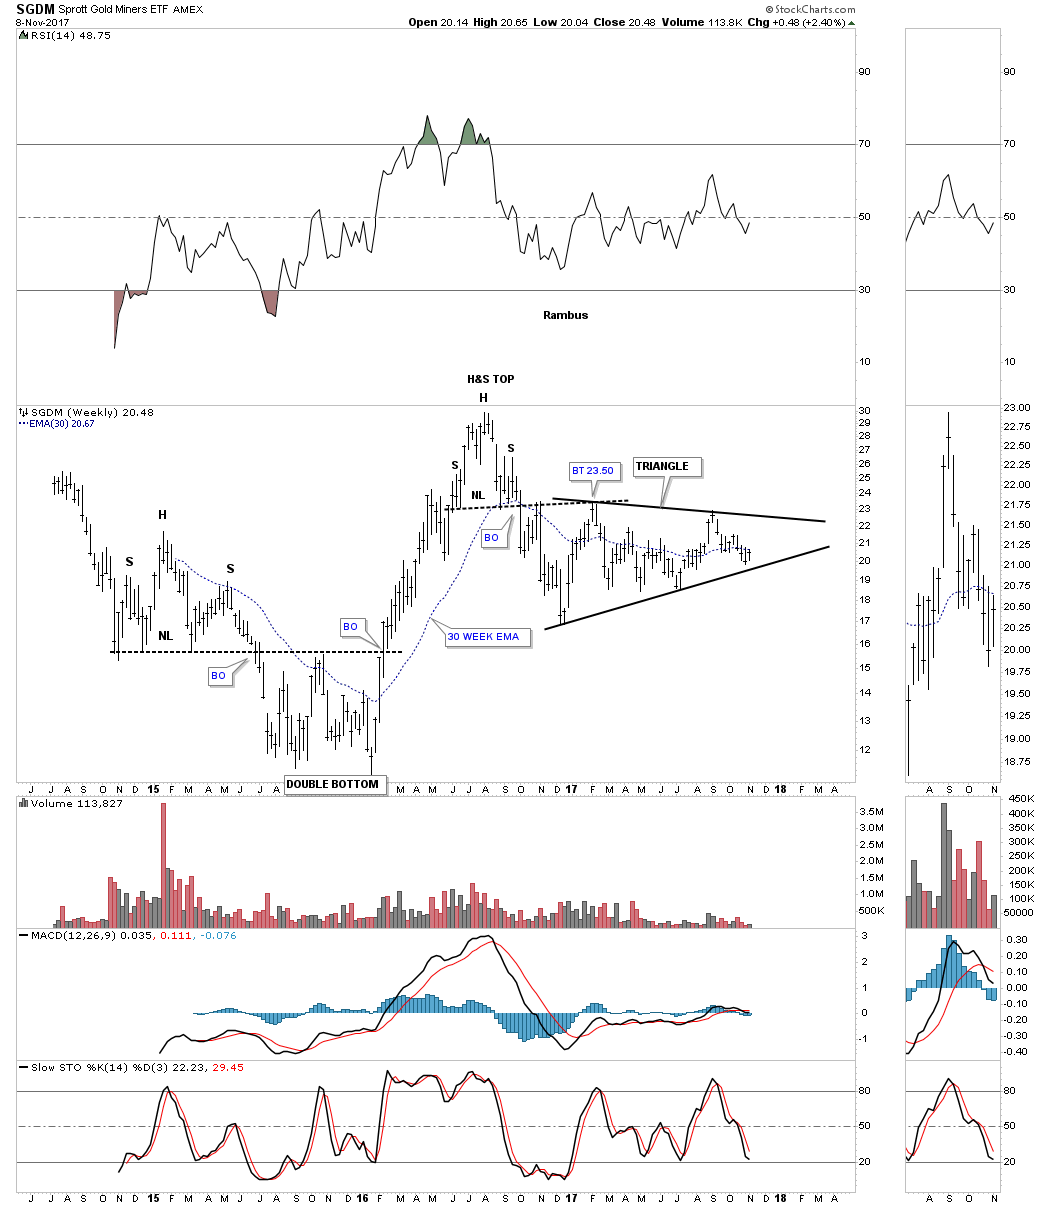
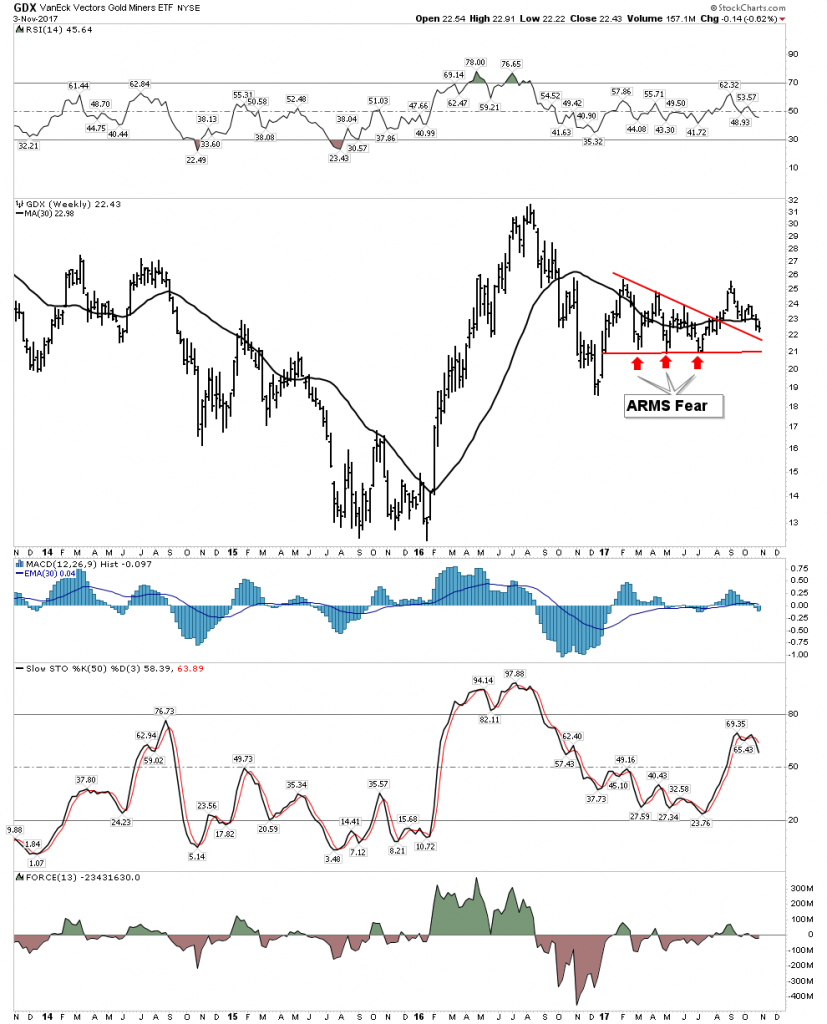
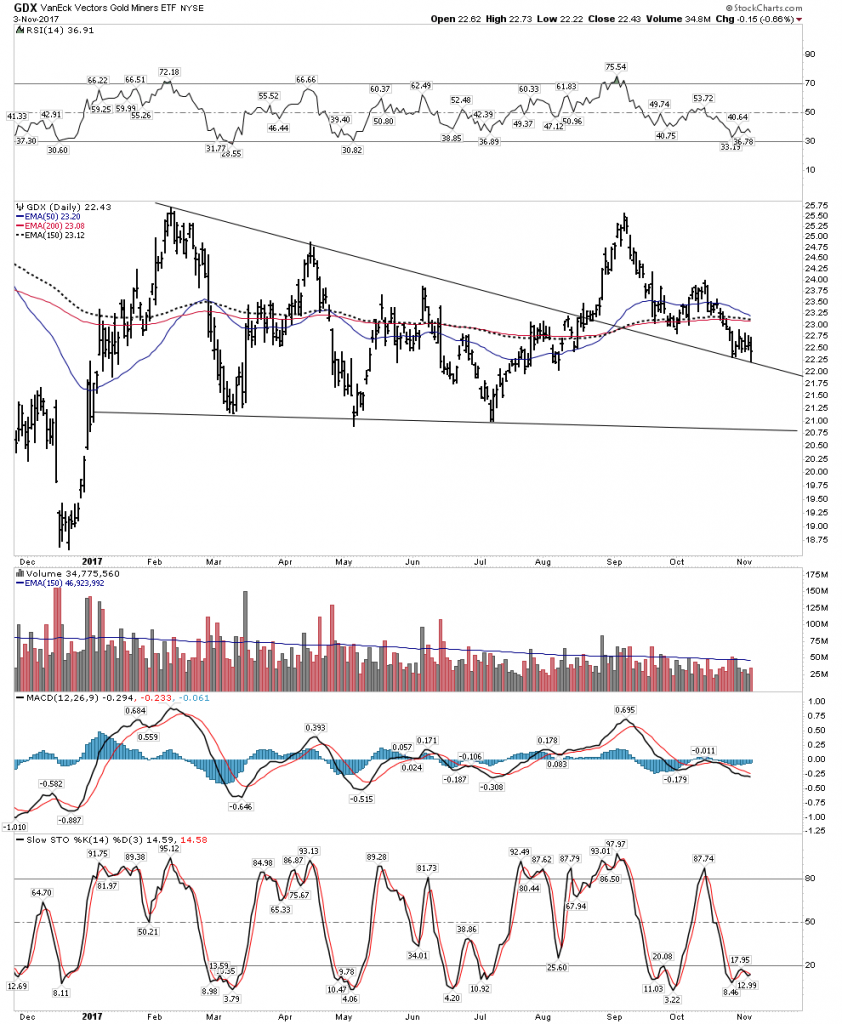
Weekly GDX
The GDX still shows some hope of salvaging its breakout, but not much room for error with price now below a declining 30 EMA and stochastics rolling over:
The Daily shows a last gasp attempt of holding on with volume collapsing:
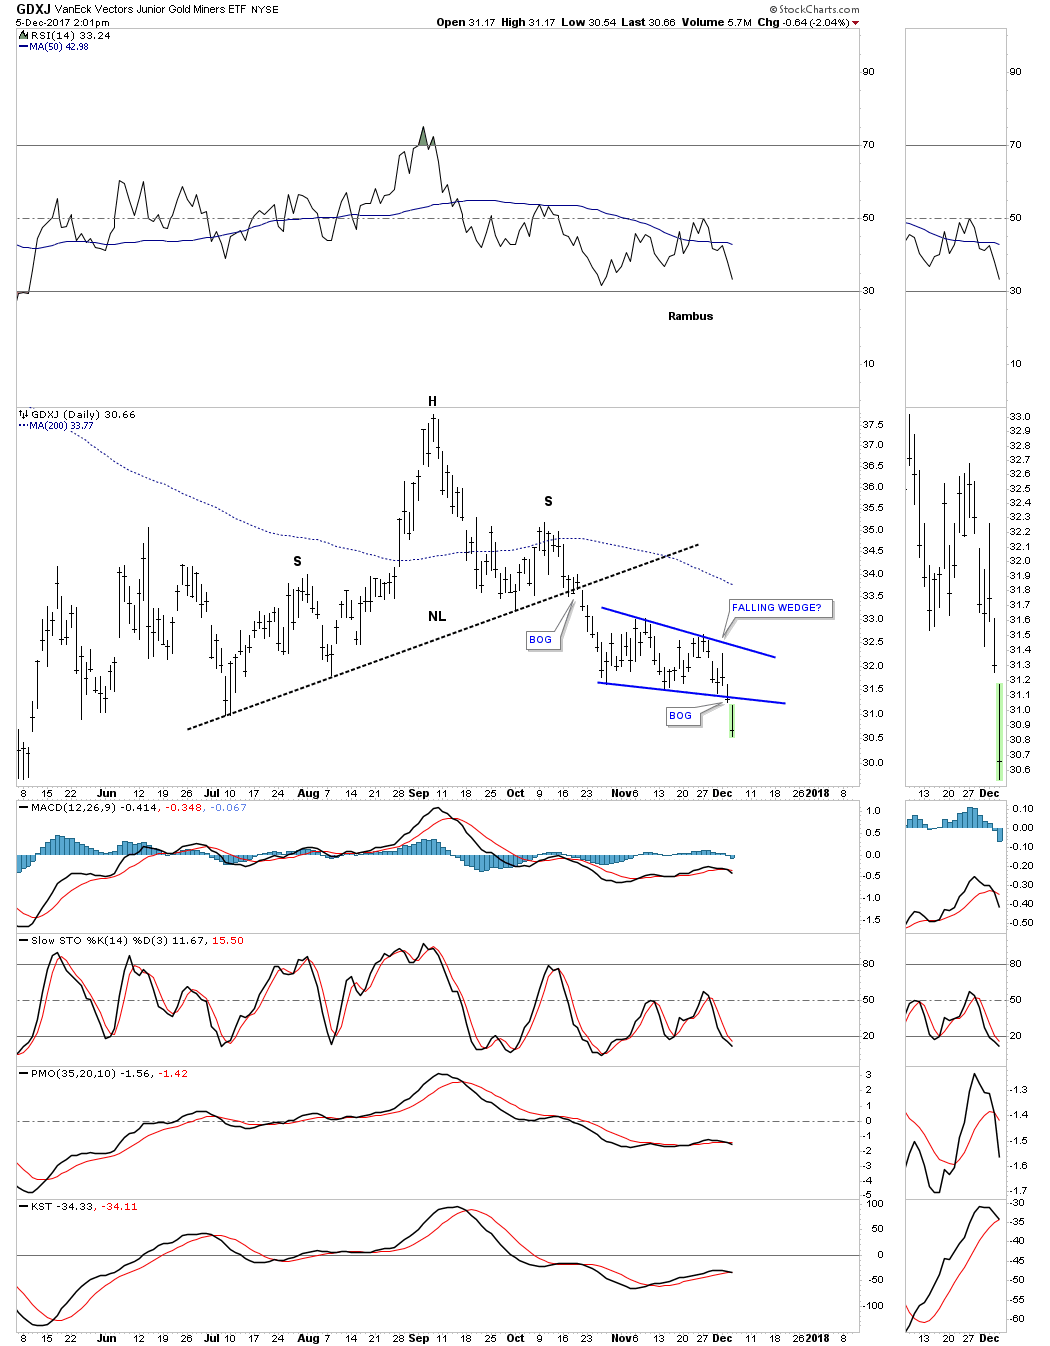
Bottom Line on the Gold Stocks: Looks like we go lower into tax loss selling. This particularly could be accentuated if the general market continues higher with investors selling those gold stocks and redeploying it into the stock market. I call this the shiny object factor, drawing attention away from the PM stocks.
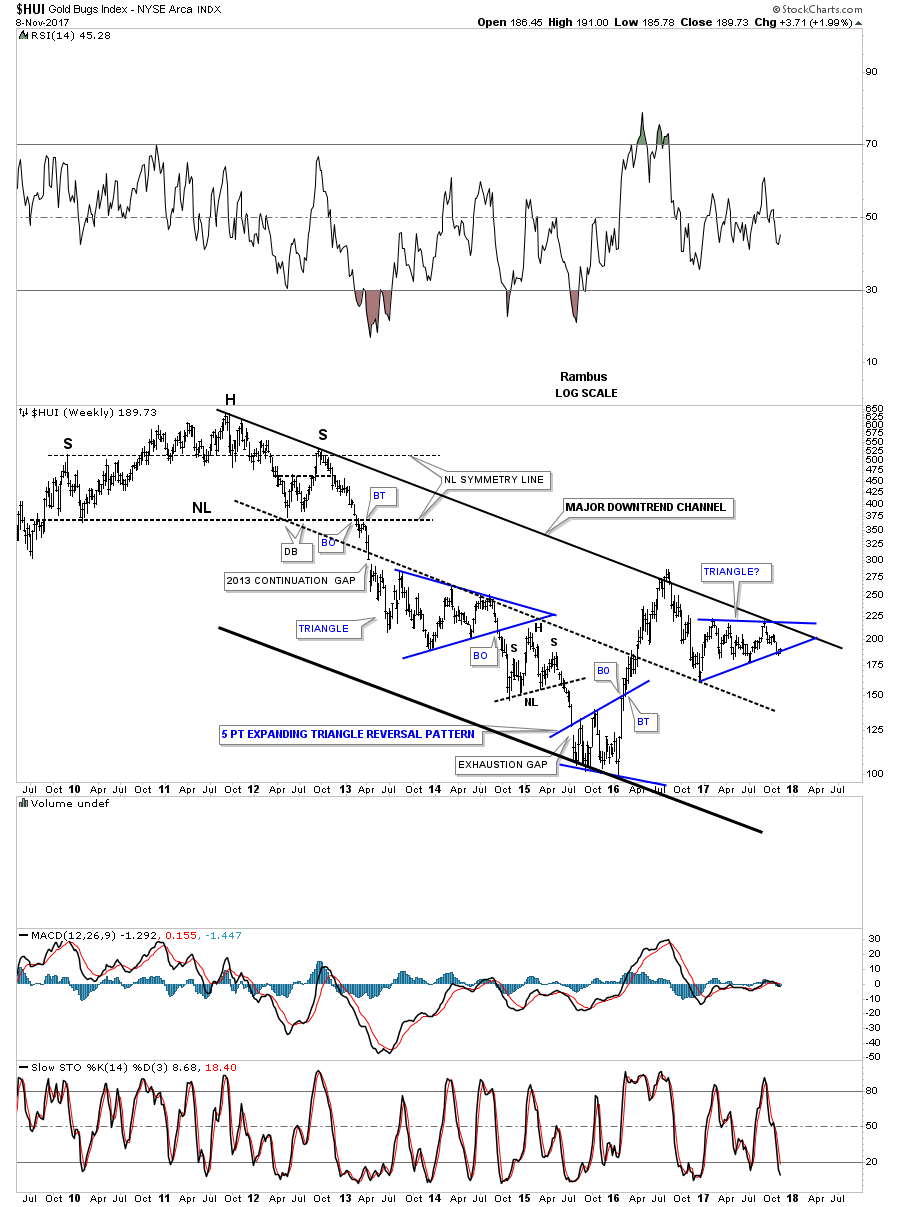
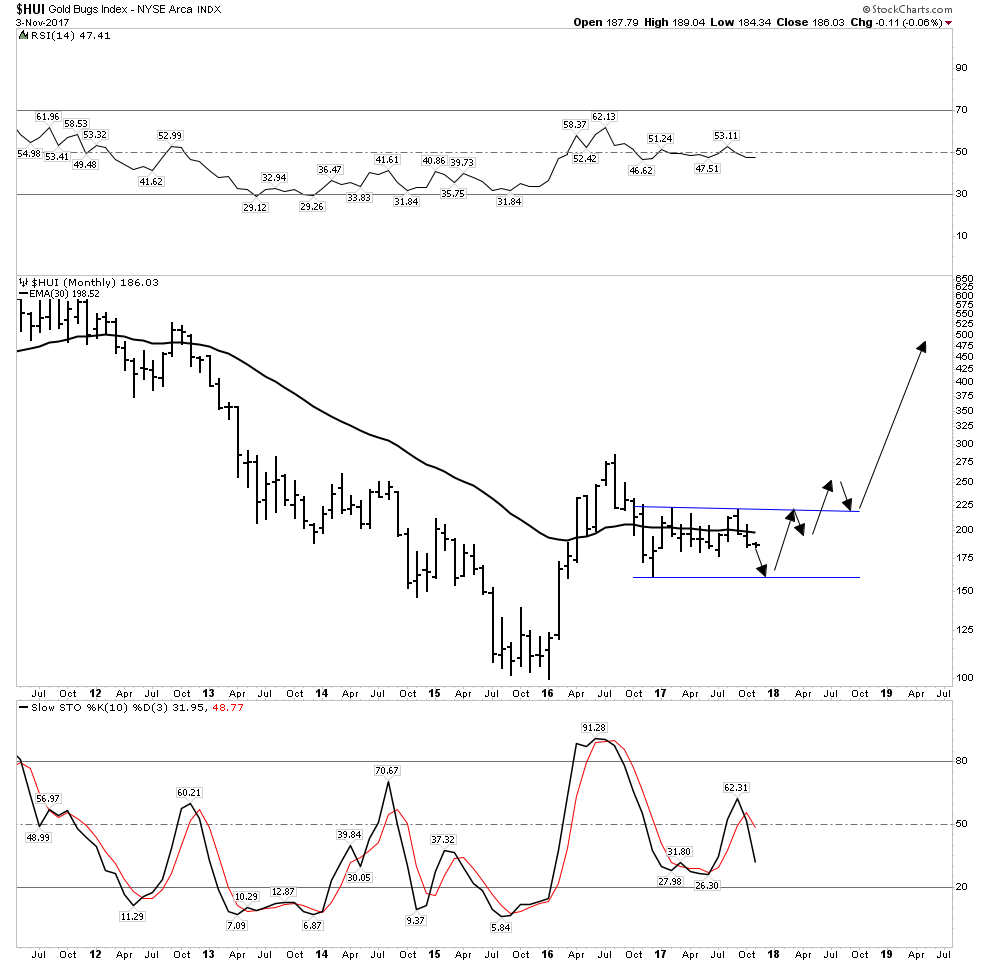
Here is what I see as a definite possibility as painful as it may be,
The good news however is that this could be the final phase of consolidating the first leg up in the new bull market in the gold stocks which started in January 2016. The next leg up could begin as soon as late December and 2018 could develop into a rip roaring year for the gold stocks with the HUI reaching a target range of 450-520.
Rays of Hope
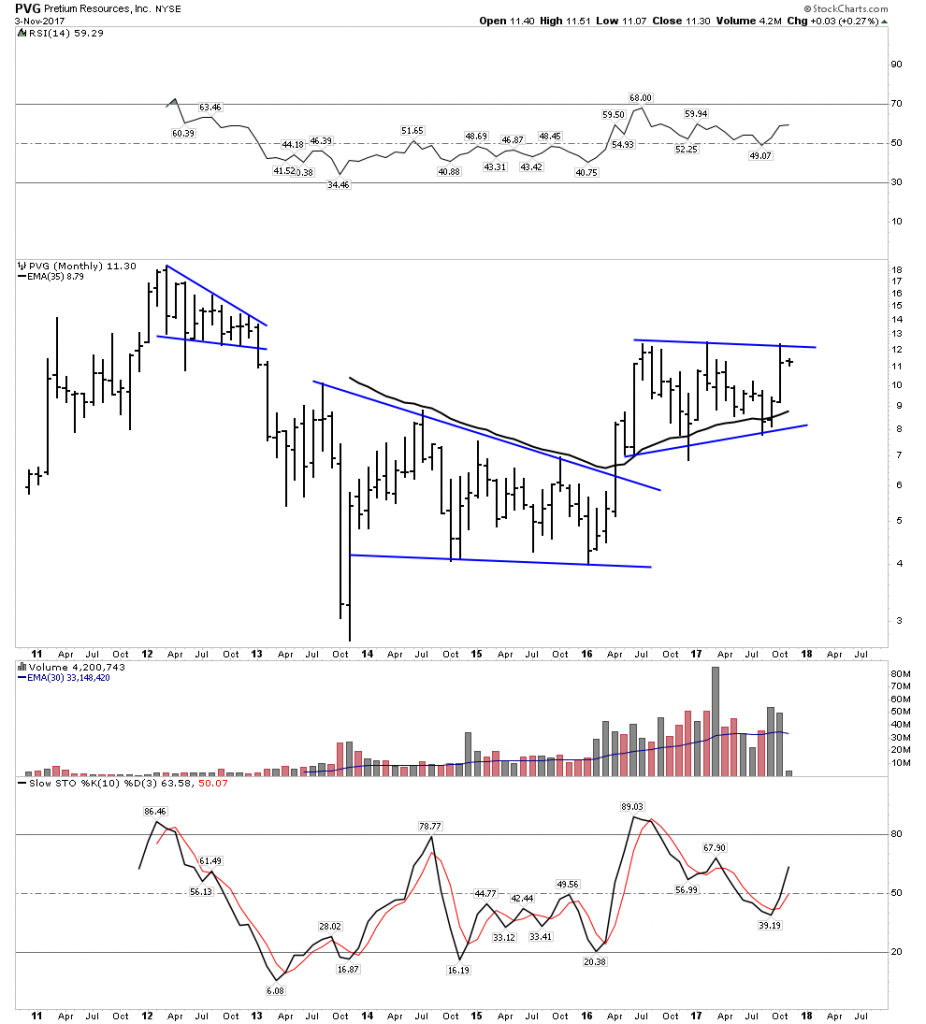
So the PM indexes appear short term bearish, however I do have some rays of hope, to include some stocks which I hold despite the indexes being rather dreary. Principally I own a healthy position in Pretium. If next quarter’s production results validate last quarters strong numbers this stock could likely get taken out. Agnico Eagle may be waiting in the wings. This week we saw what happened to Alterra power. It spiked up 63% in its take out, with little warning- a classic “got to be in it to win it” story.
Monthly:
Weekly:
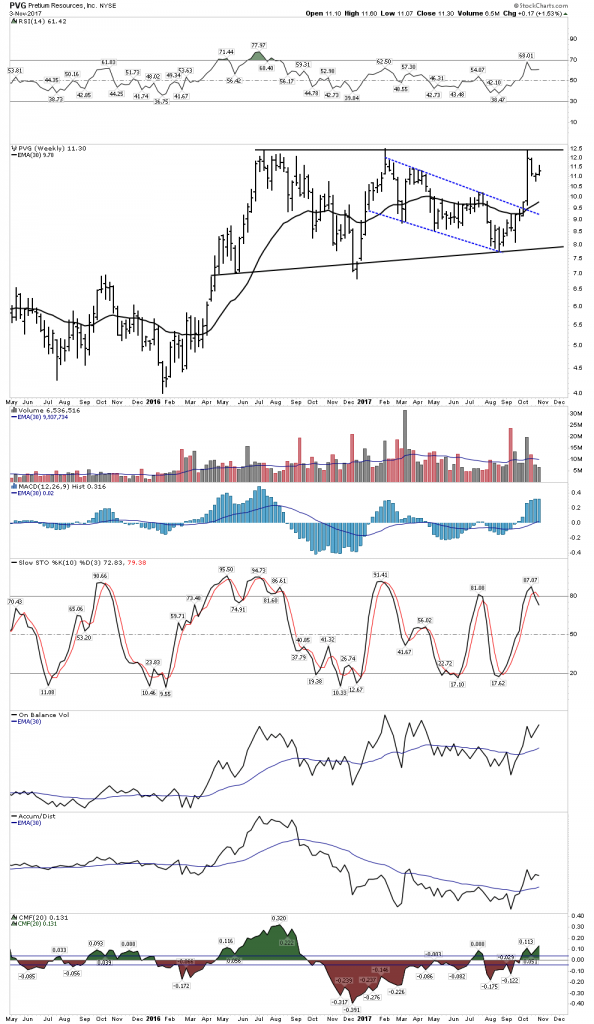
Daily:
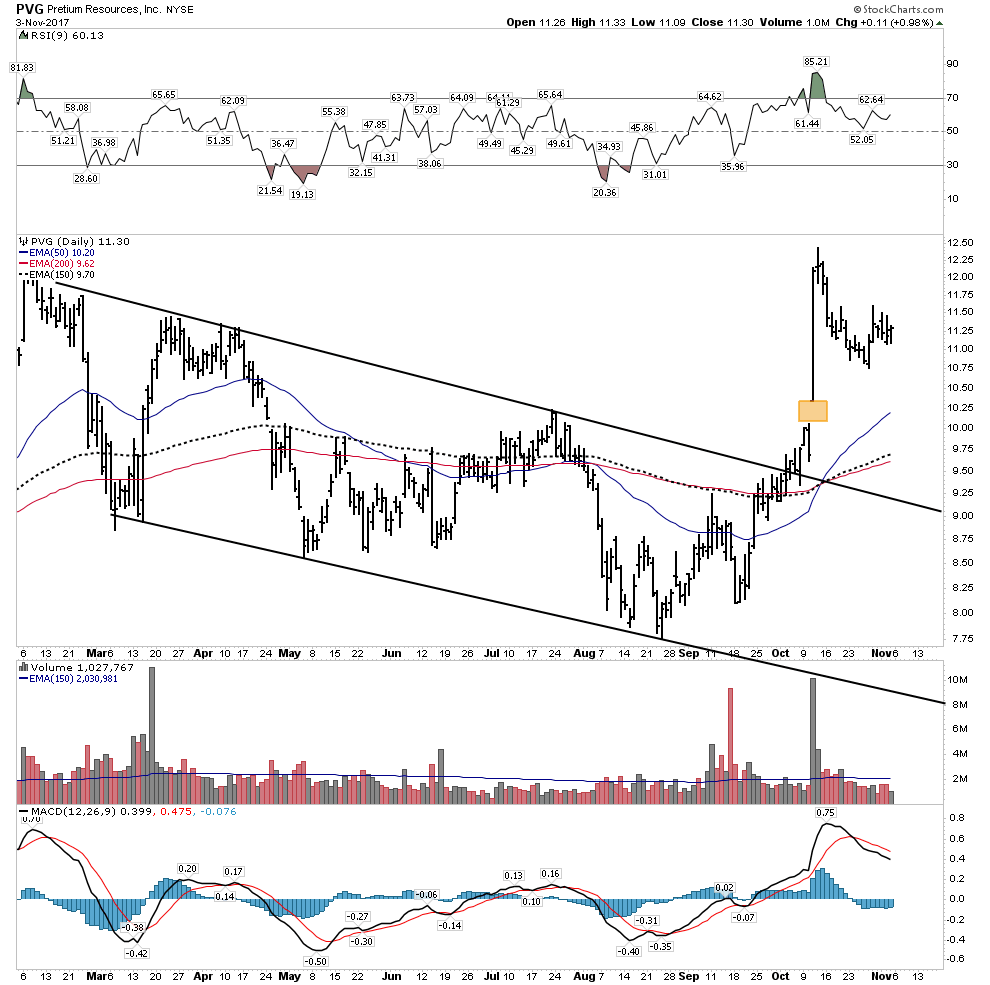
That’s a breakaway gap, it doesn’t have to necessarily get filled.
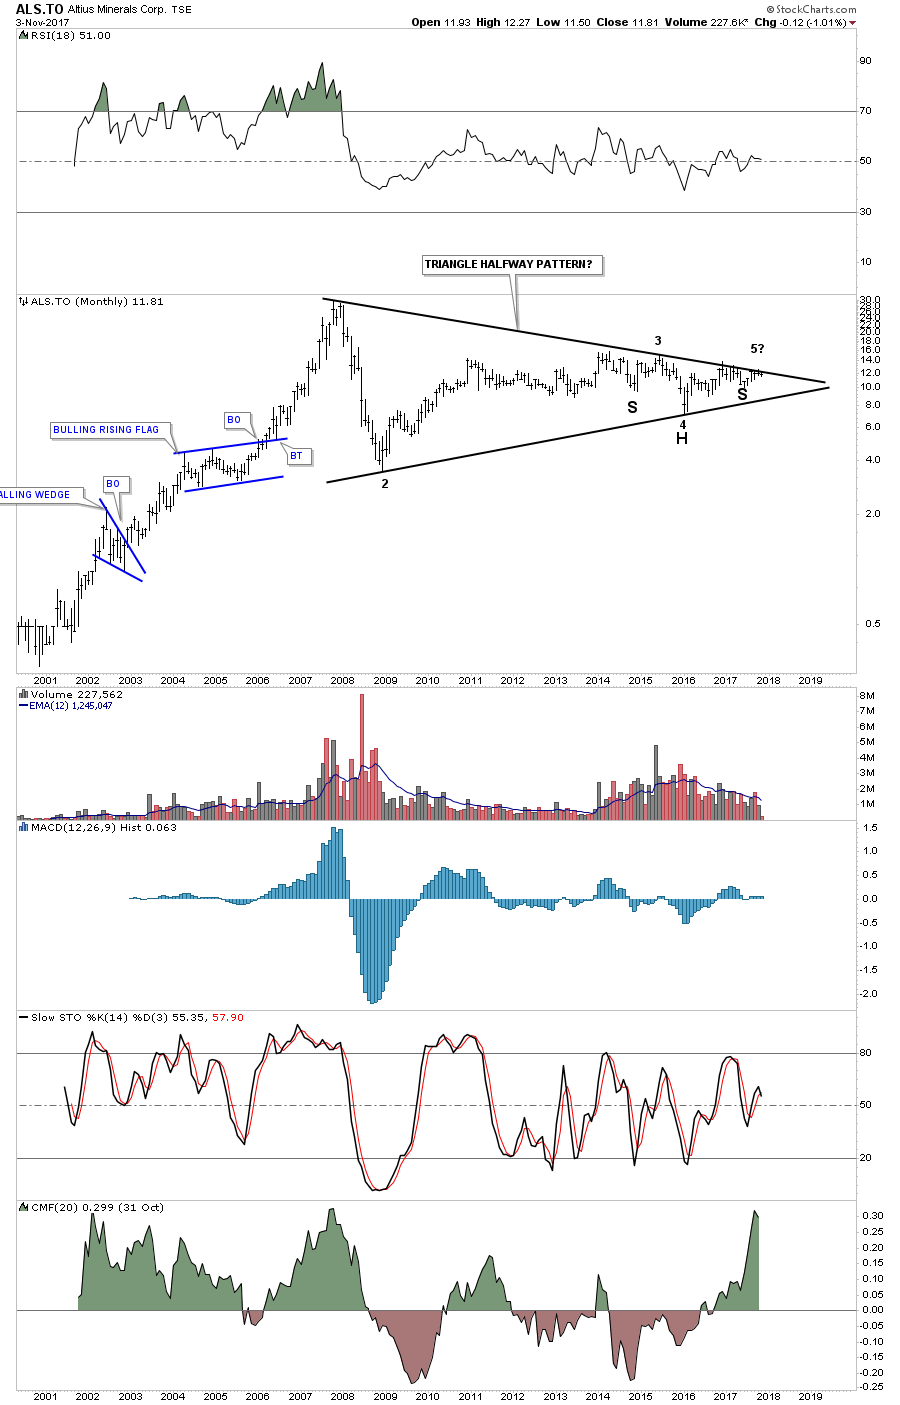
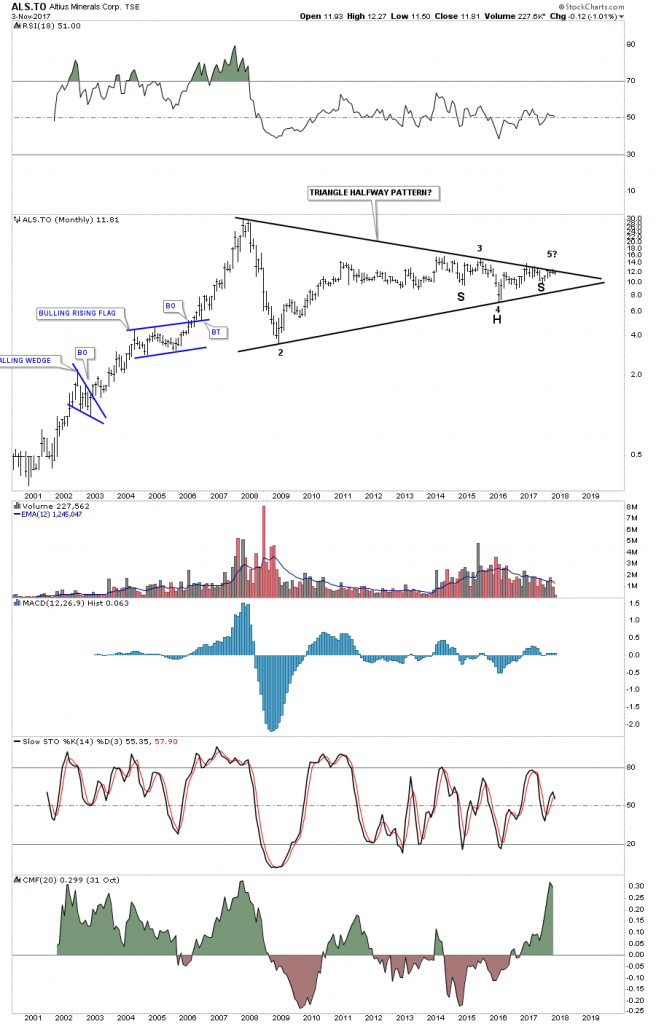
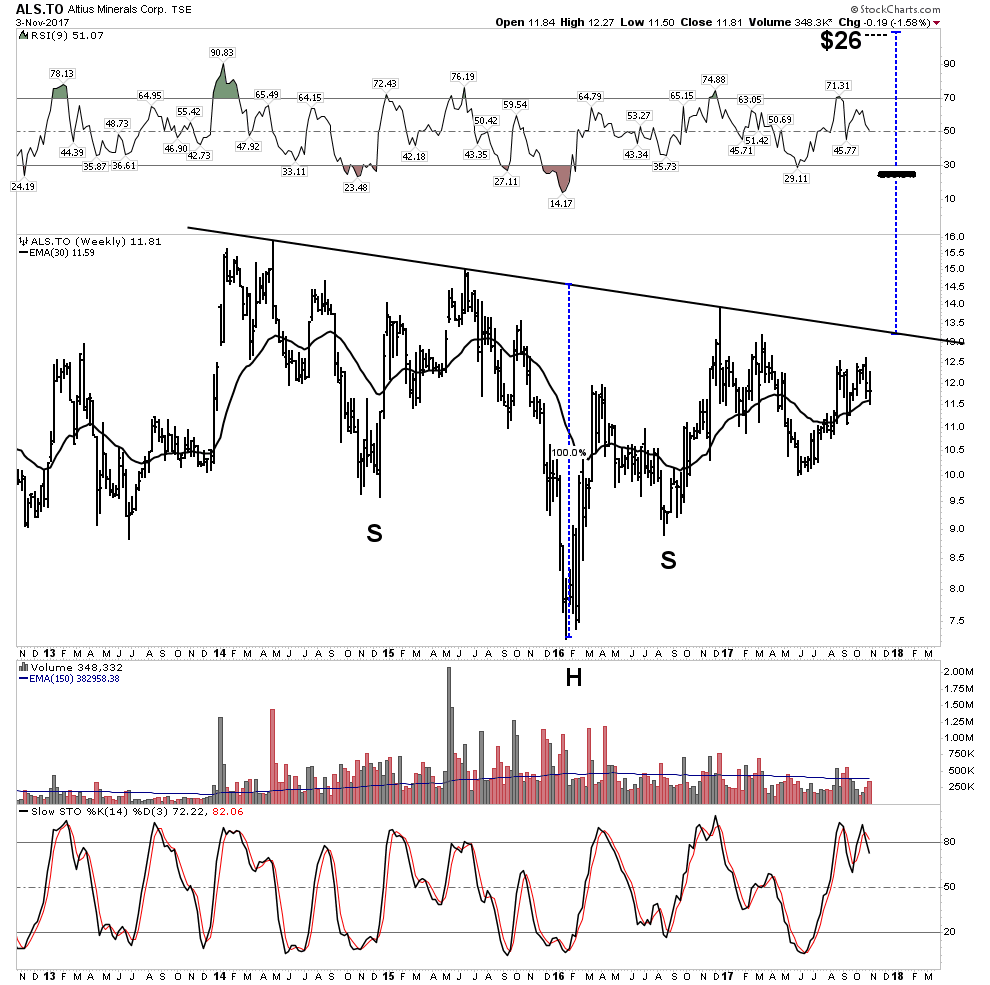
Altius Minerals– Not a gold stock, but it is building cause for a powerful break out.
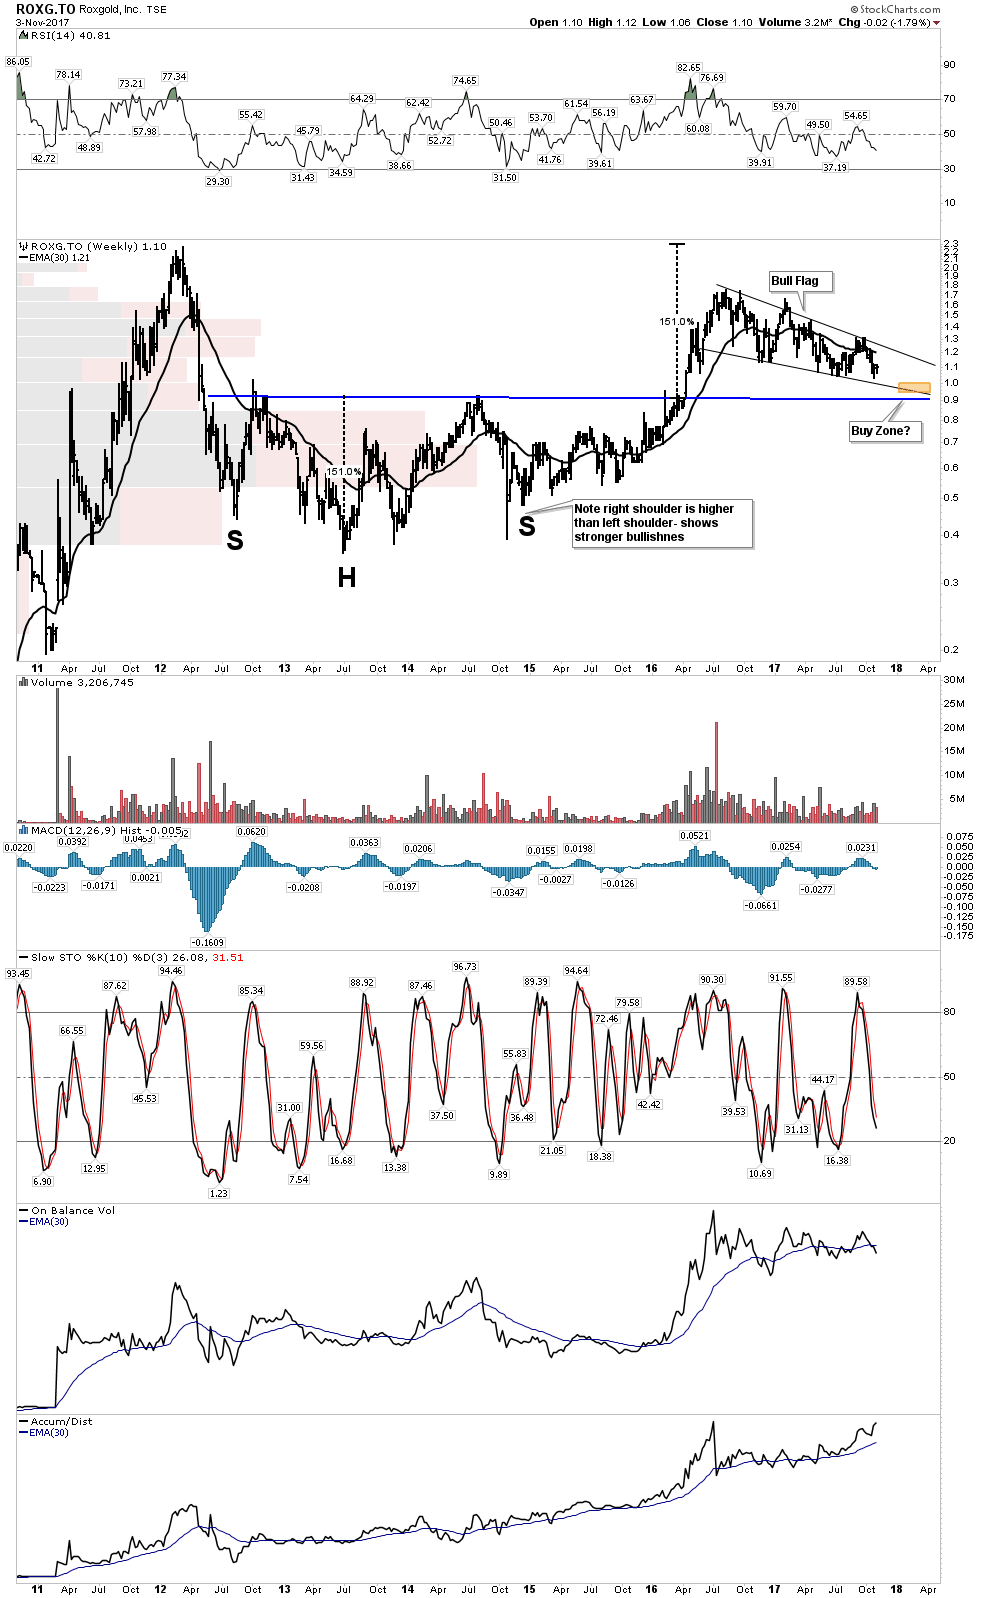
Roxgold– updating the set-up:
I don’t own this, however this is typical of stocks that one should keep an eye on as its nearing an end to its consolidation of a massive move:

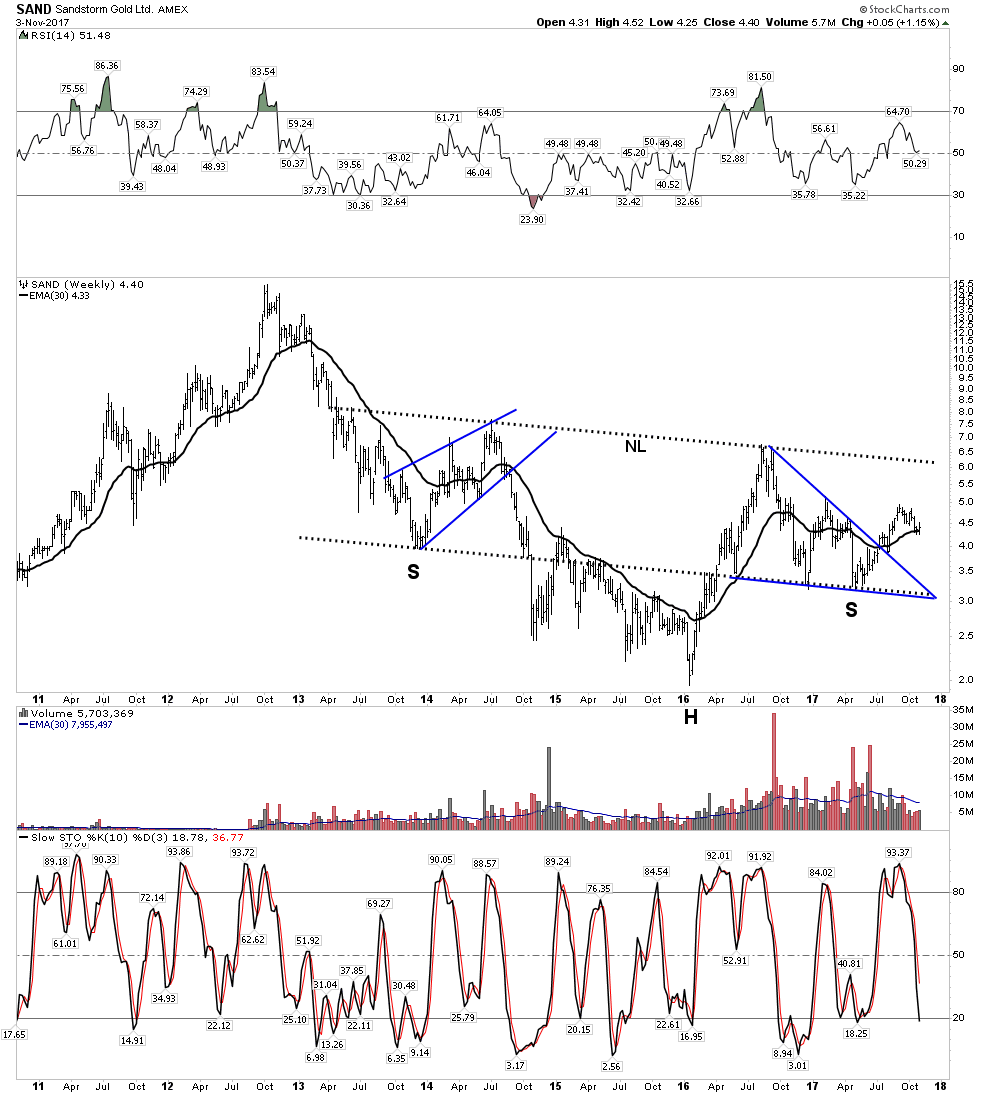
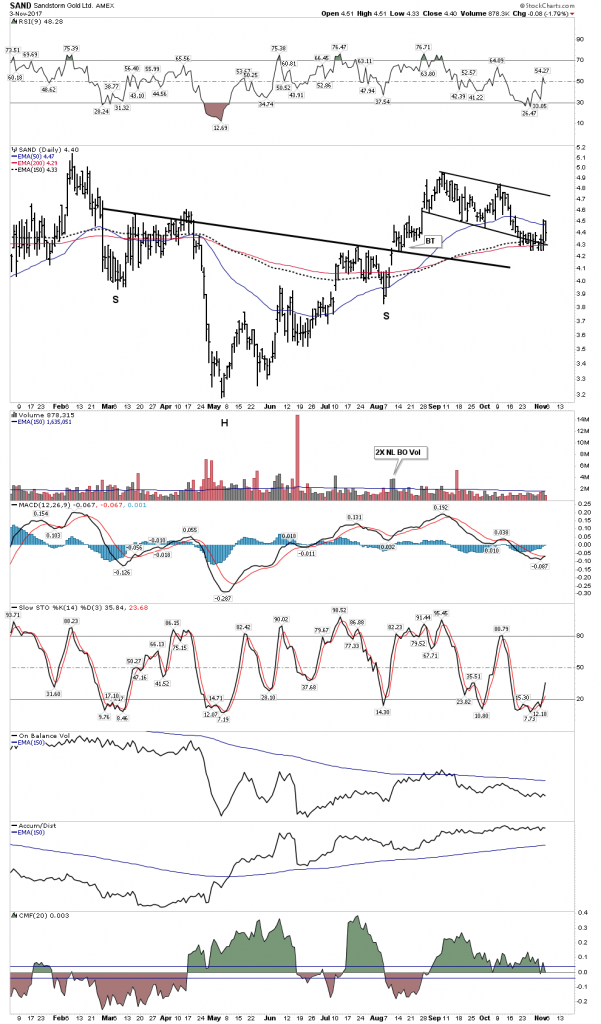
Sandstorm:
Jury is still out on whether this stock needs to consolidate lower. I own 80% of my allocated holding of this stock which is my 3rd largest position.

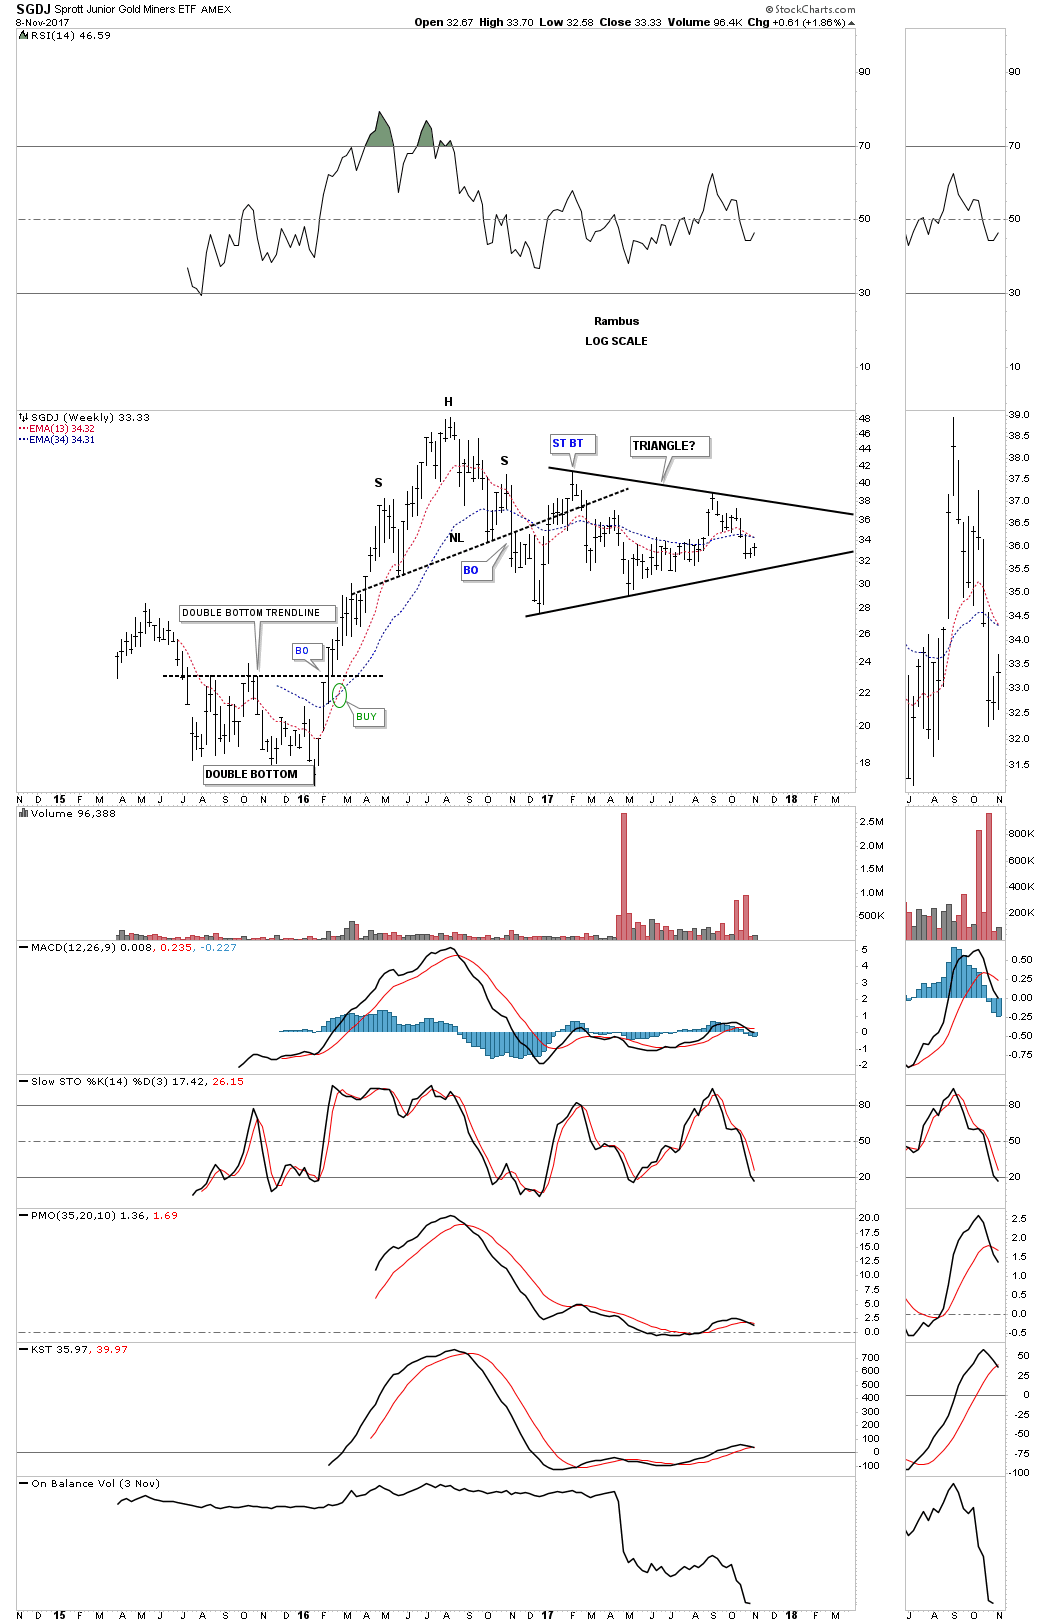
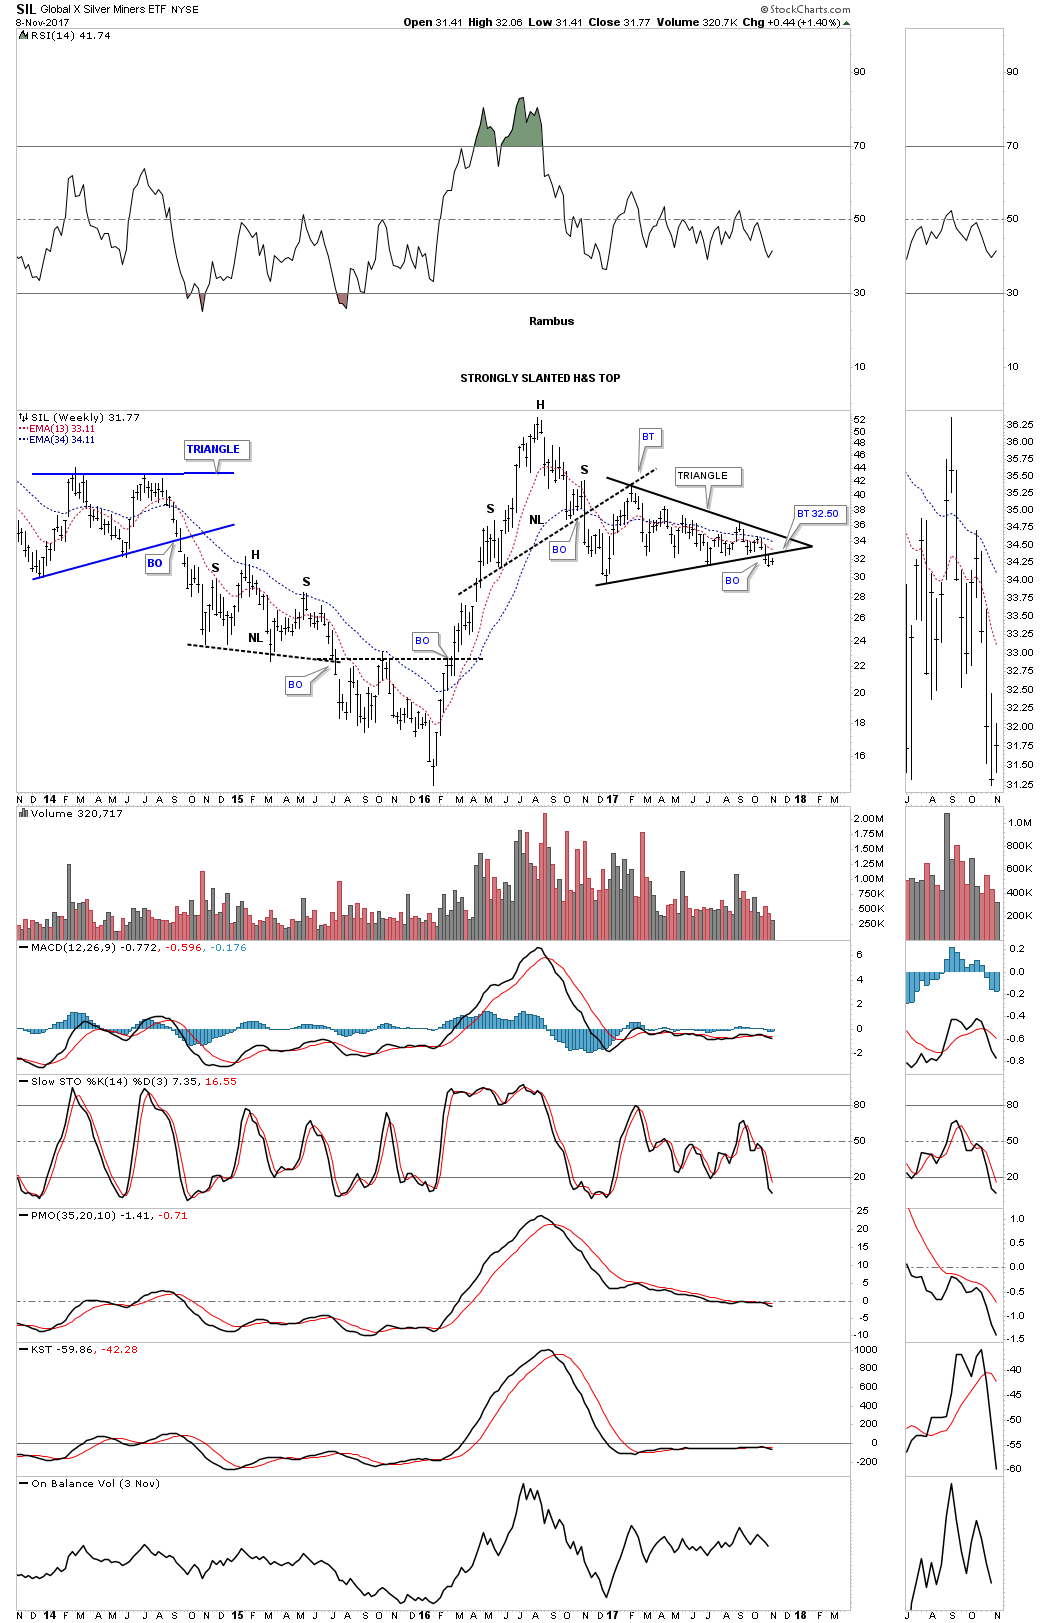
Silver Stocks
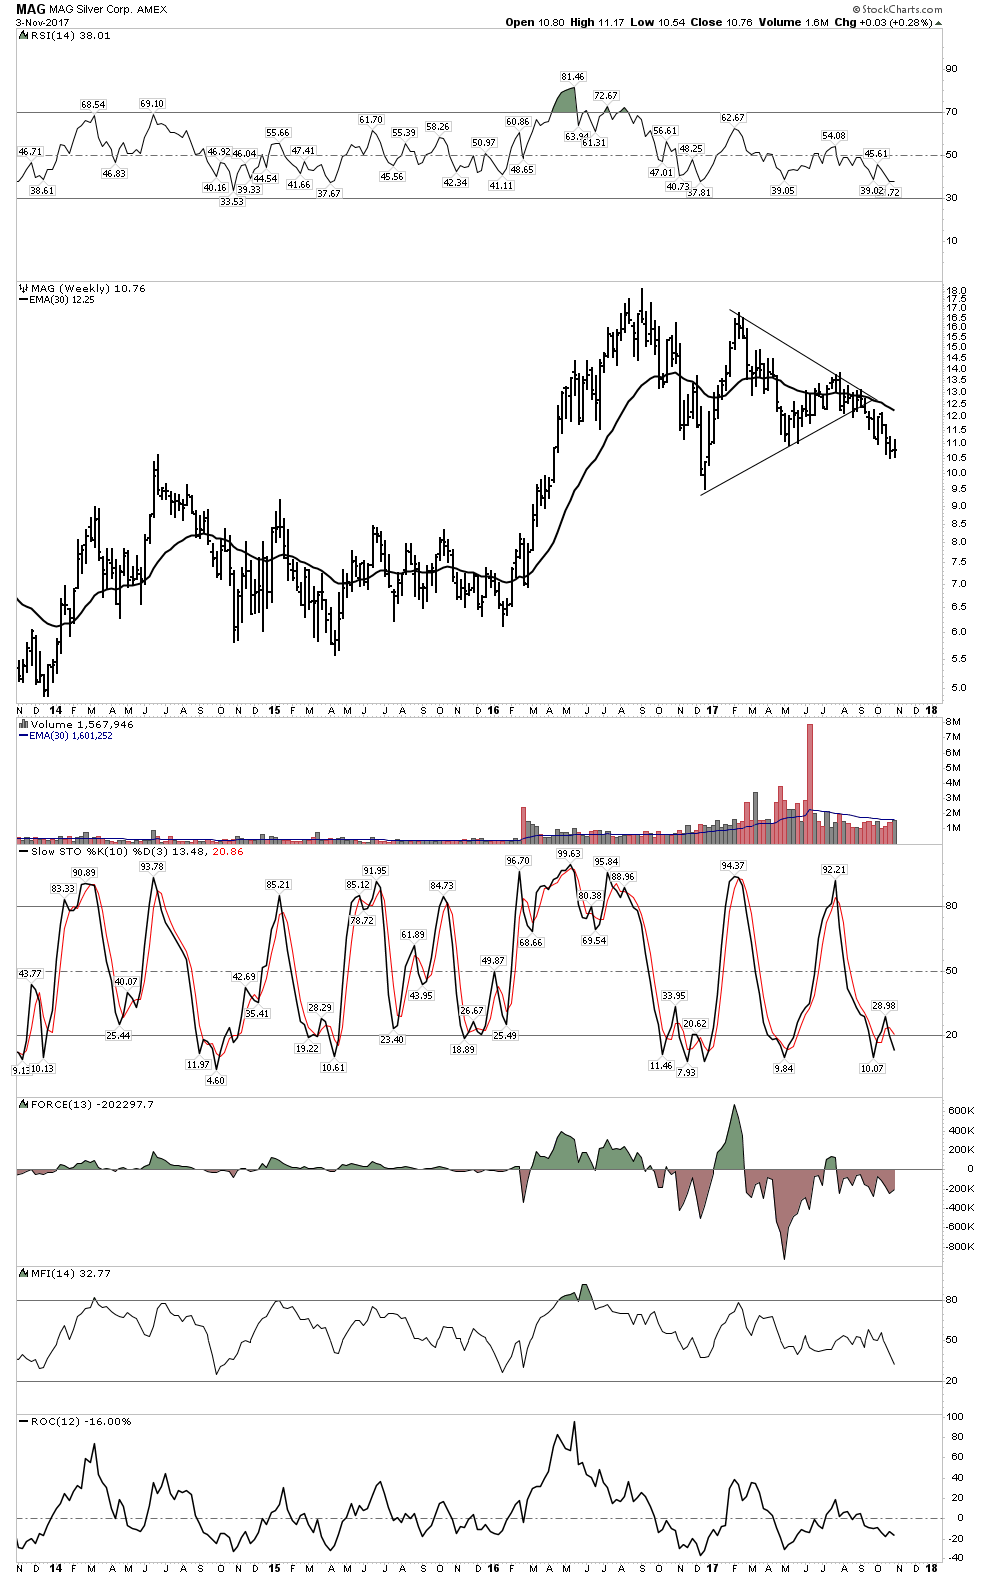
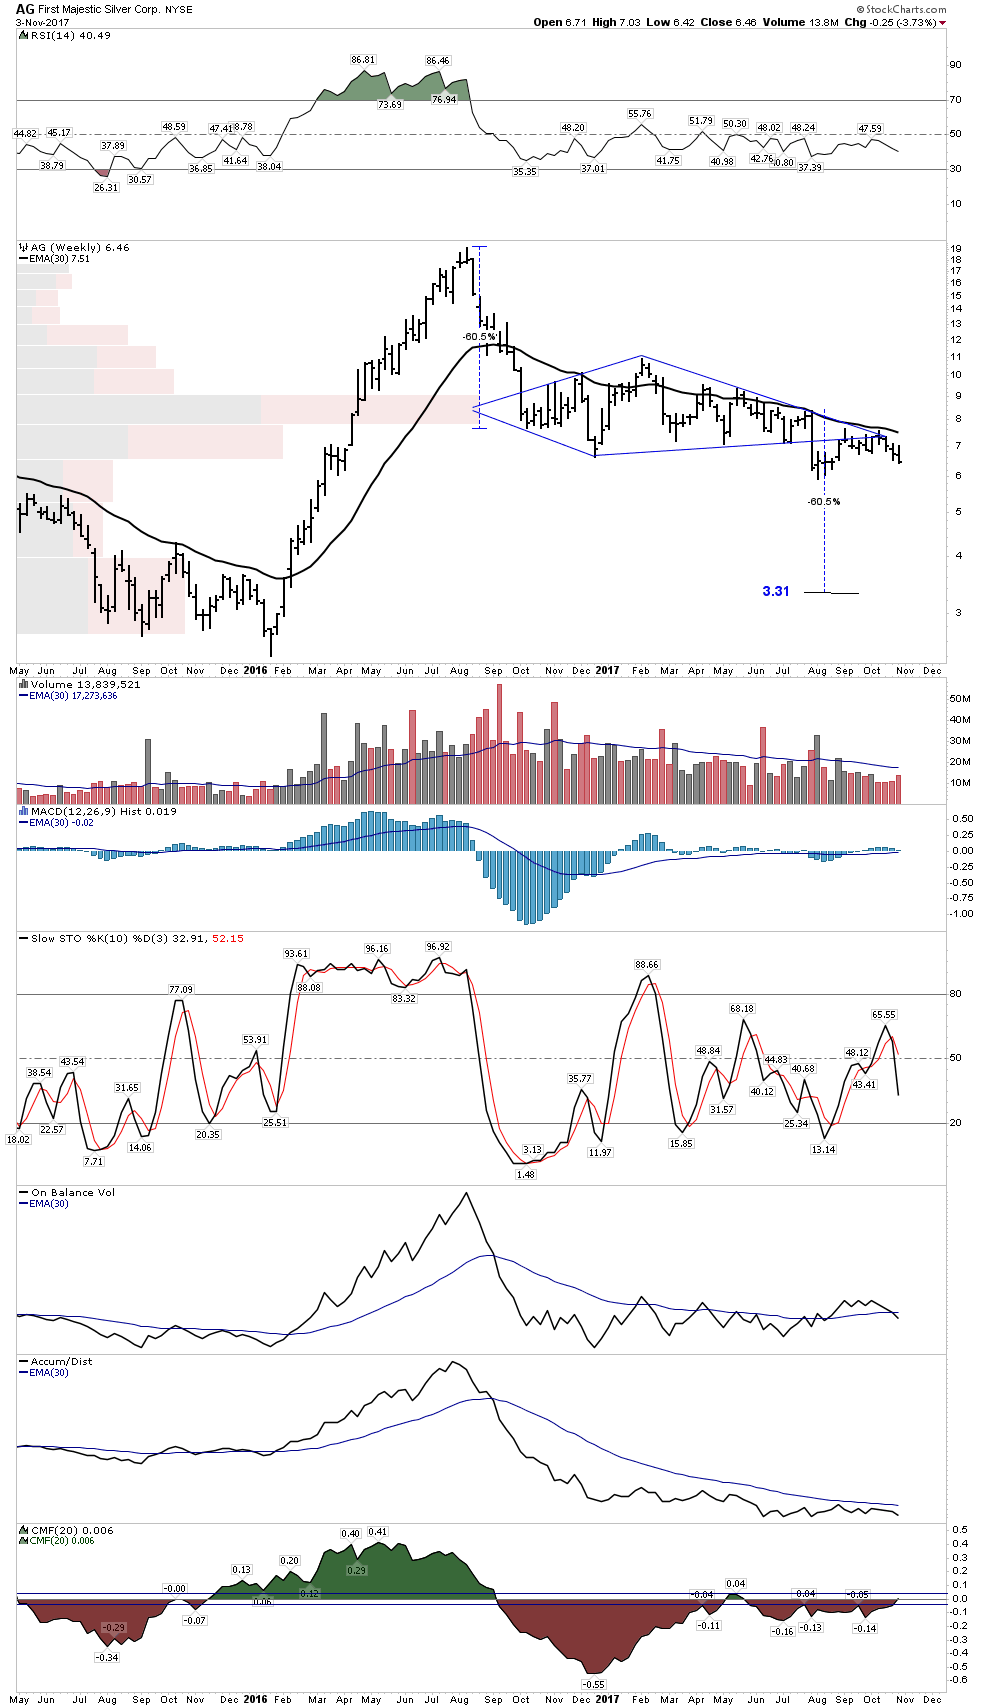
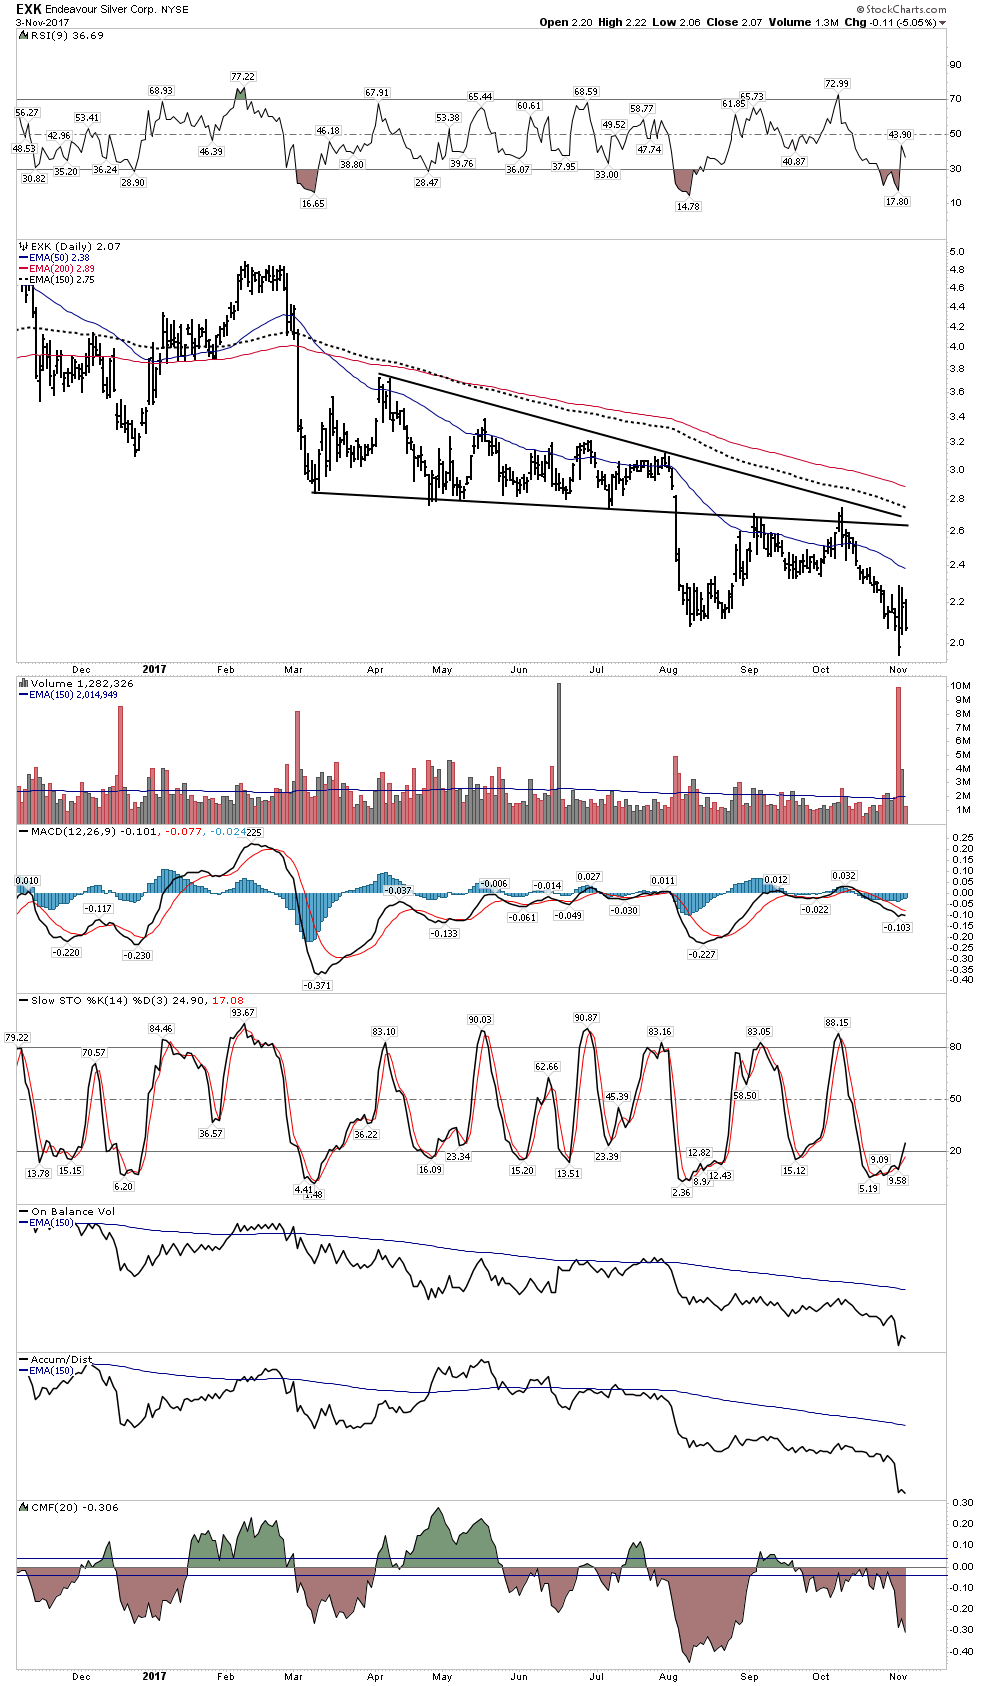
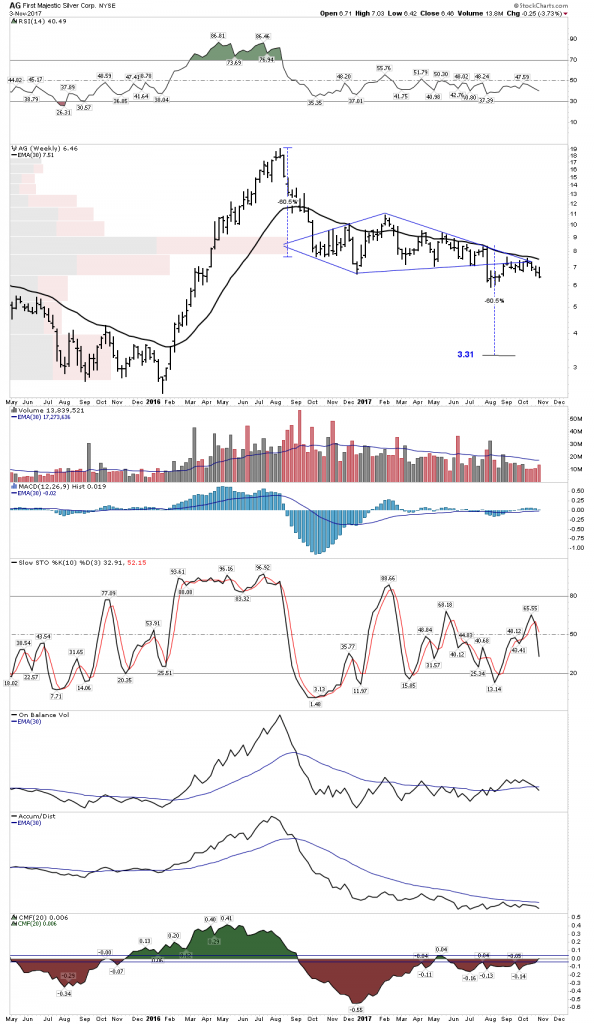
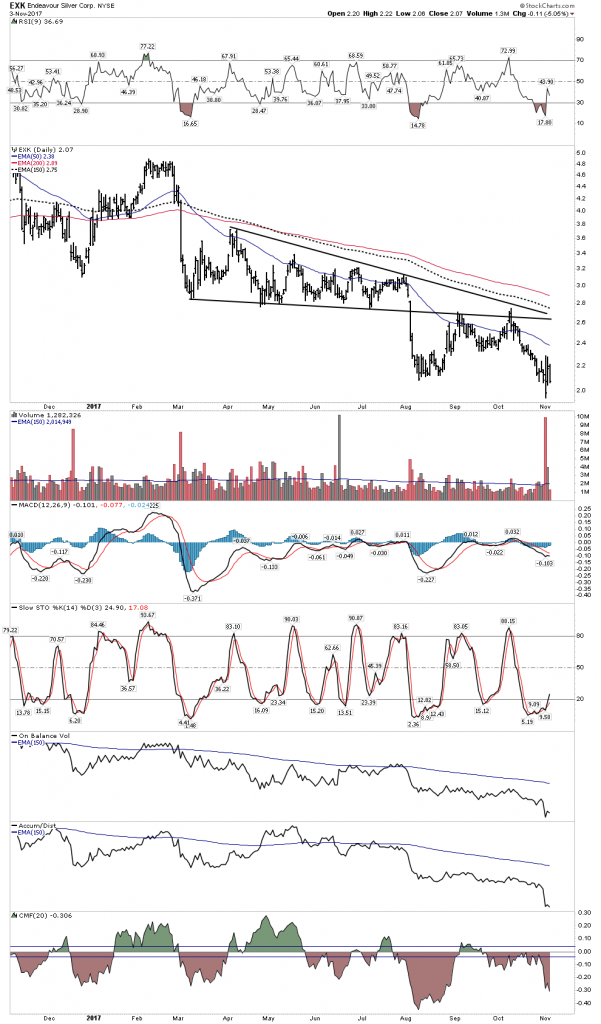
Here are a few representative silver stocks. We see the story looks somewhat bleak. They don’t look as promising as the gold stocks. The message here is they could drop significantly lower over the next 2 months
MAG

First Majestic
Endeavour
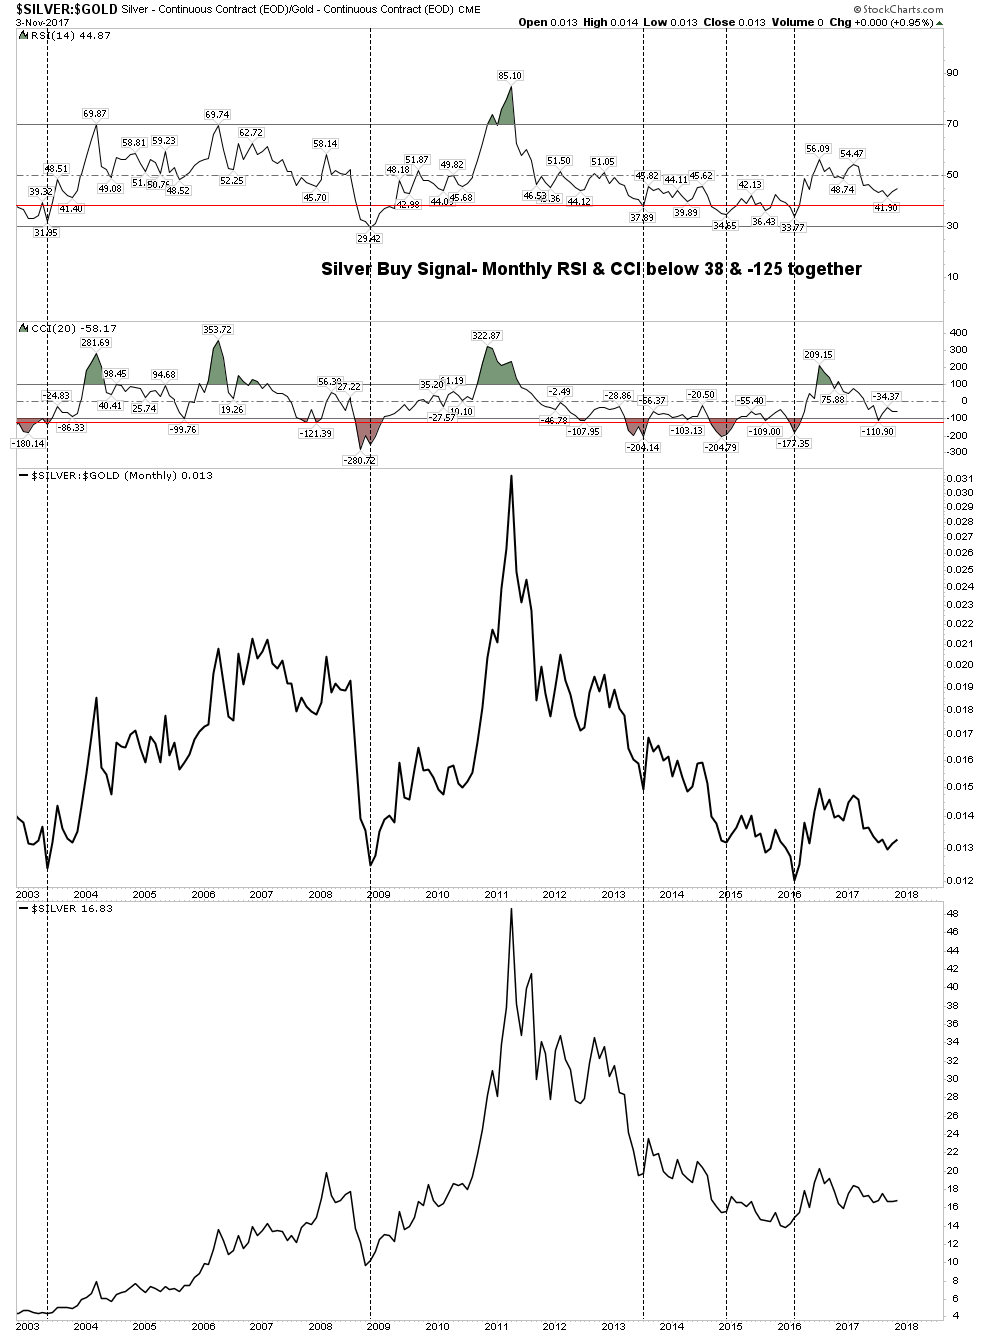
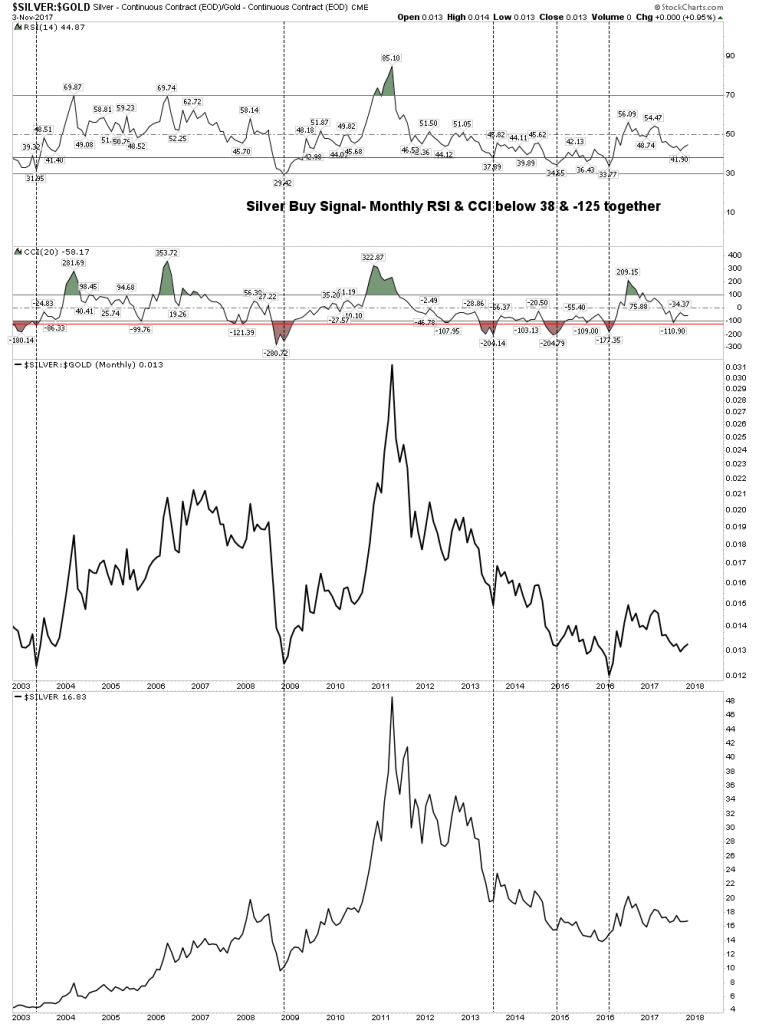
Silver Stock Buy Indicator
Recall our silver stock buy indicator. It works for gold stocks also. It continues to say patience, your time will come.
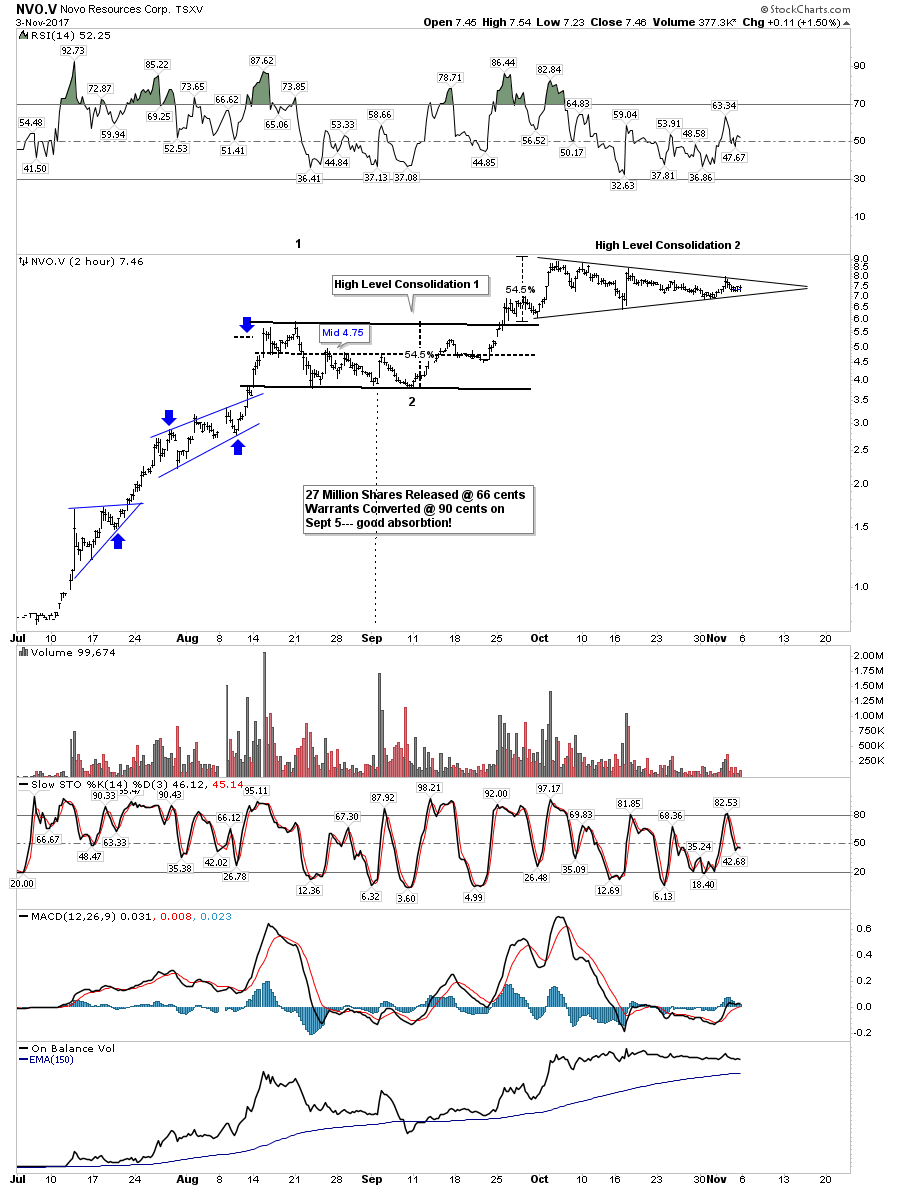
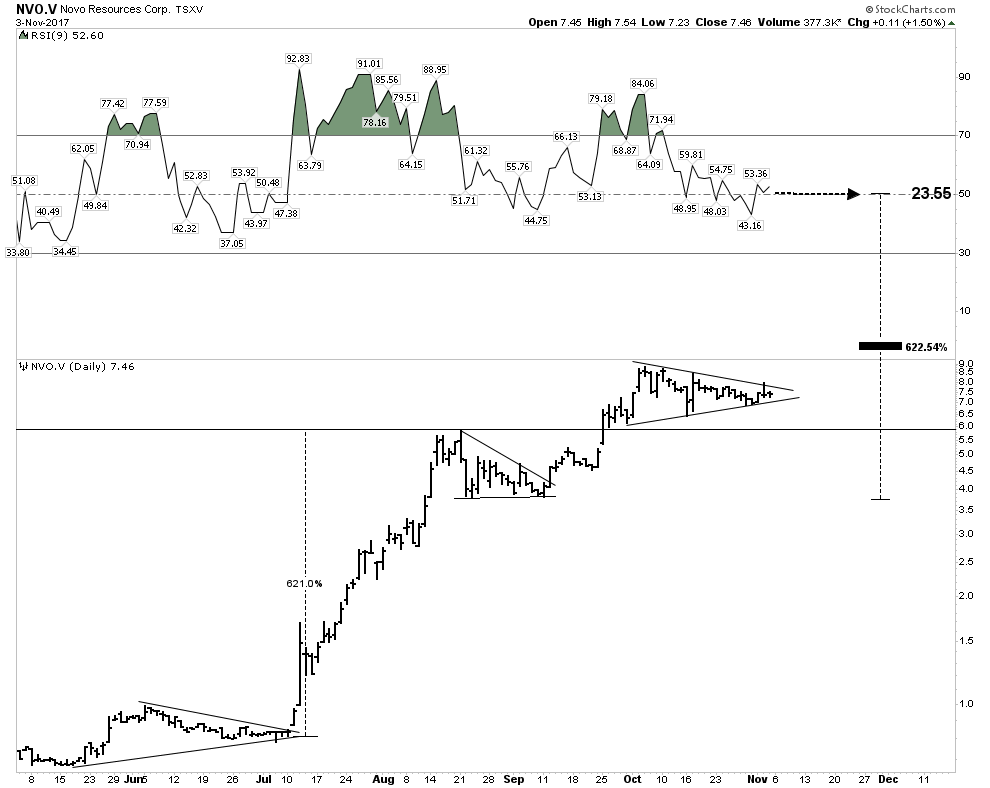
NOVO- The Great Gold Hope
Despite the gold group looking heavy Novo is doing just fine. It appears to be undergoing its second high level consolidation. This week it had a significant development in that they confirmed a fine gold component in trenching at Purdy’s Reward. This management team seems to be well skilled in managing the news flow.
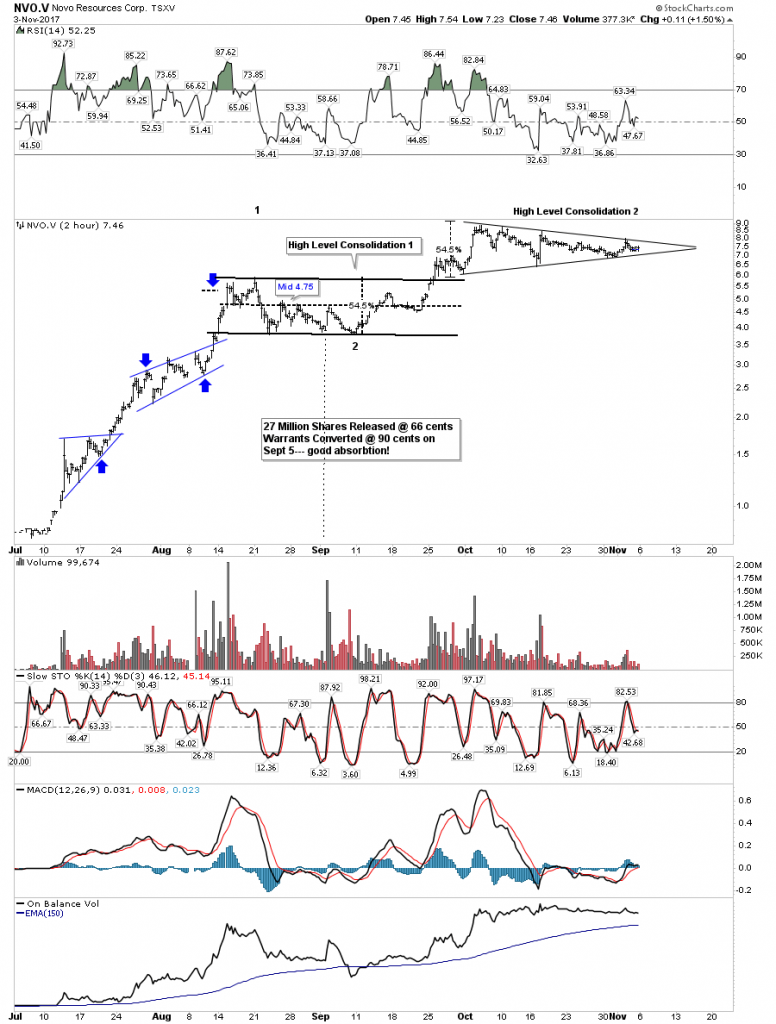
Blue Sky:
Electric Metals Hot- Gold Cold
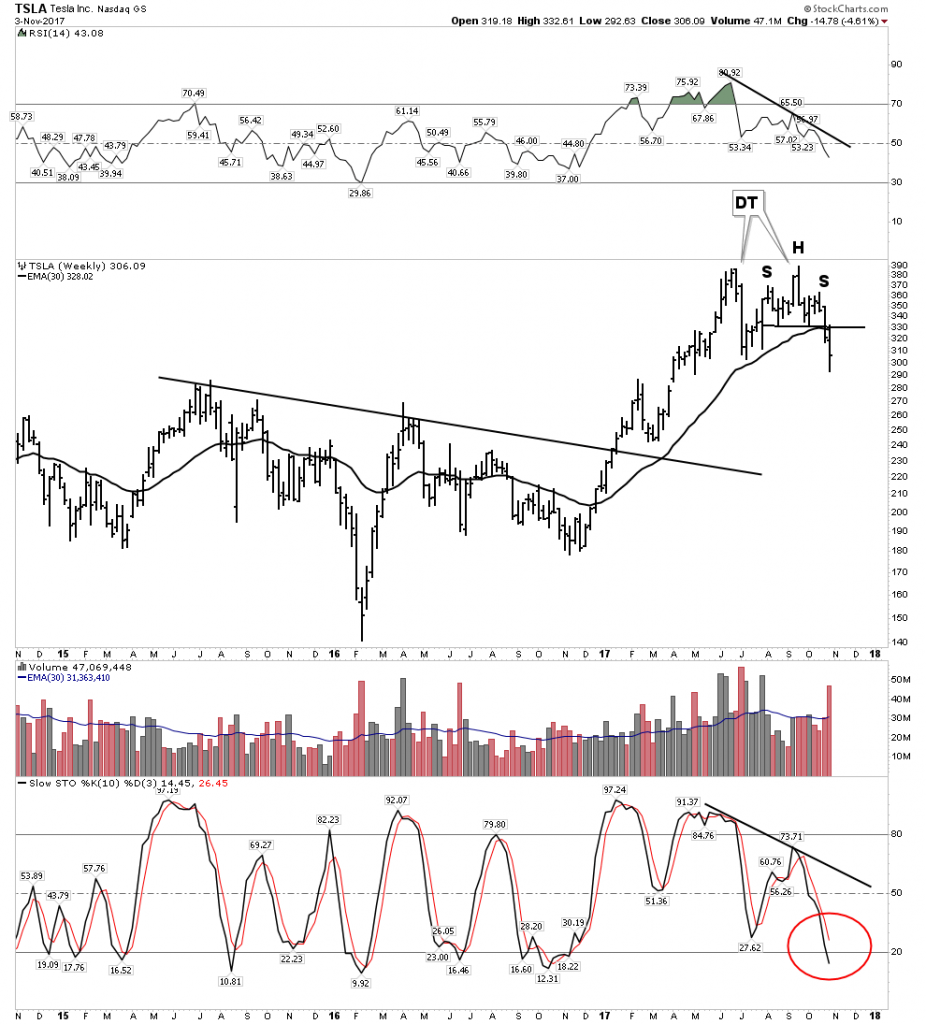
While gold has has been down and out the electric metals have been all the rage, especially the cobalt plays. Seems every month a new battery factory is announced and a new EV manufacturer announces its plans to enter the market. With additional automotive capacity entering the market the collateral damage this week was the darling of the sector- Tesla.
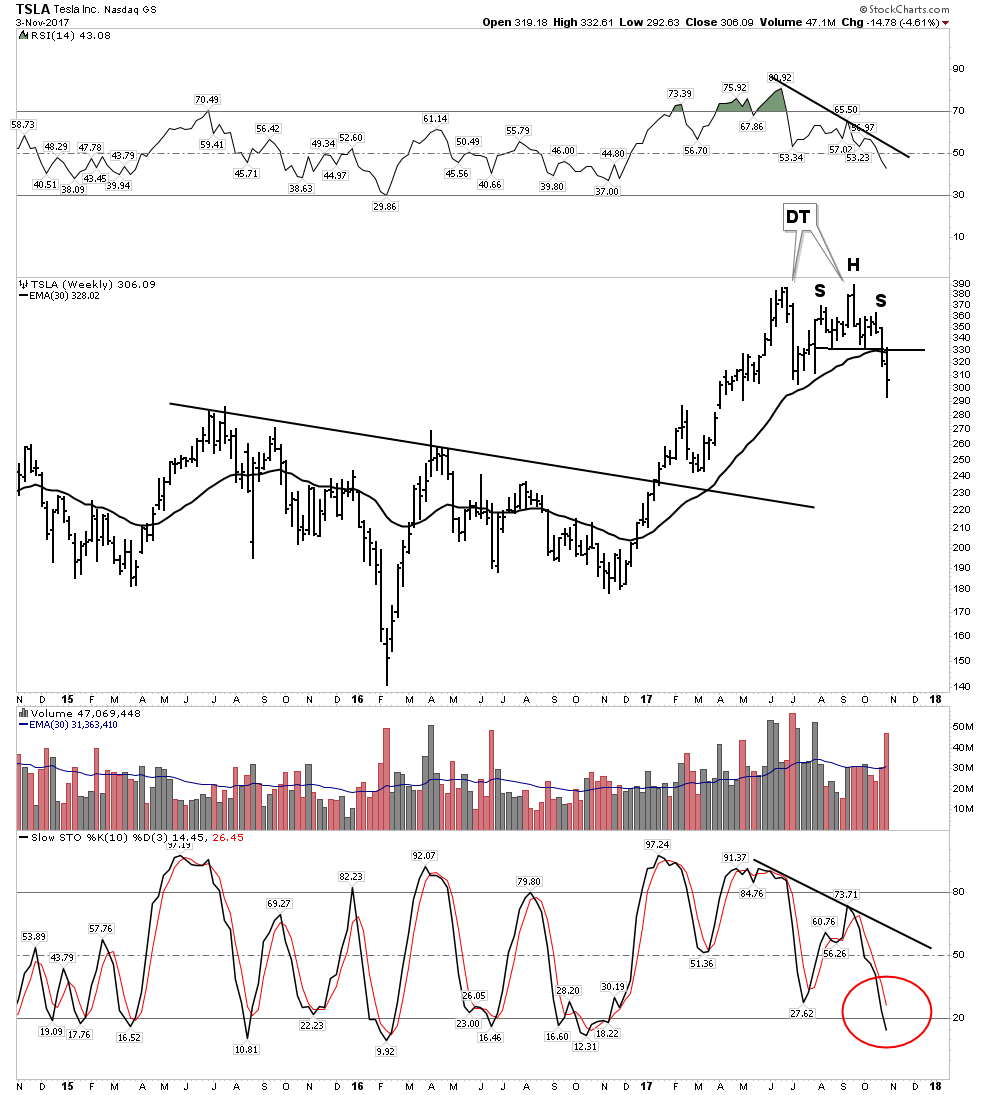
Tesla– is it finally time for the shorts to be taken off the intensive care list?
Things changed this week for Tesla, as reality came calling when the tax debate in Washington put Tesla’s tax credits in the cross hairs. With the $7,500 tax credit/ vehicle under threat the economics of the EV are not quite as good. If shorting is best done as a shoot em in the back strategy maybe it’s time to start taking aim…just sayin.
Weekly:
30 W EMA now rolling over with broken momentum indicators
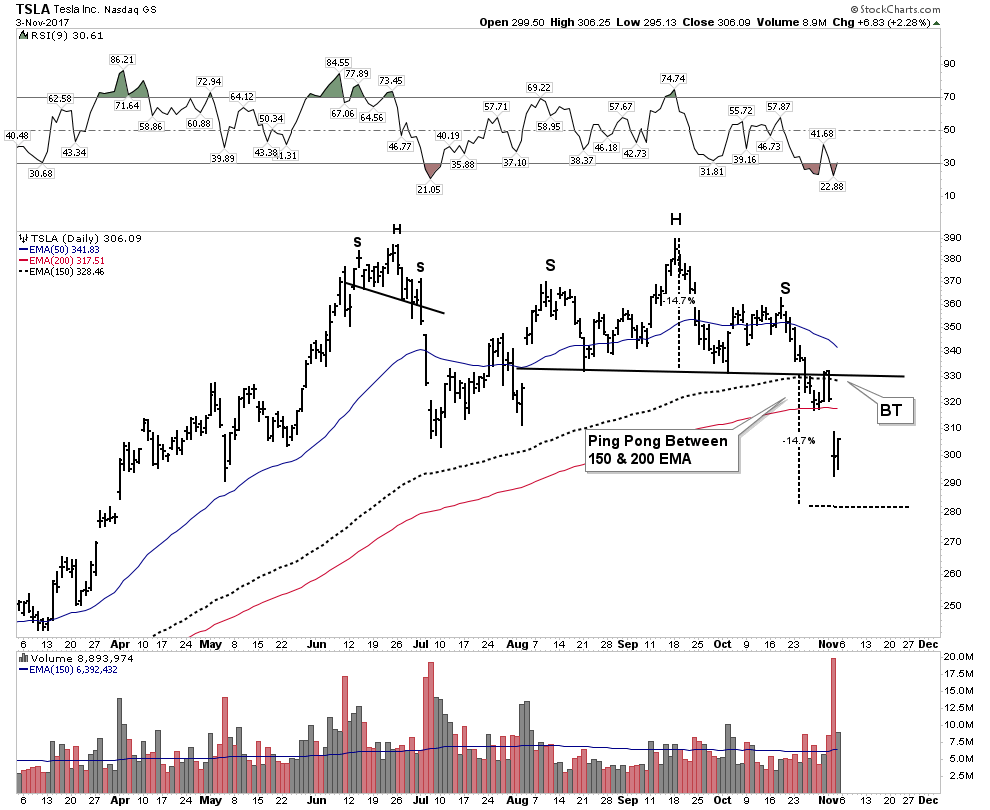
Daily- This may be the ugliest chart of the day, as it sports not one but two violated H&S patterns. The gap jumping the 200 EMA delivers the message -it’s done.
Electric Metals still hot.
But Tesla is just one of many EV producers, and the demand for the metals will be insatiable. The lithium stocks have been on fire for some time and recently the cobalts have been catching up. My personal cobalt play is Ardea Resources in Australia:
The next would be Robert Freidlands Clean TEQ:
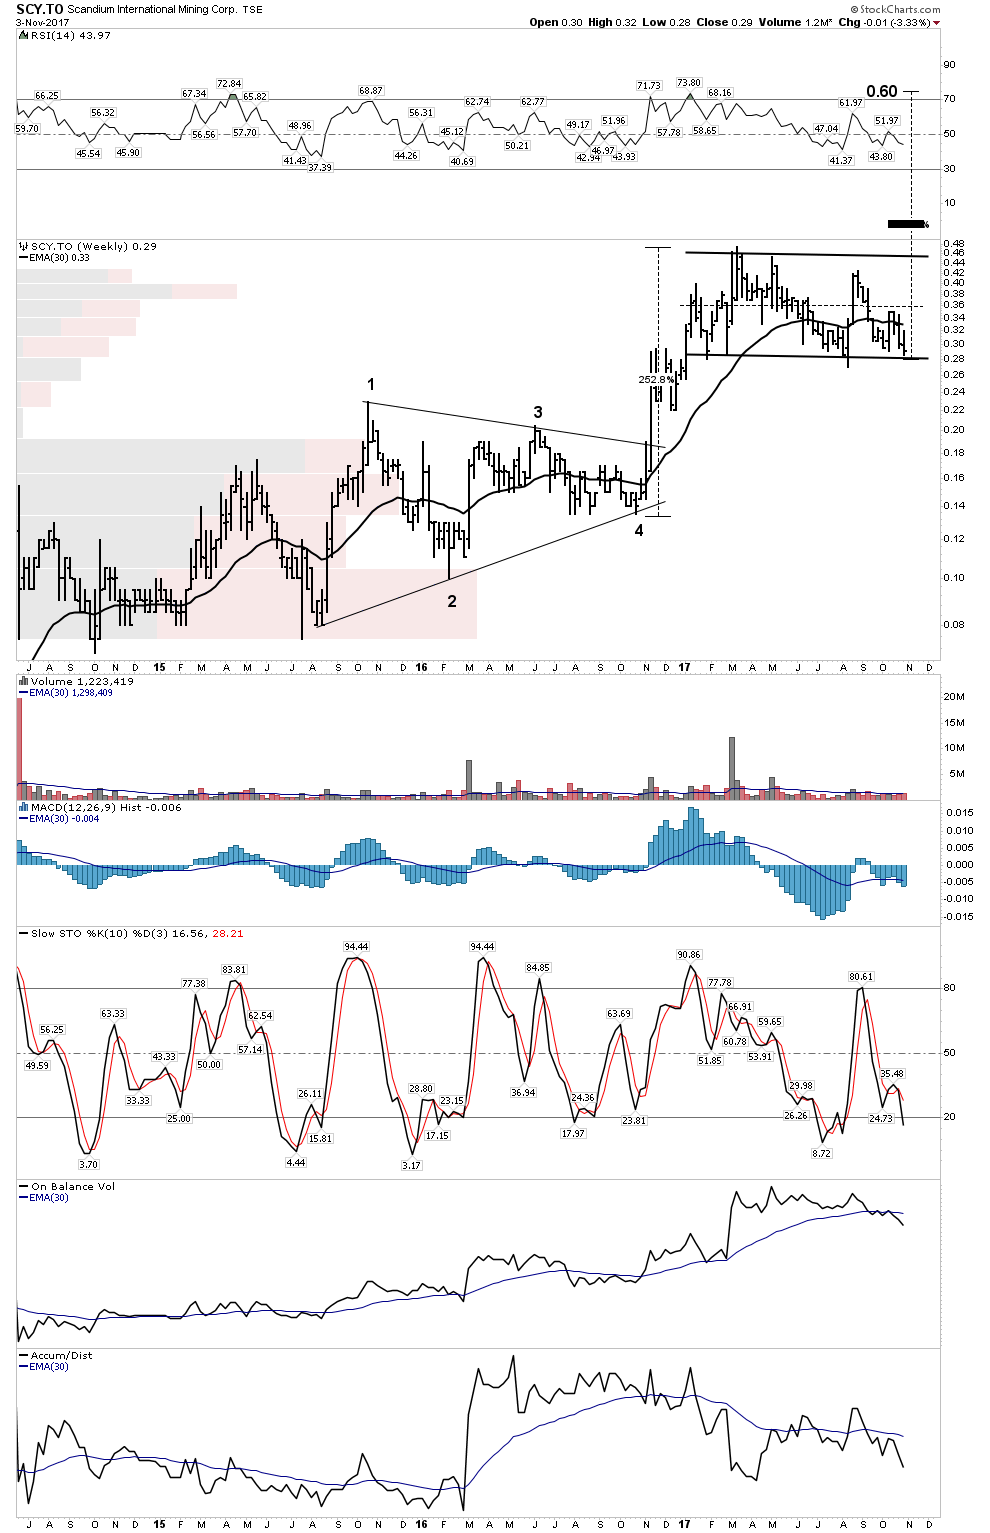
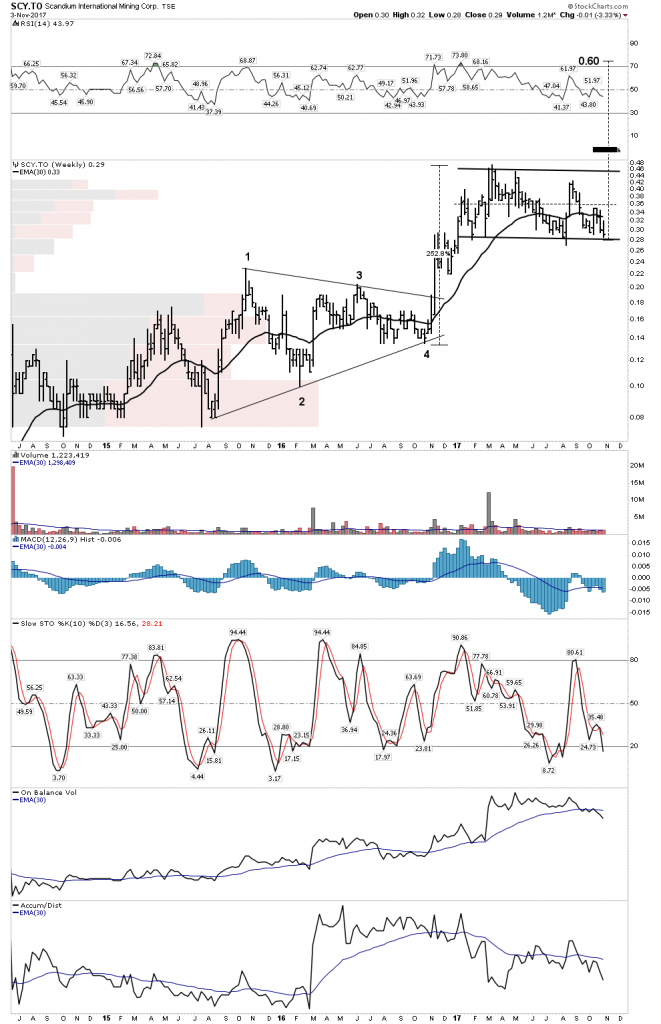
John Kaiser thinks ultimately Clean TEQ will find Scandium Intl. a perfect fit and will acquire them somewhere down the road. What we saw this week with Alterra could be a precursor to SCY:
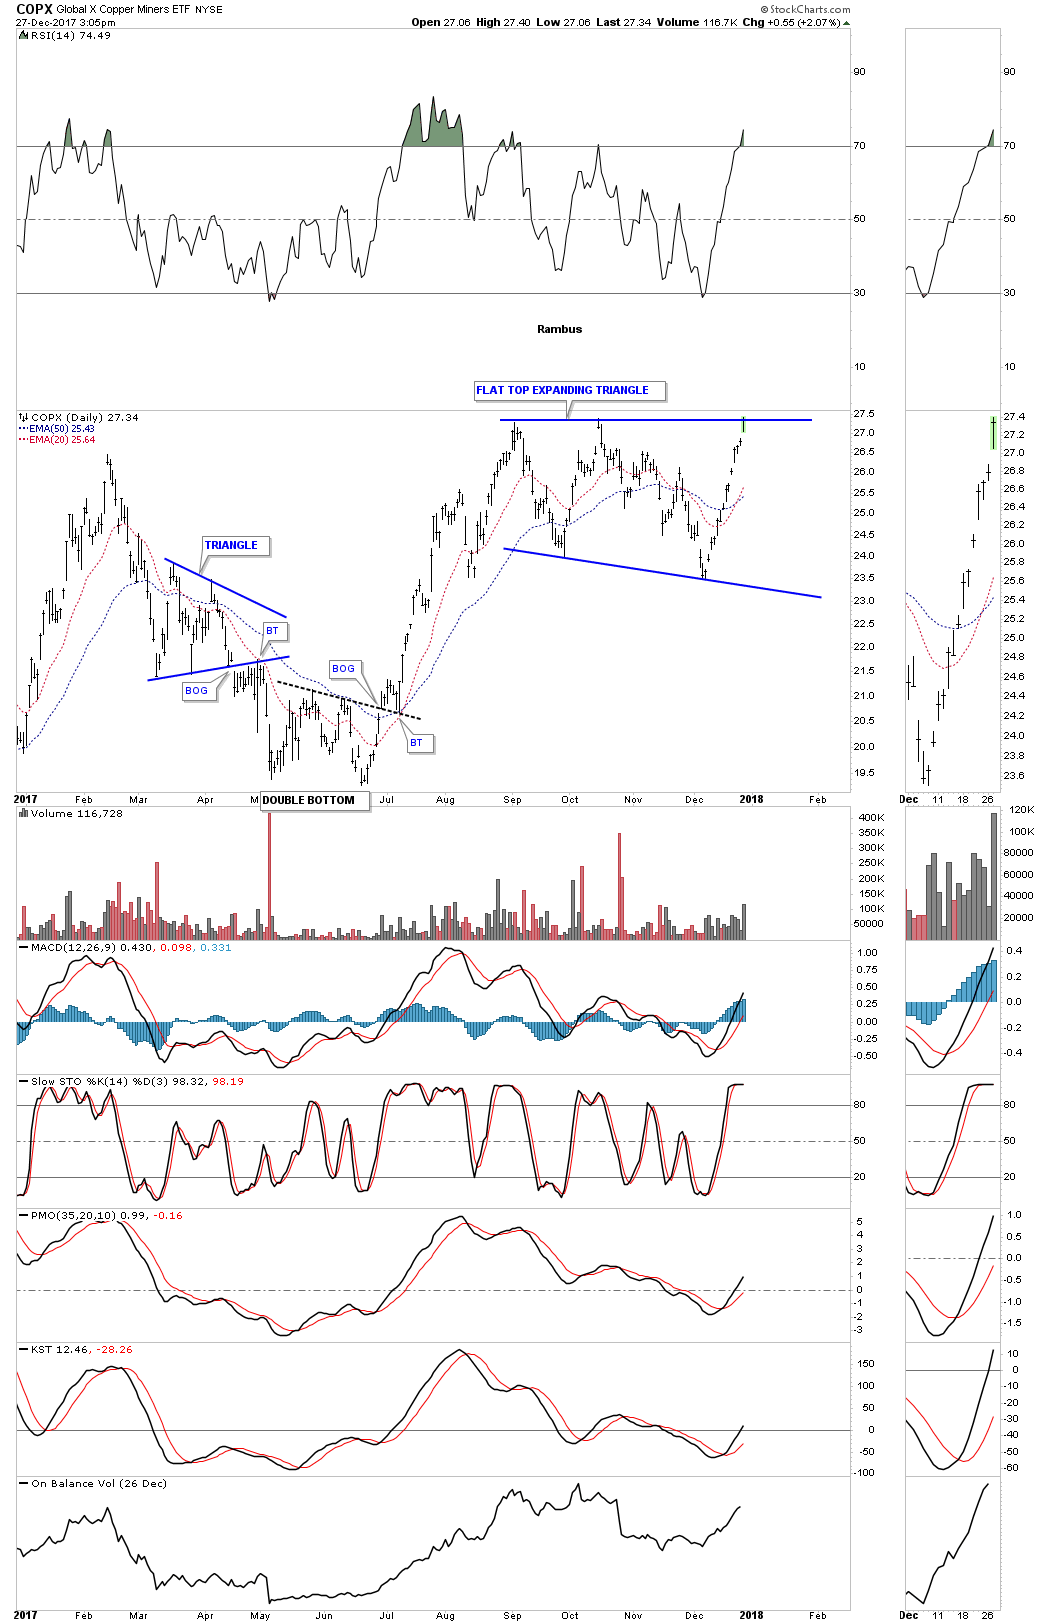
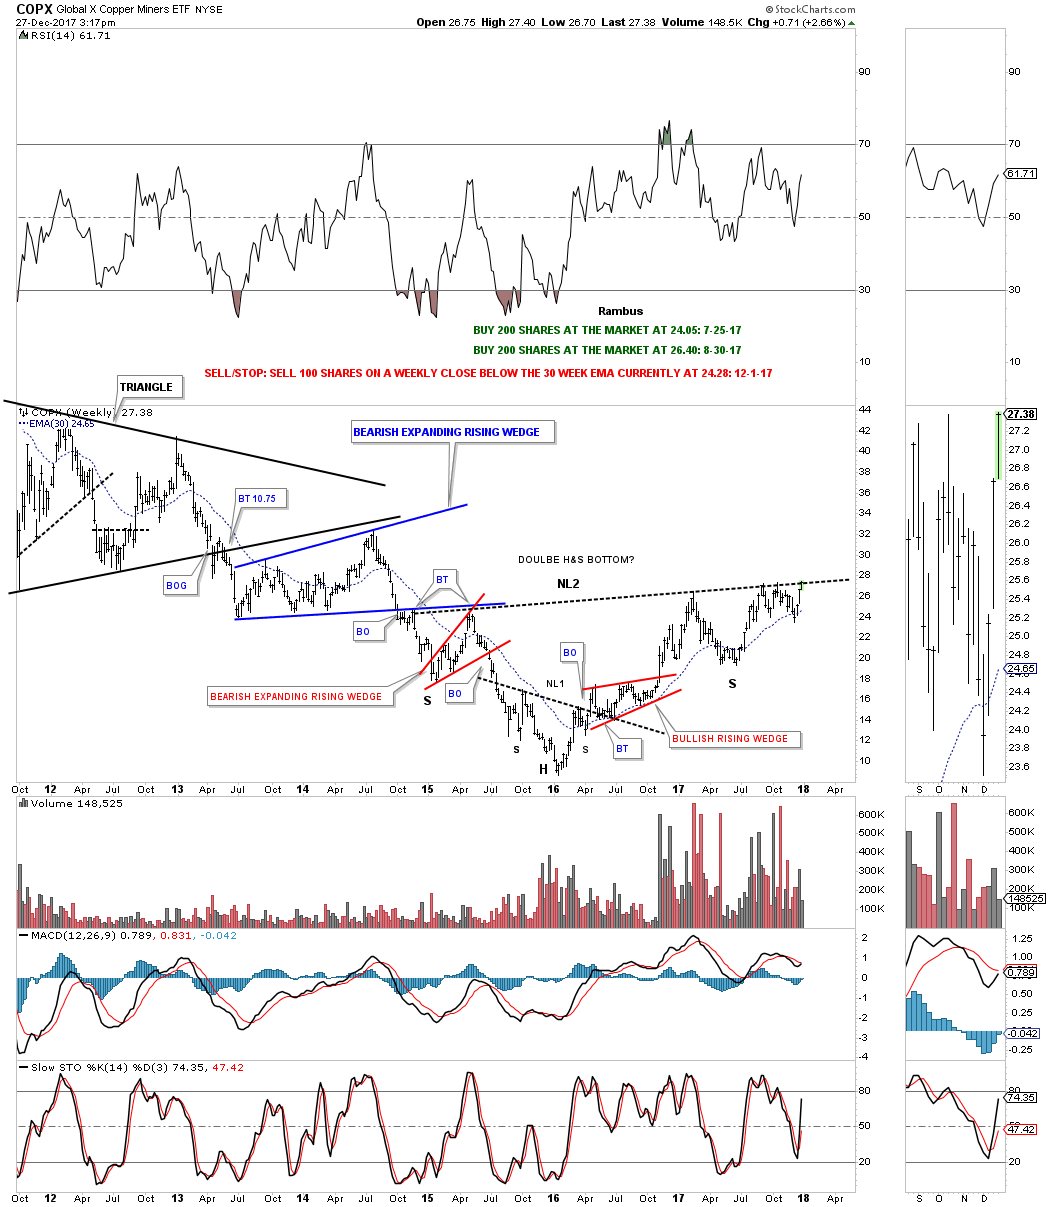
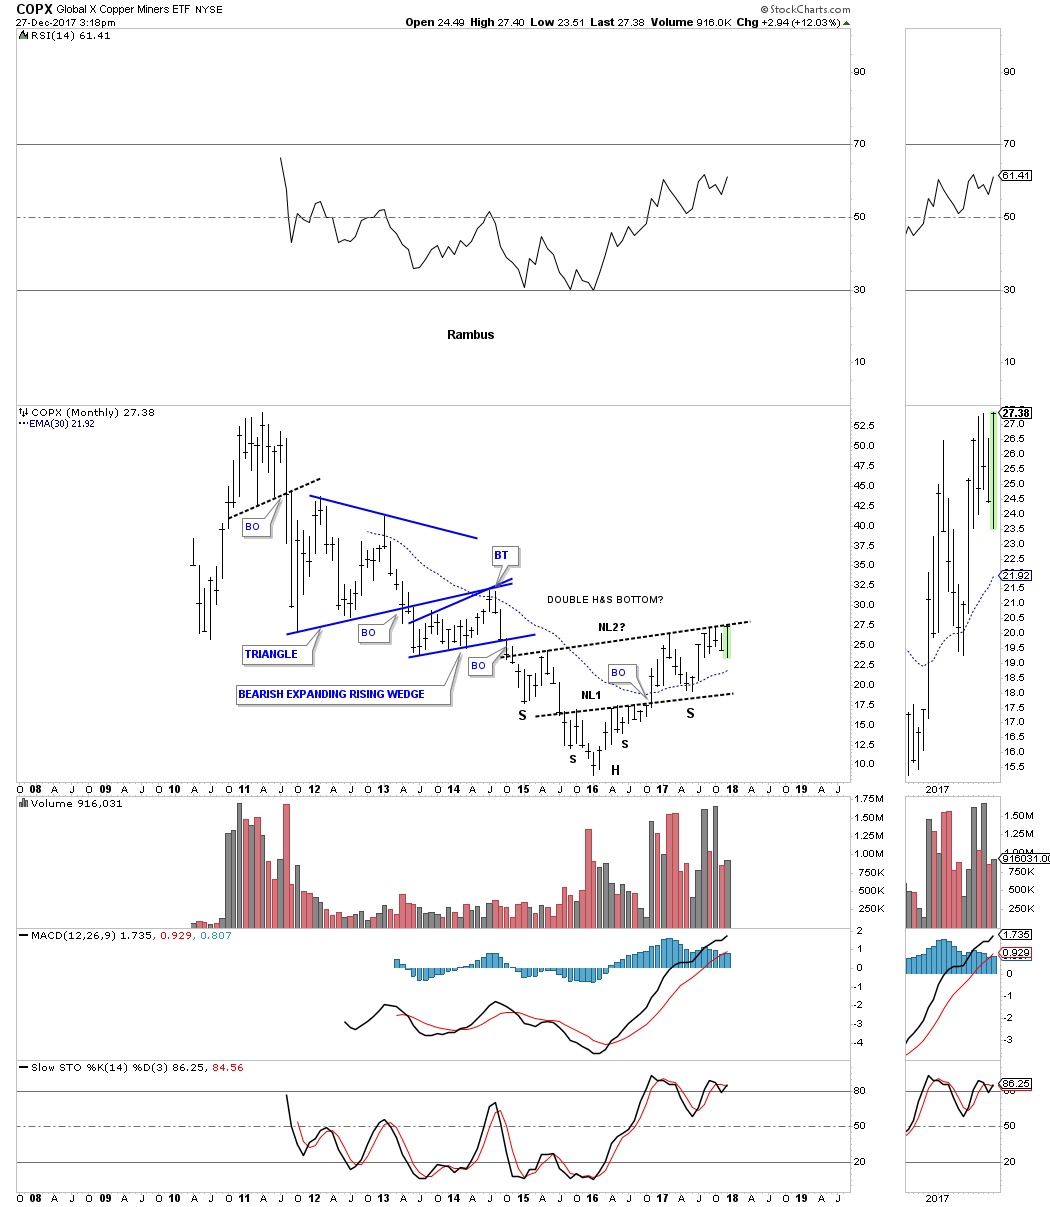
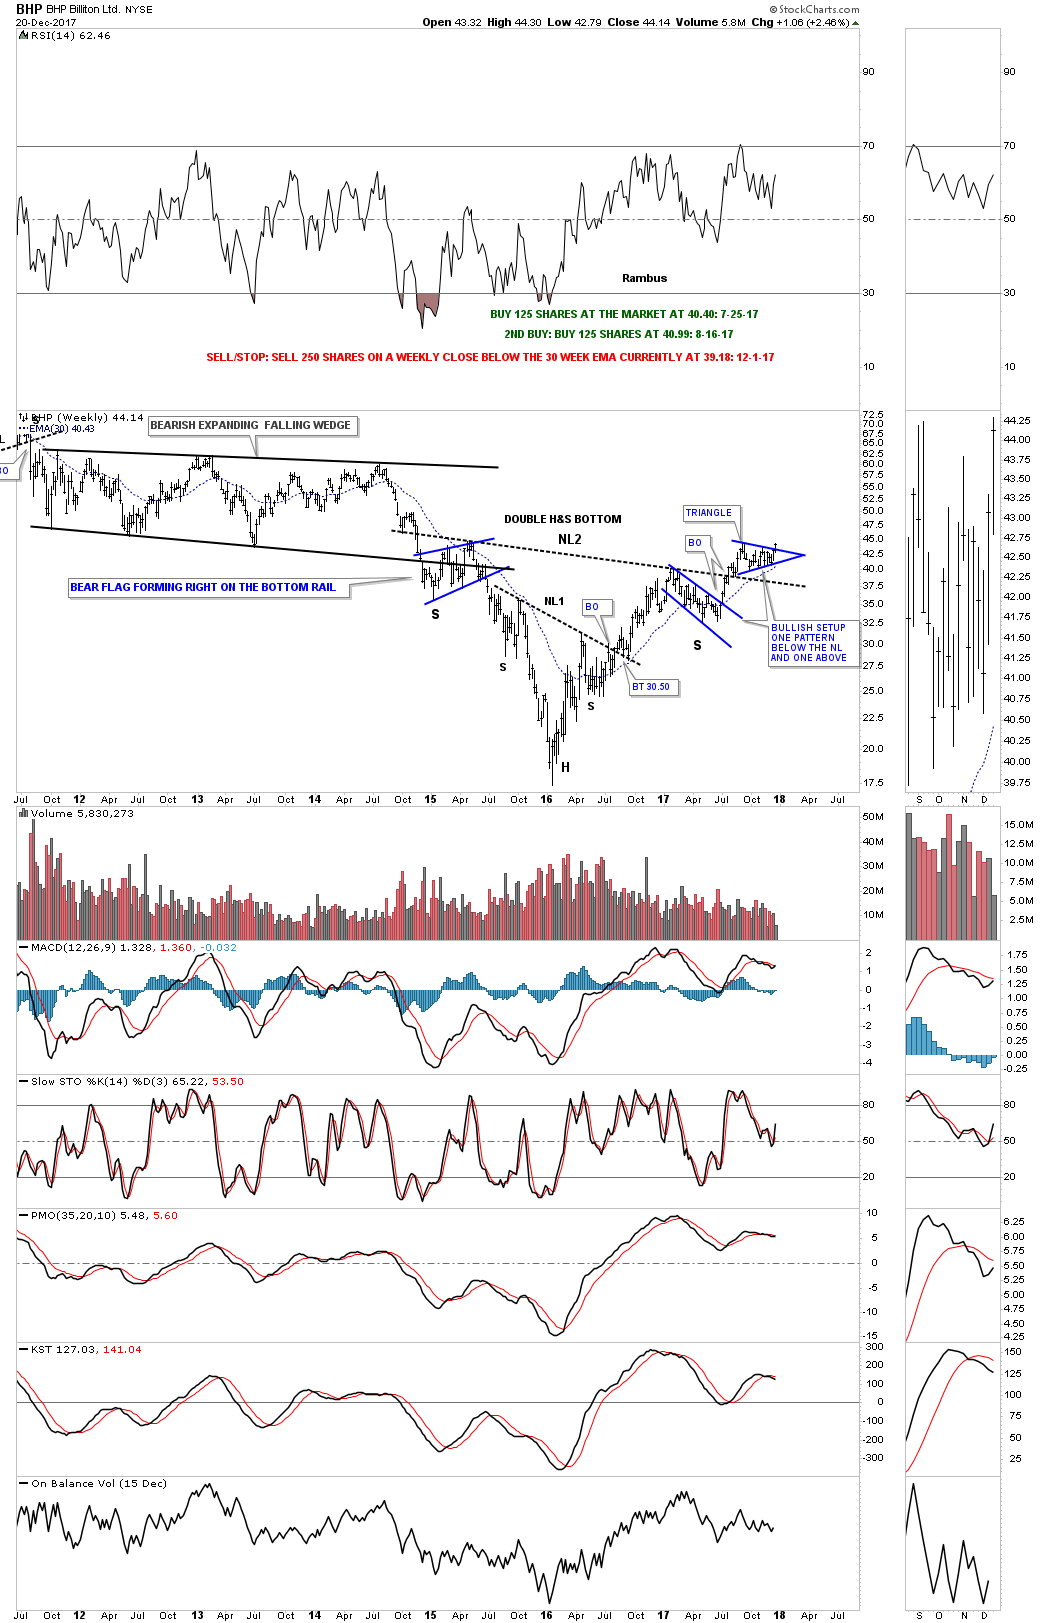
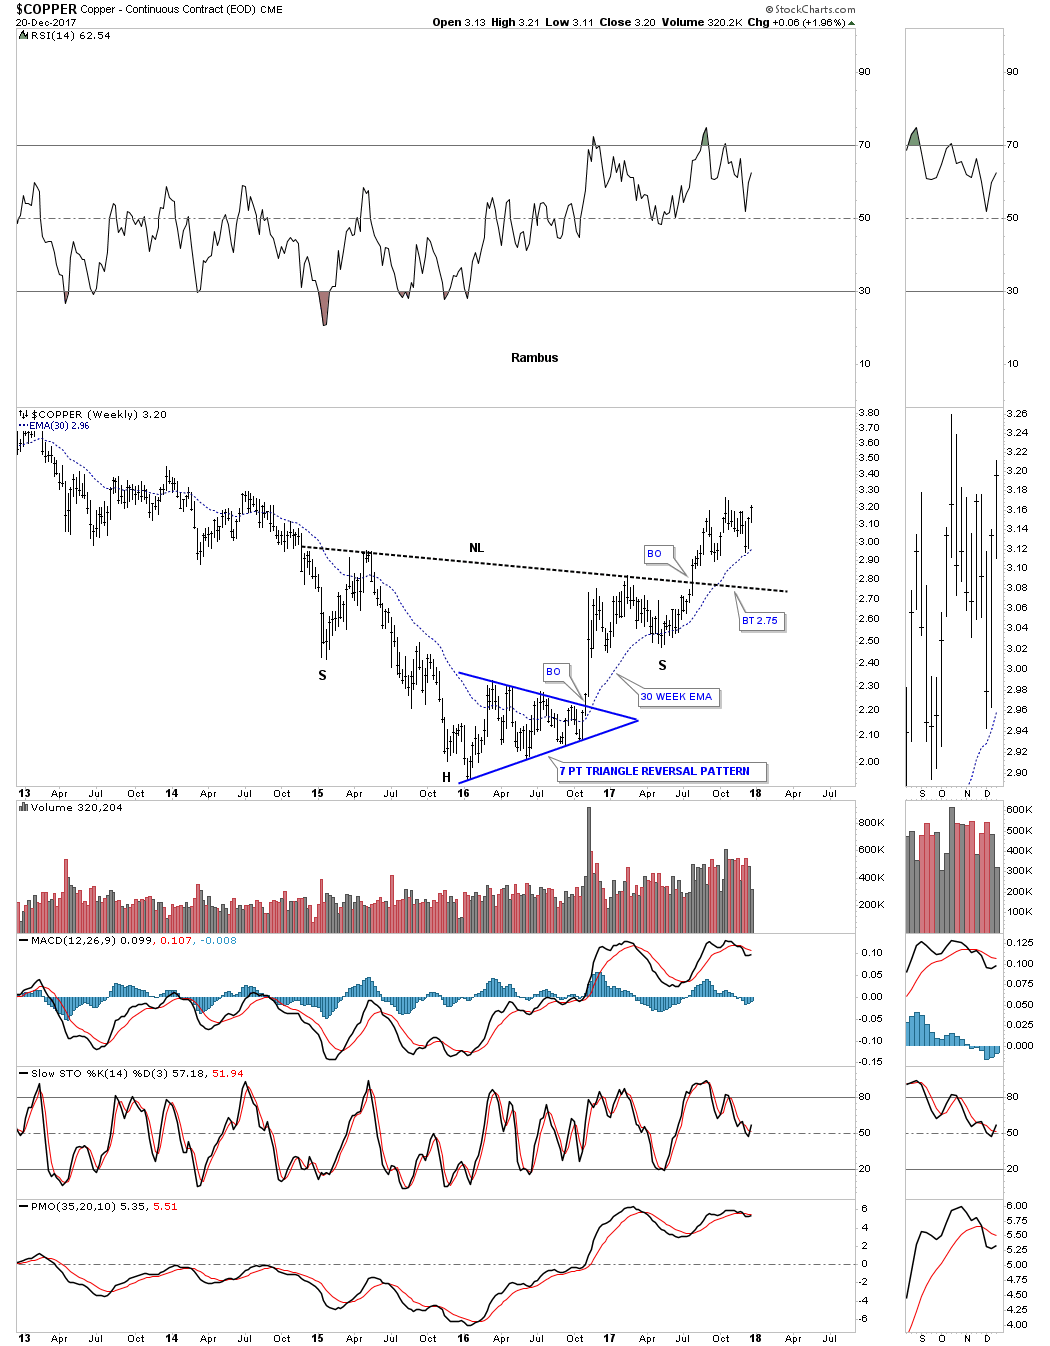
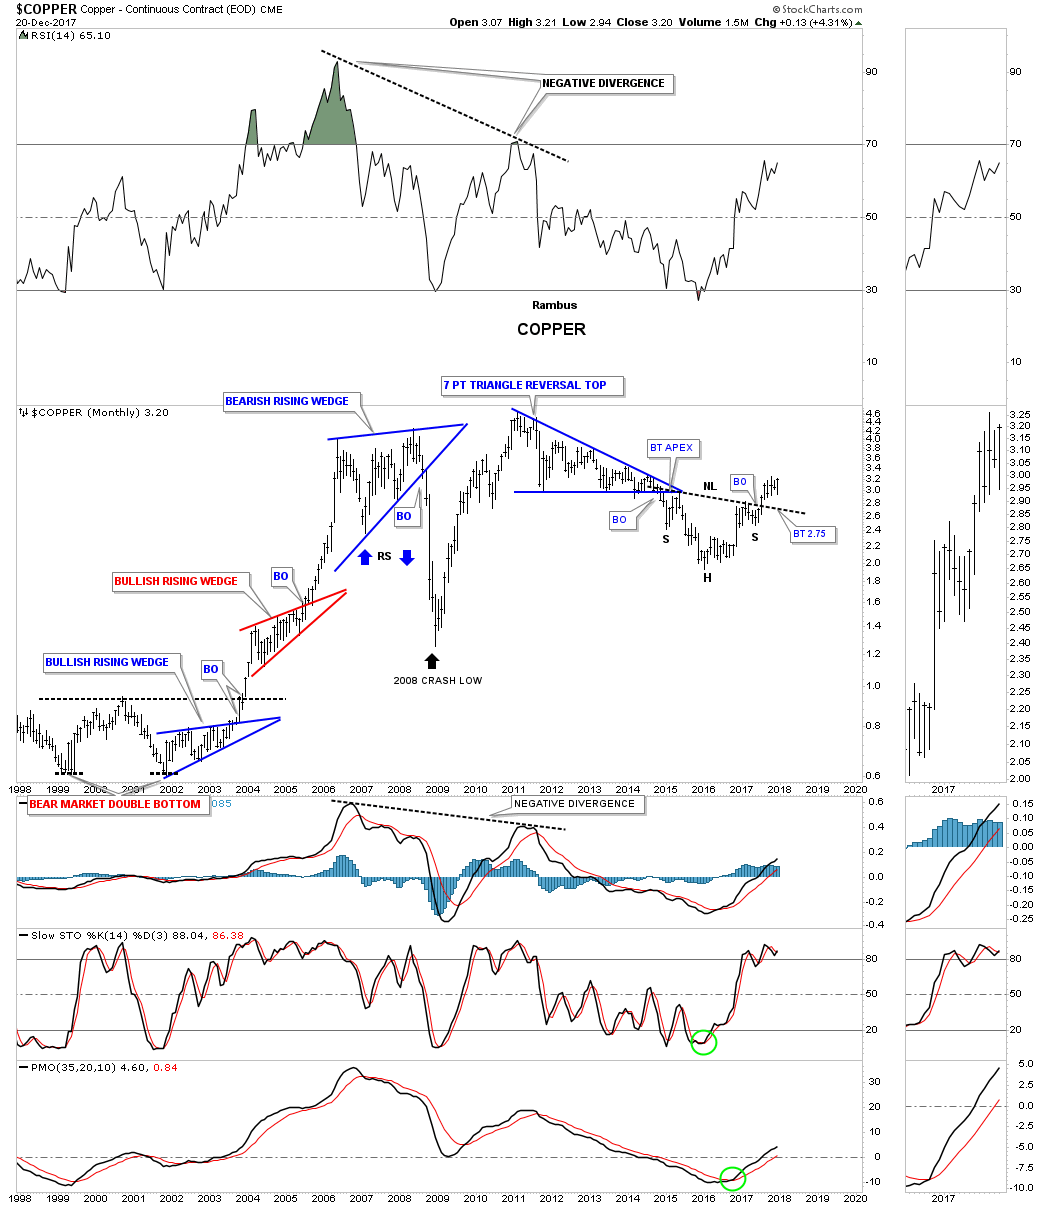
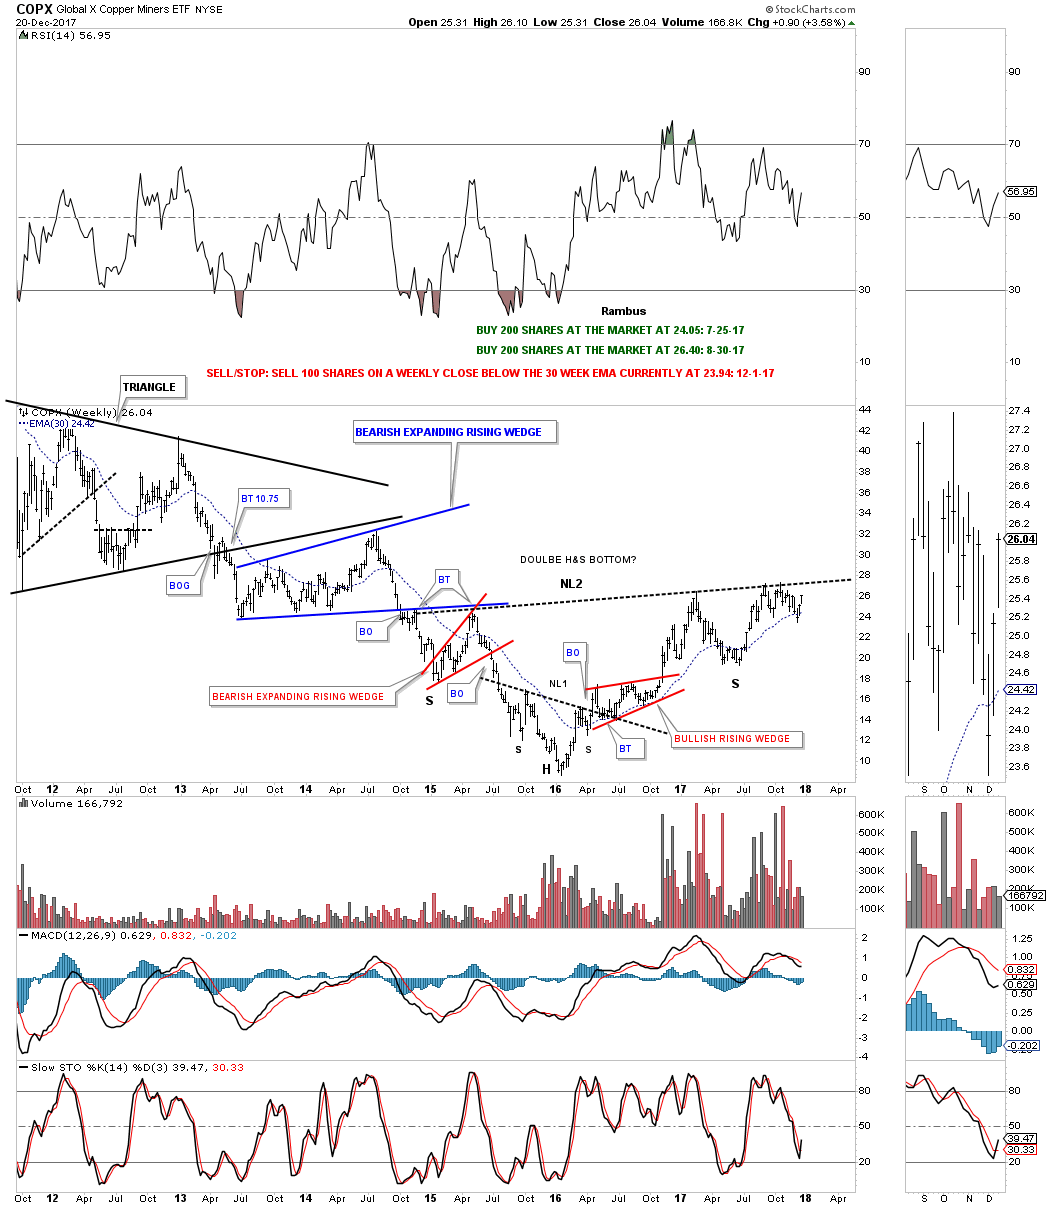
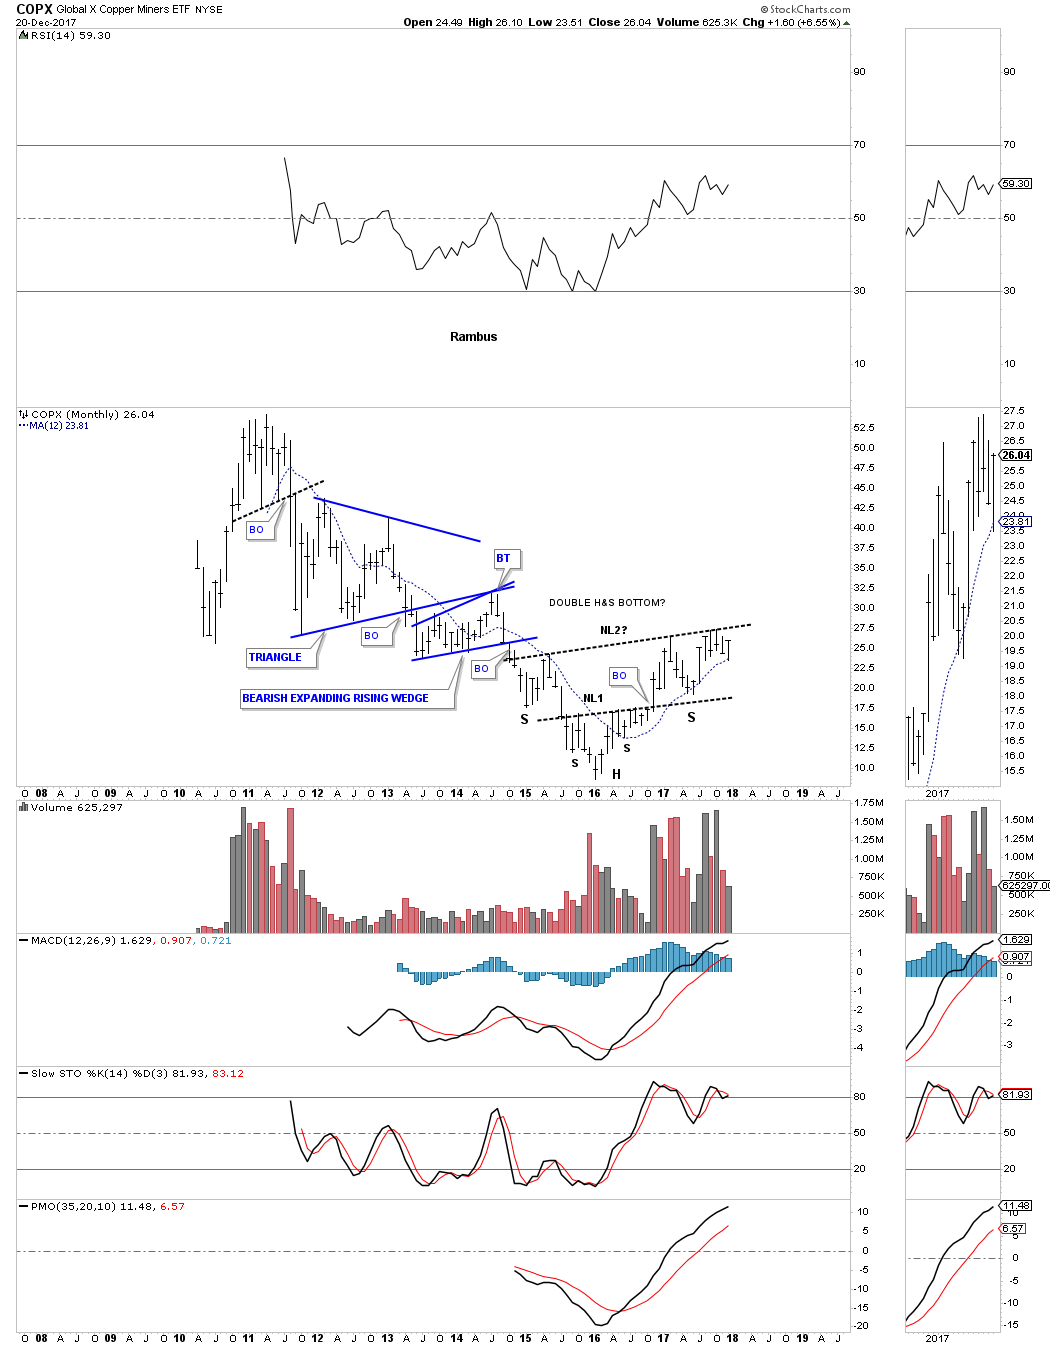
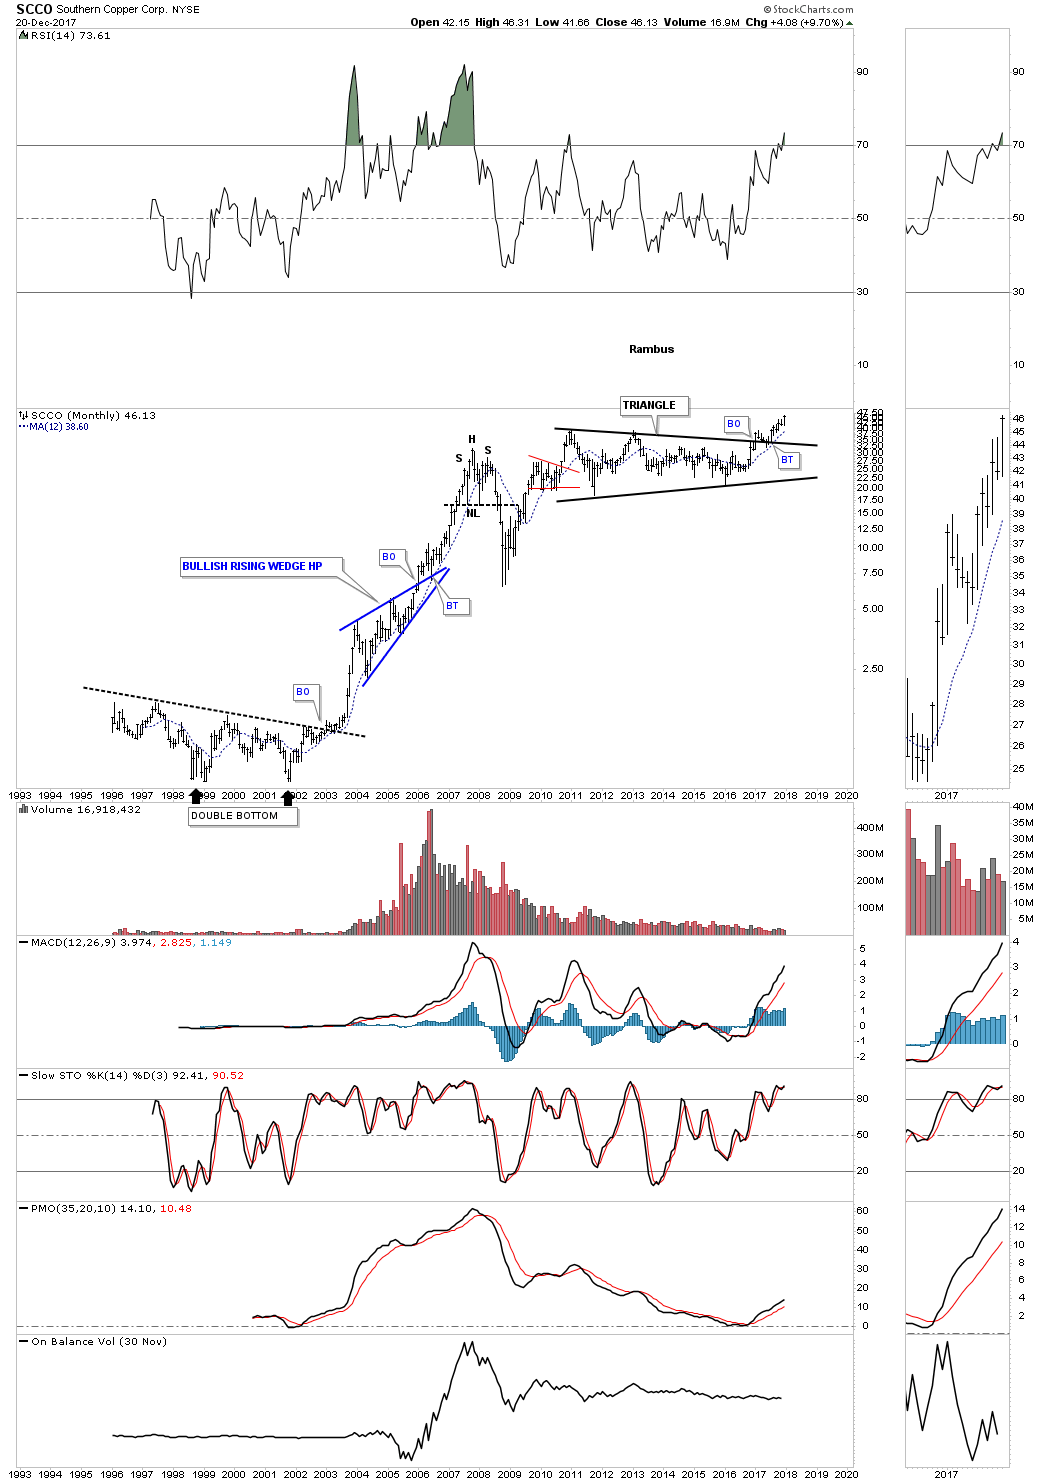
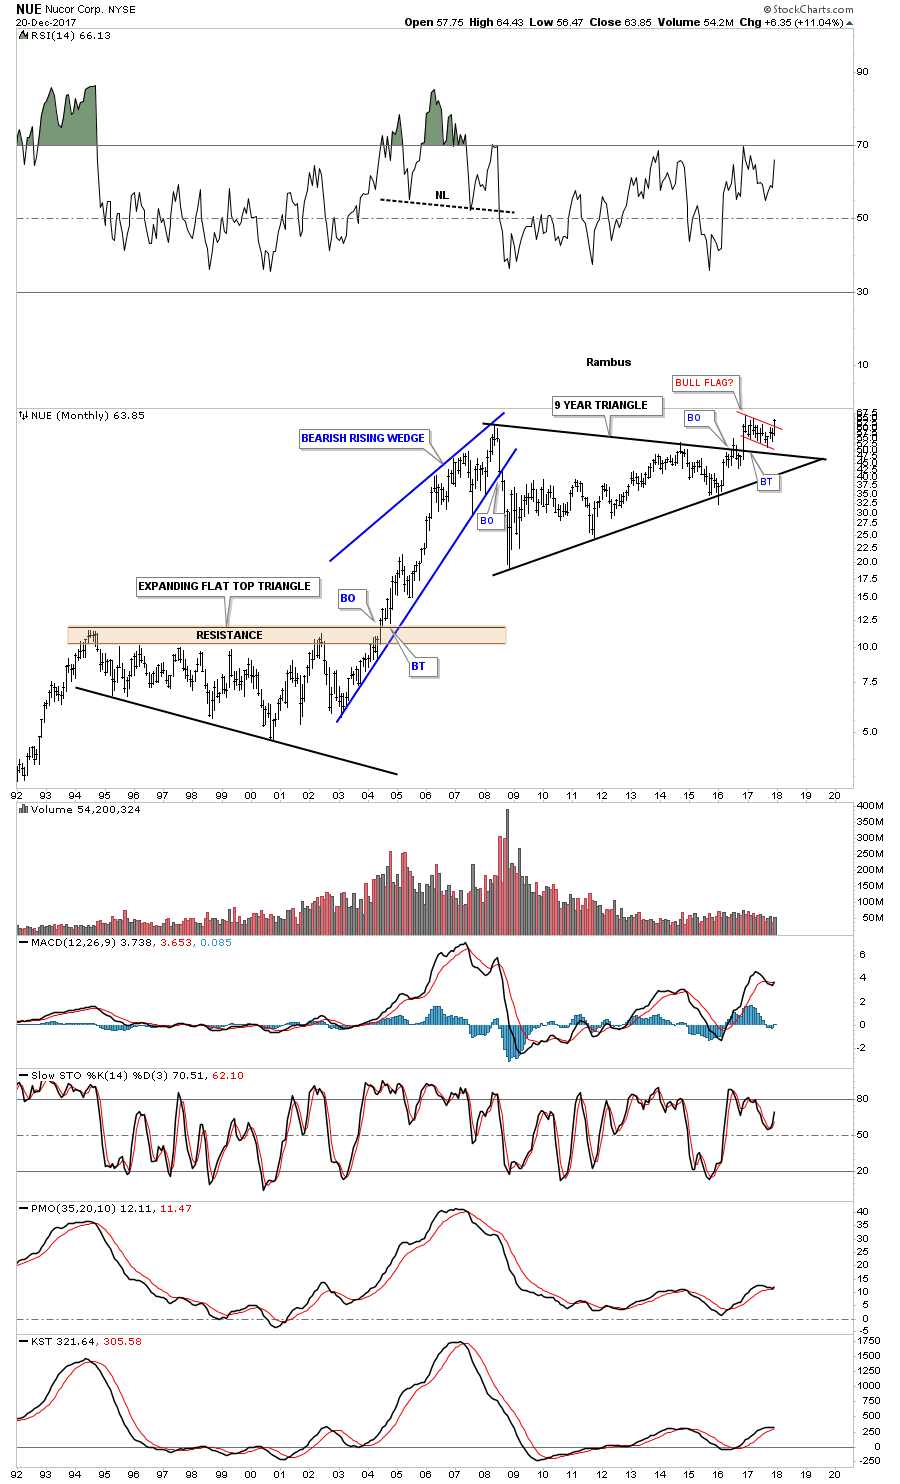
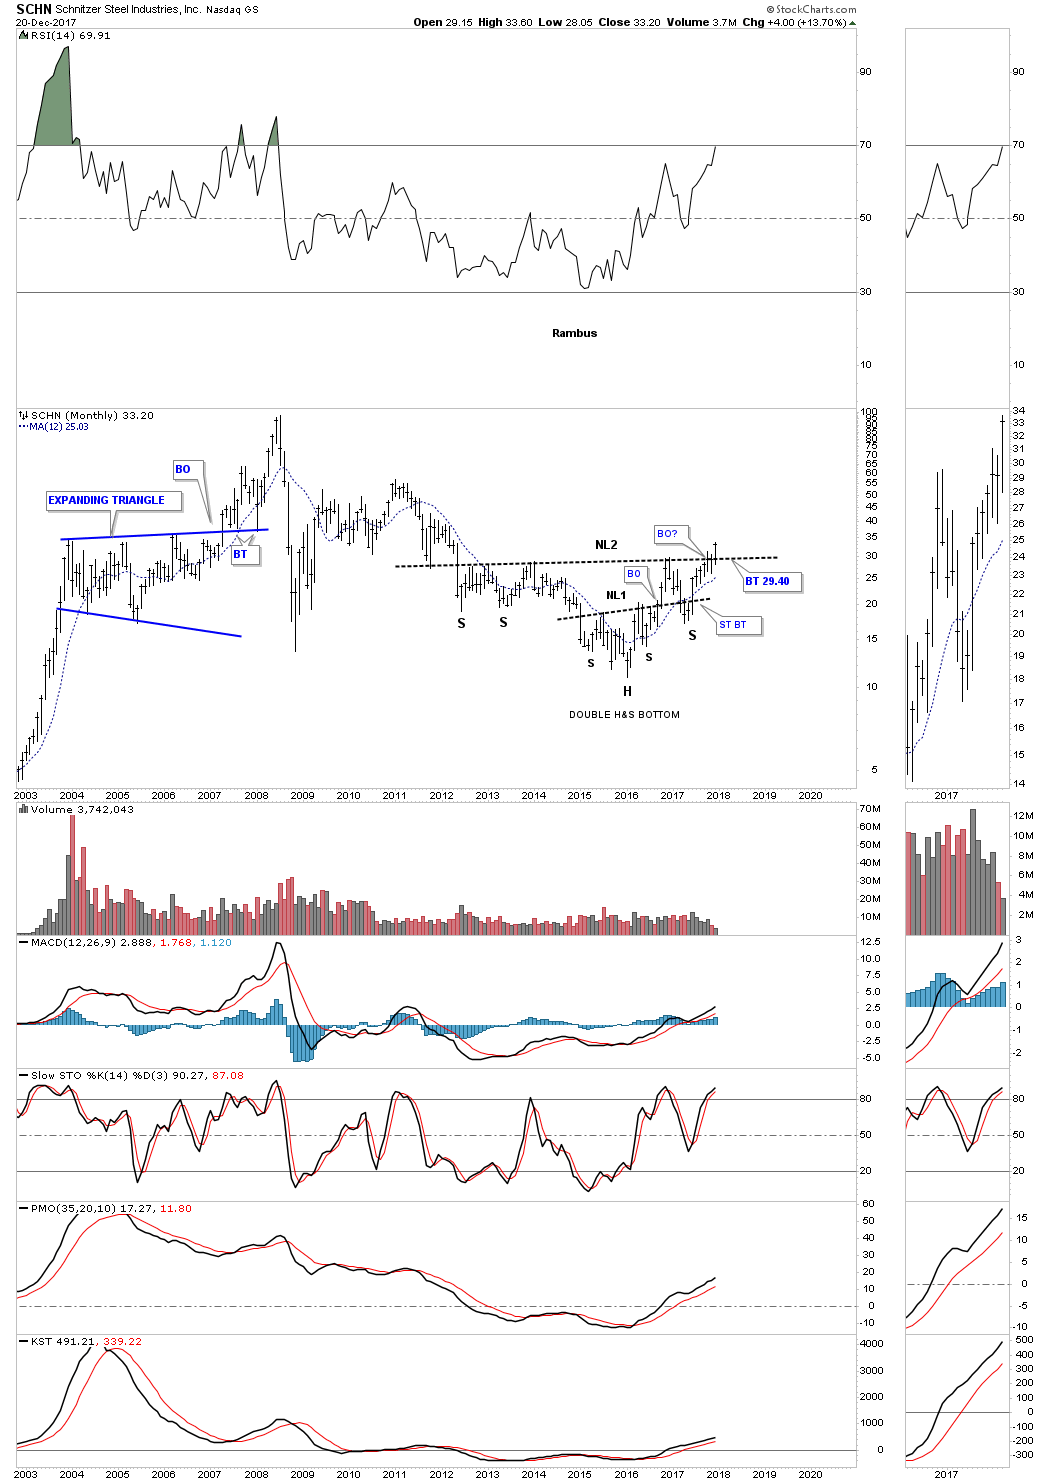
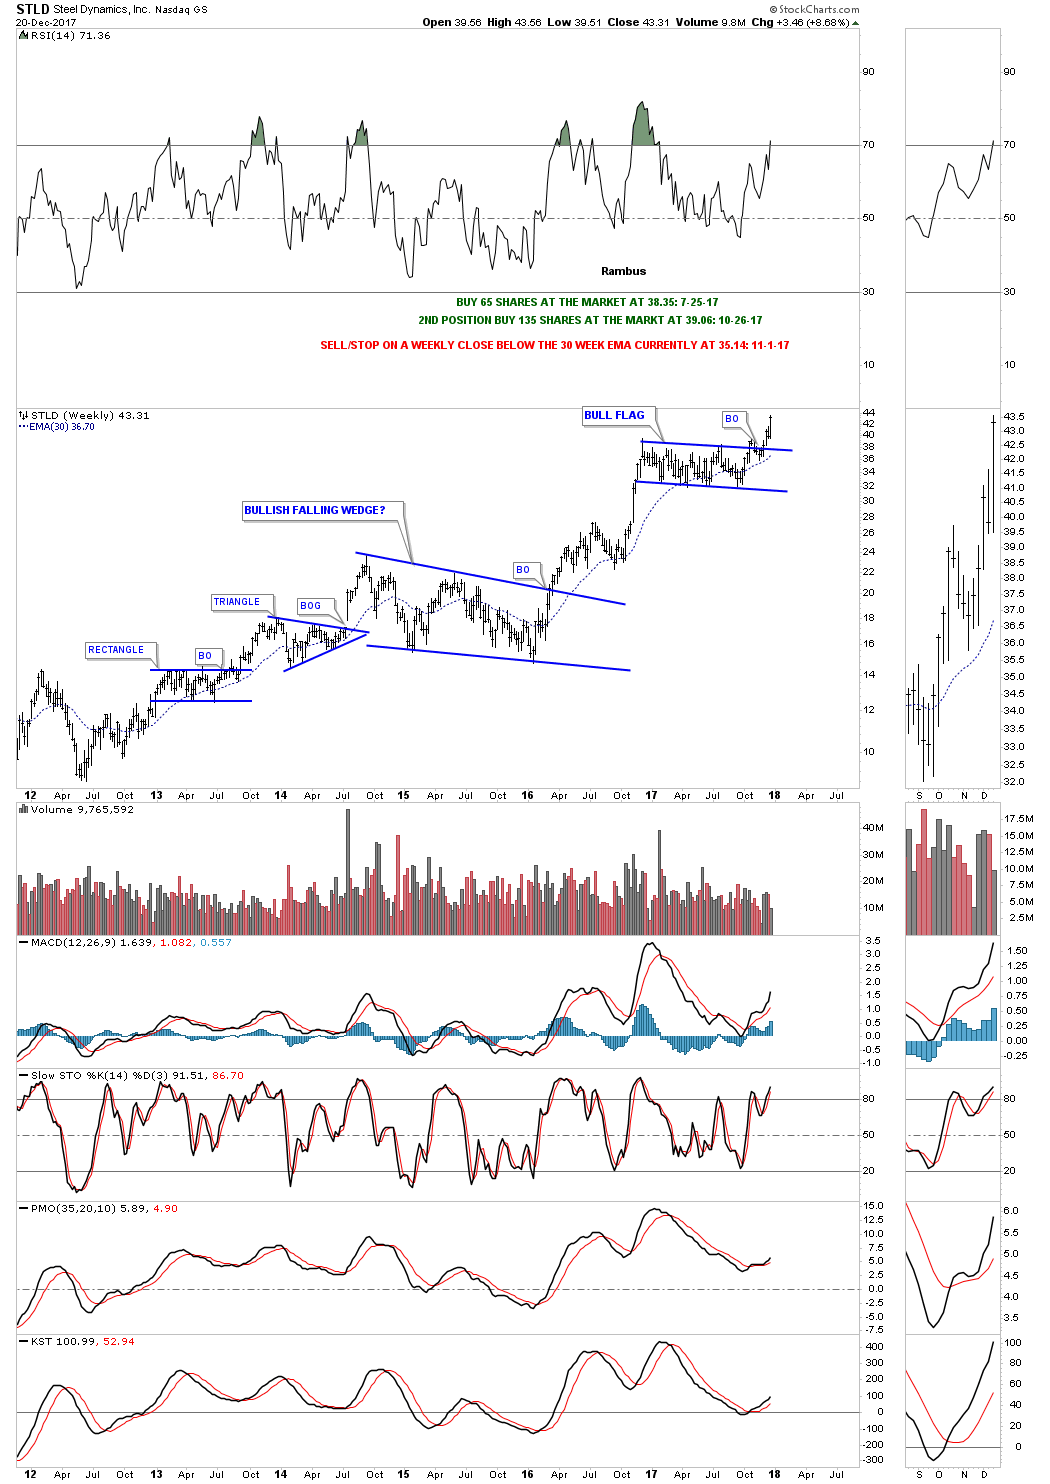
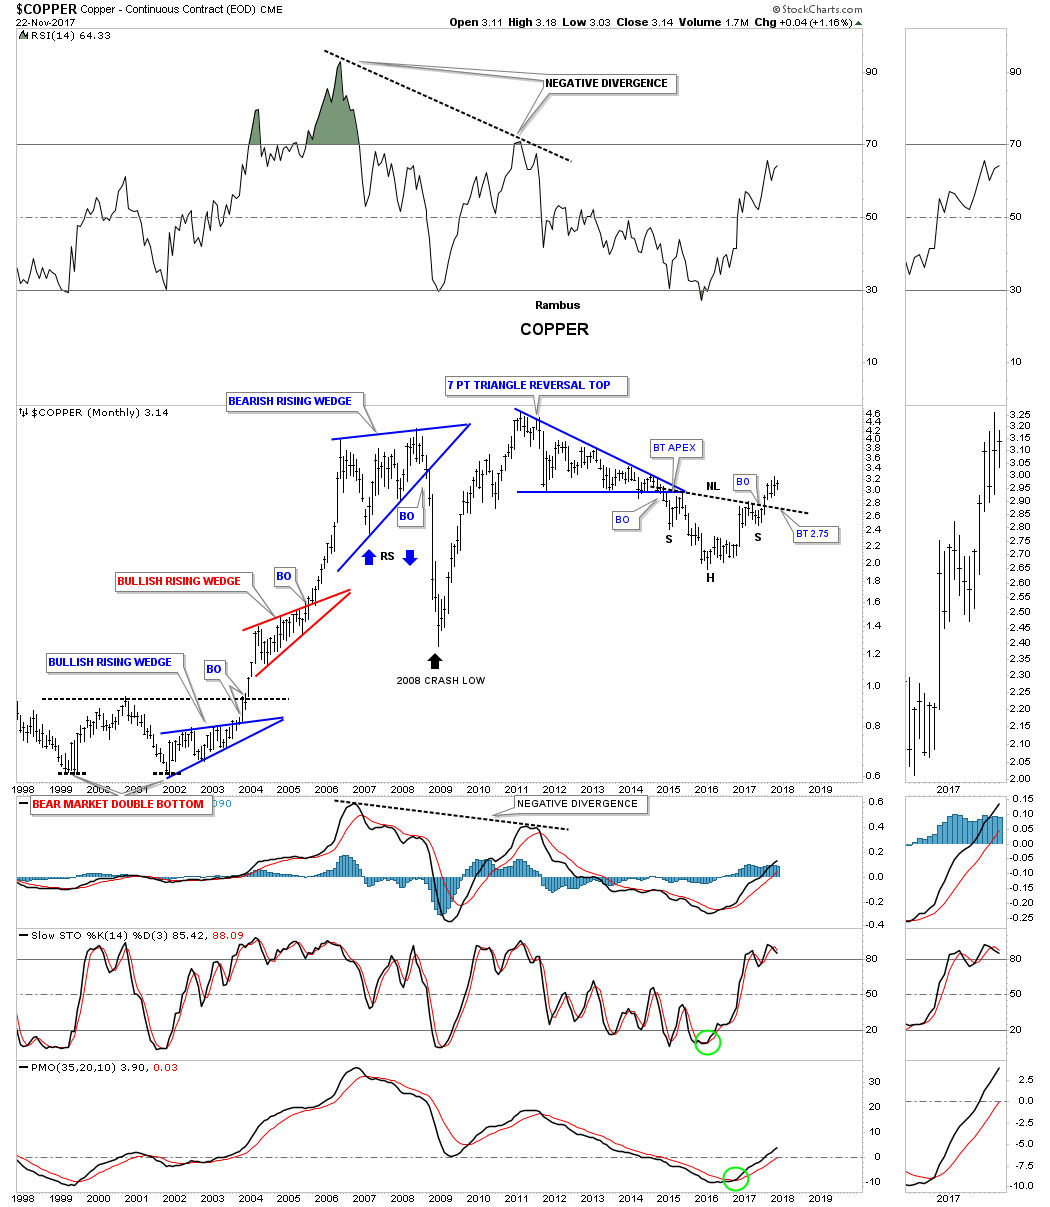
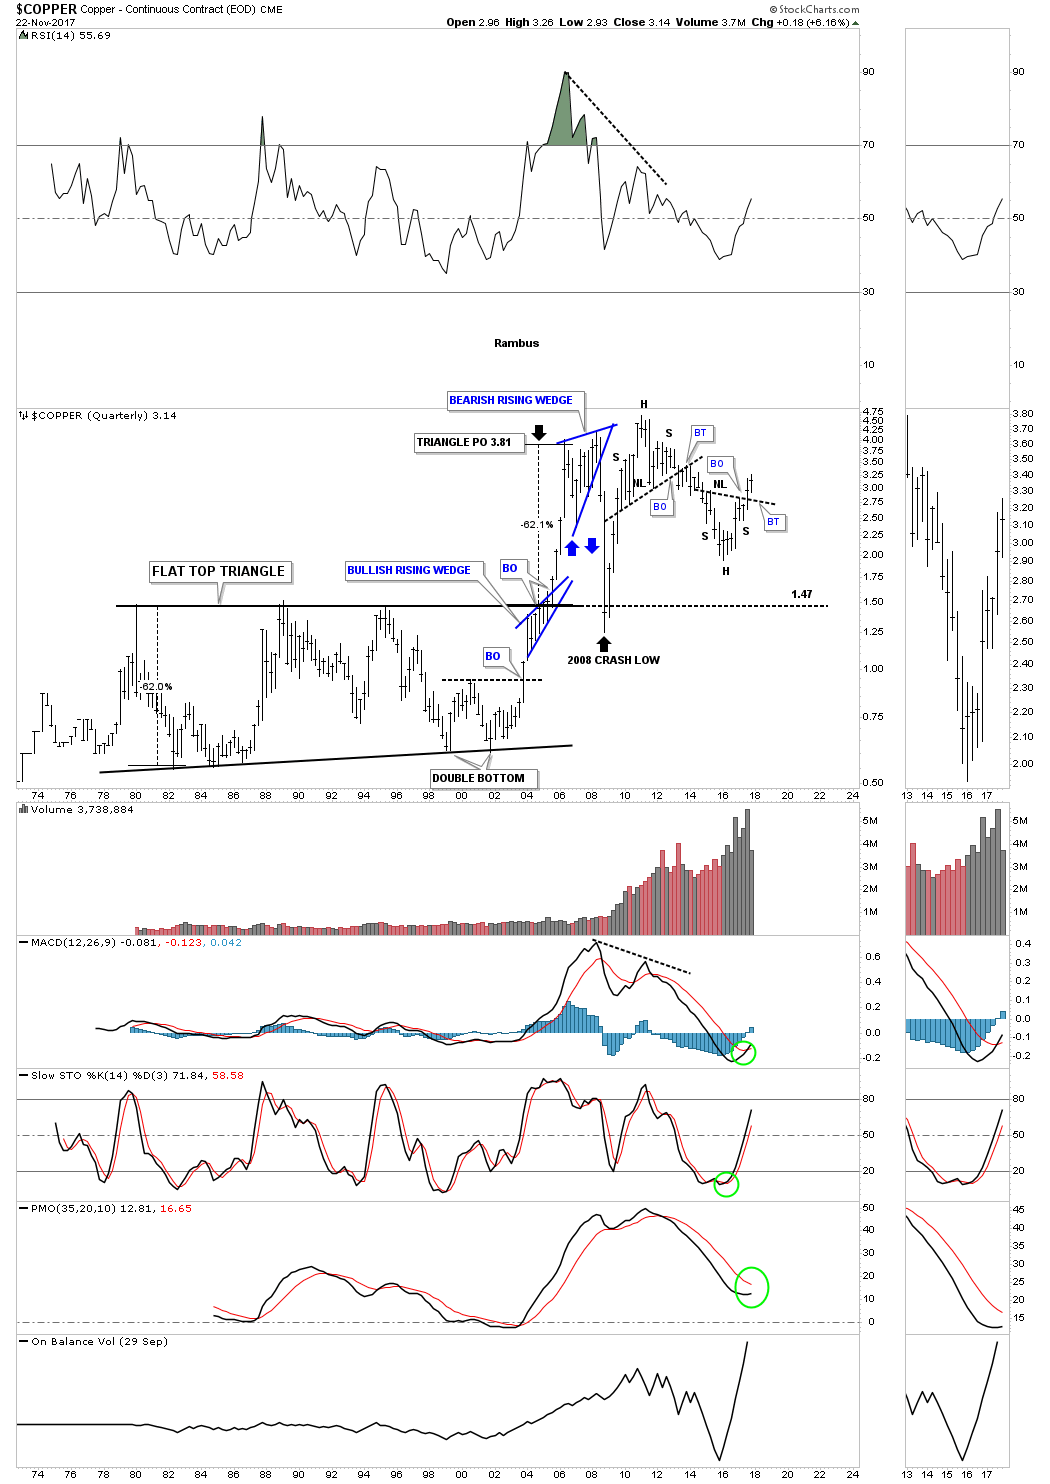
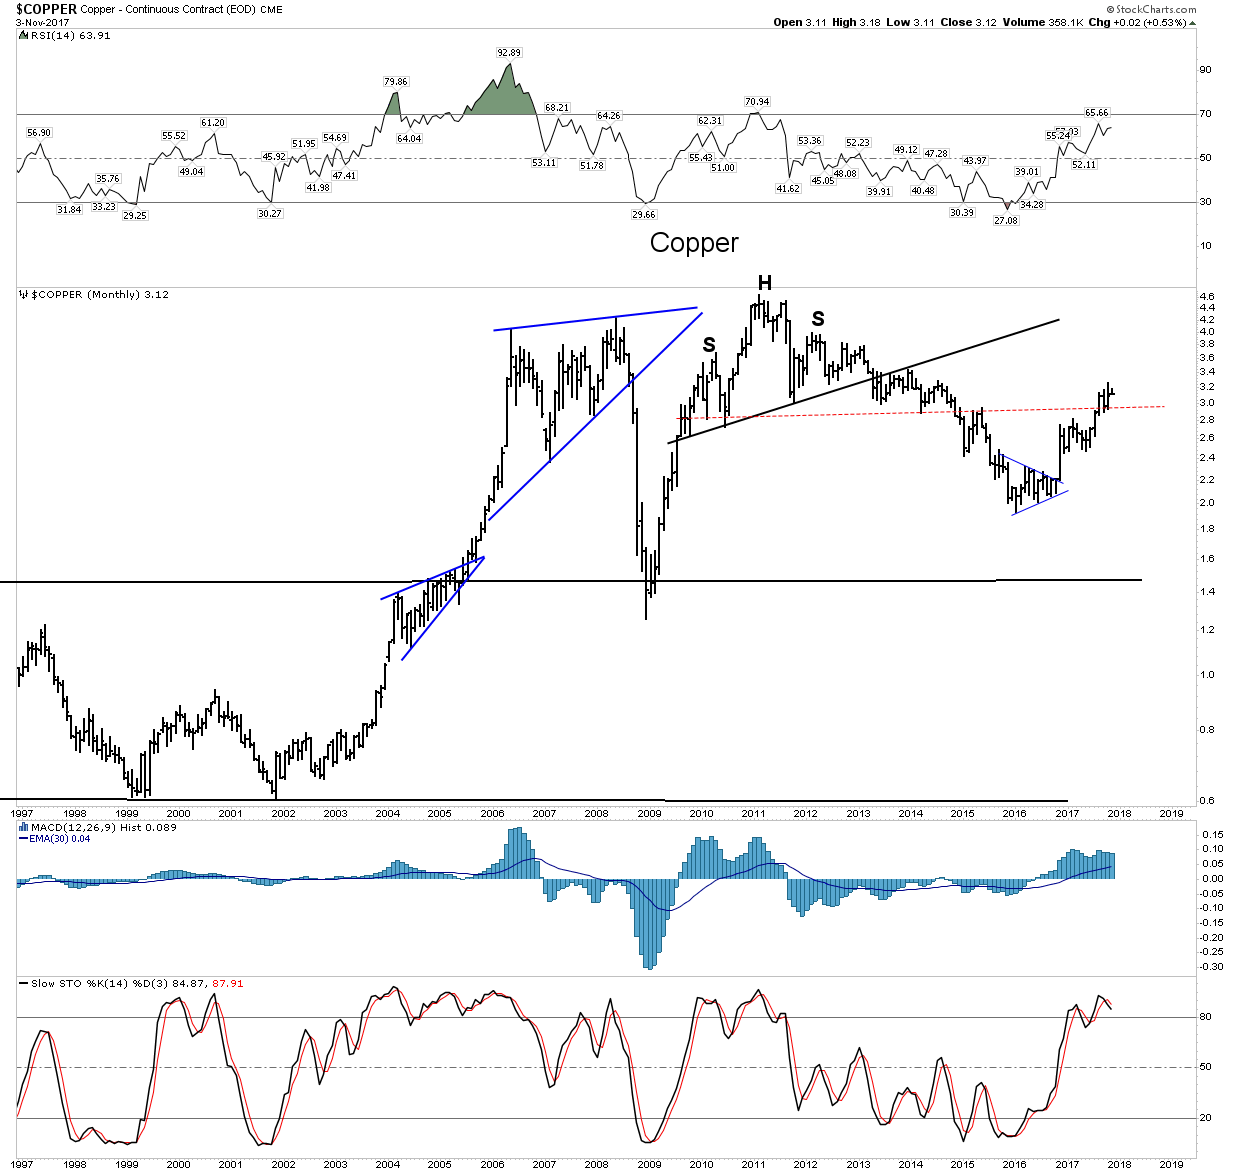
Copper
With the rising USD threatening copper’s continued ascent, copper still seems relatively impervious to the threat.

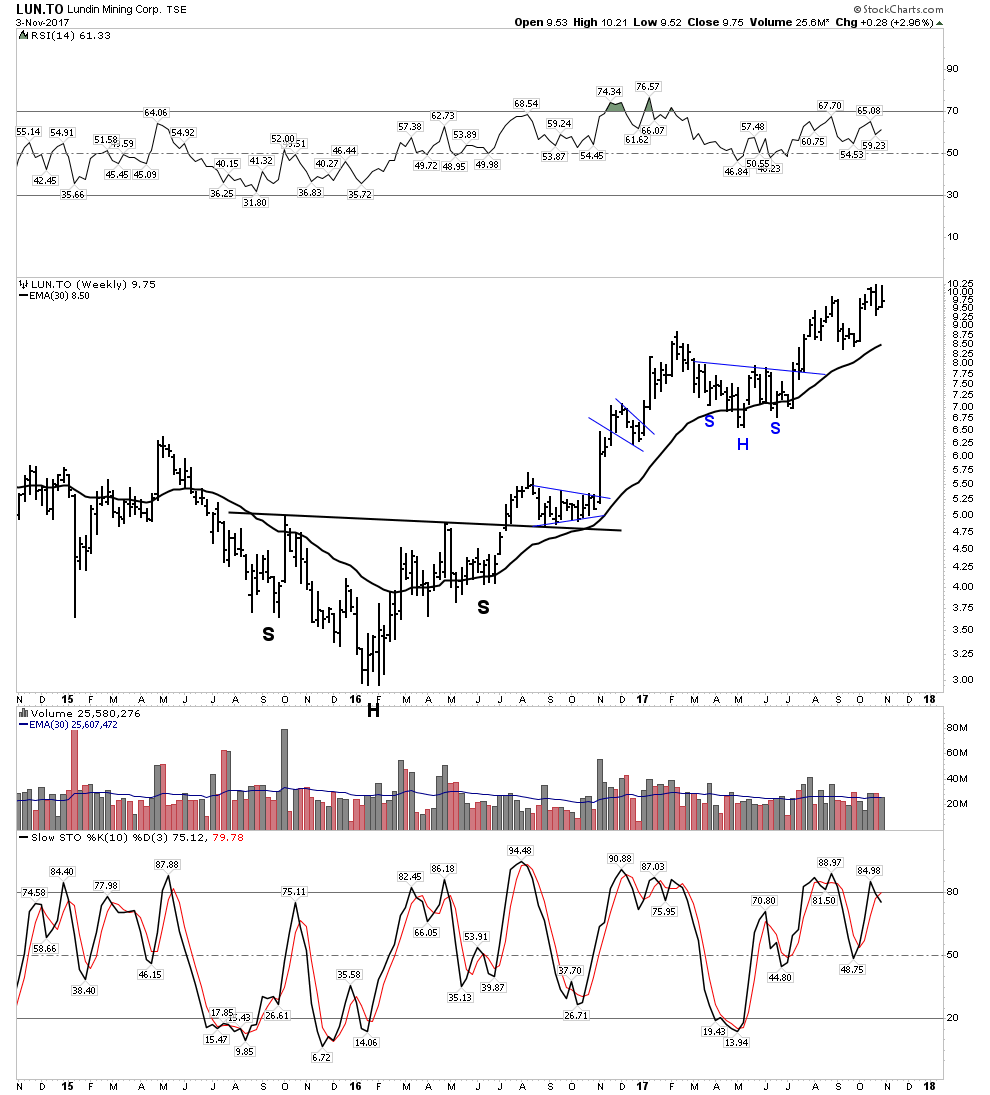
Nevsun– My favorite copper play mainly because I am a sleuth for value. This recently underwent a brutal shakeout but is now in stronger hands and back on track.
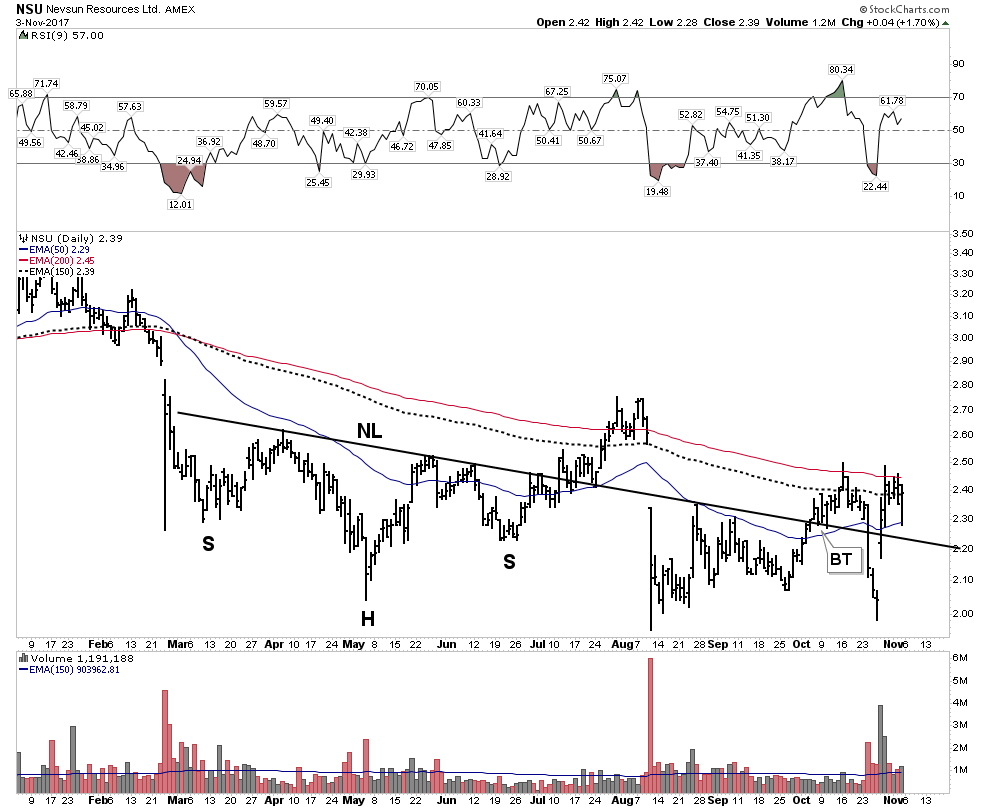
Before Nevsun can make it to production in Serbia it may likely be taken out by Lundin:

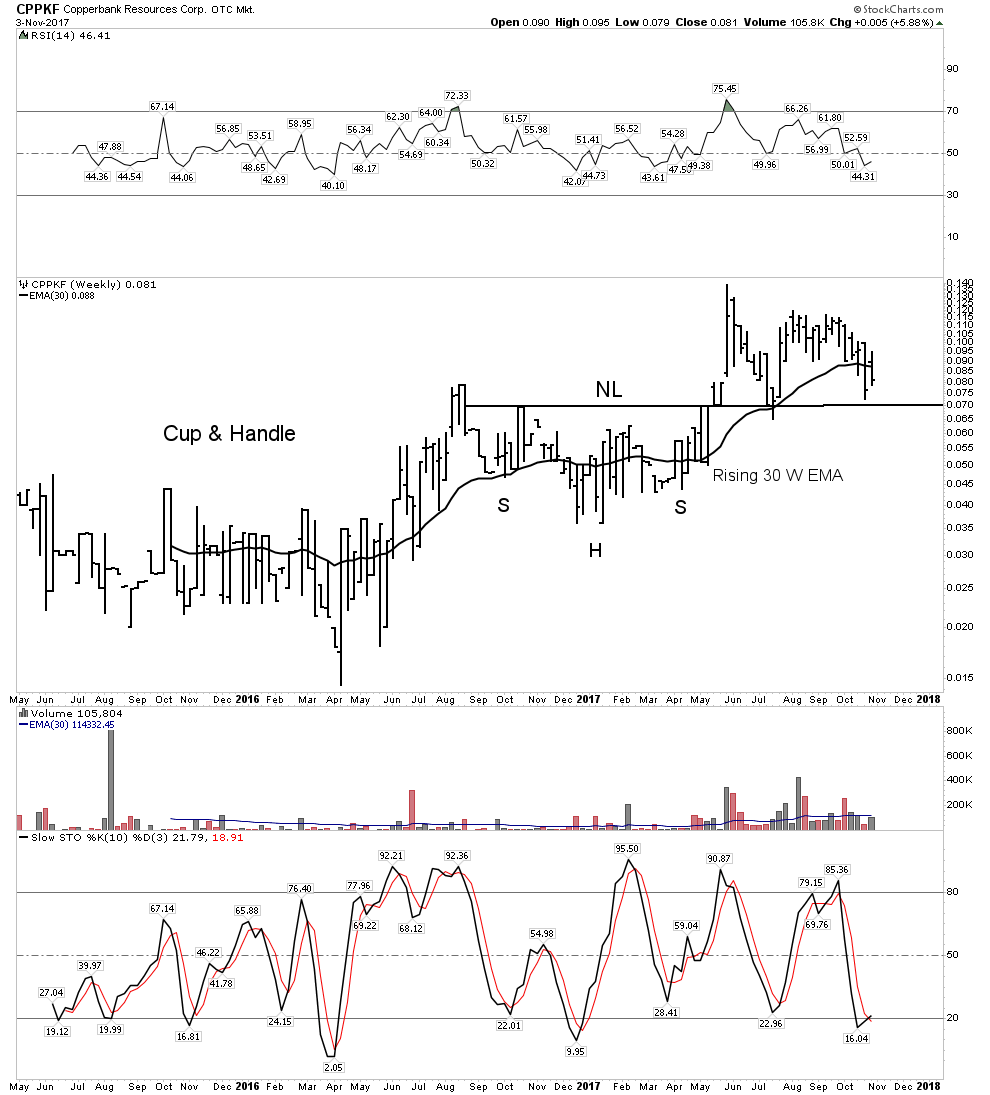
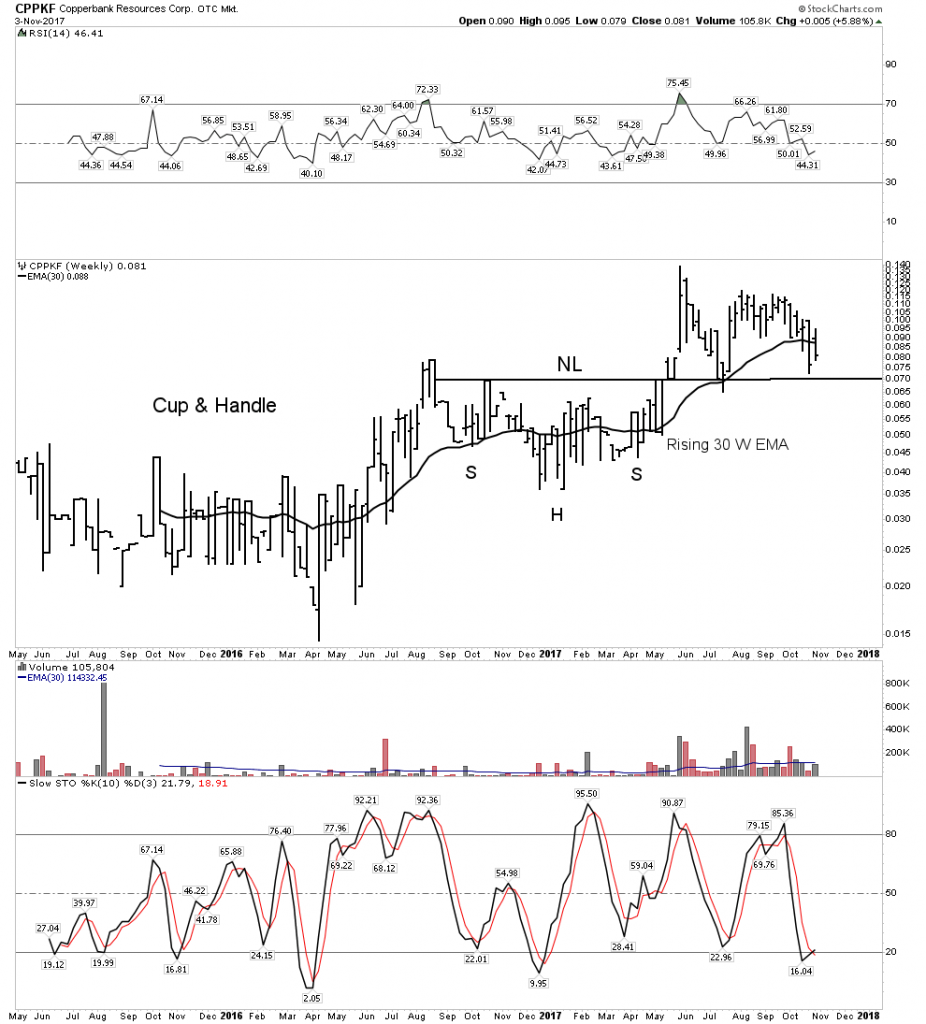
Copperbank– A good proxy for copper optionality plays:
Uranium– Everyones Whipping Boy:
We have been down this road before, but eventually it might just turn around. This week the “other” yellow metal bounced or at least its proxy ETF did.
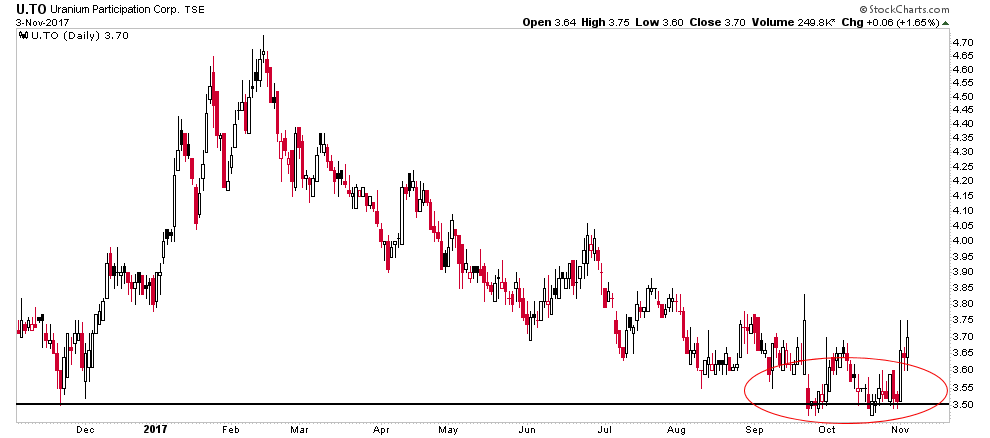
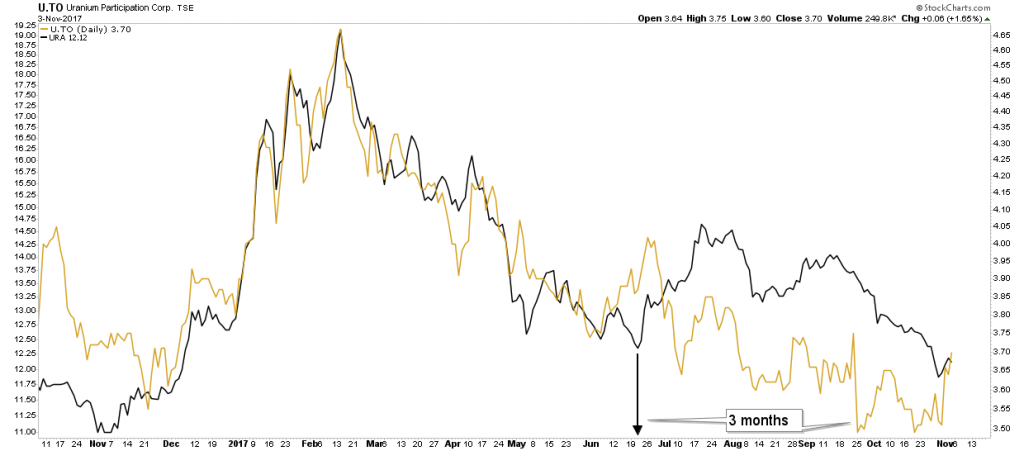
Is this significant? Maybe, but I don’t like the fact that the stocks didn’t seem to care too much as evidenced by URA. Irregardless, I took a starter position in CCJ, just in case.
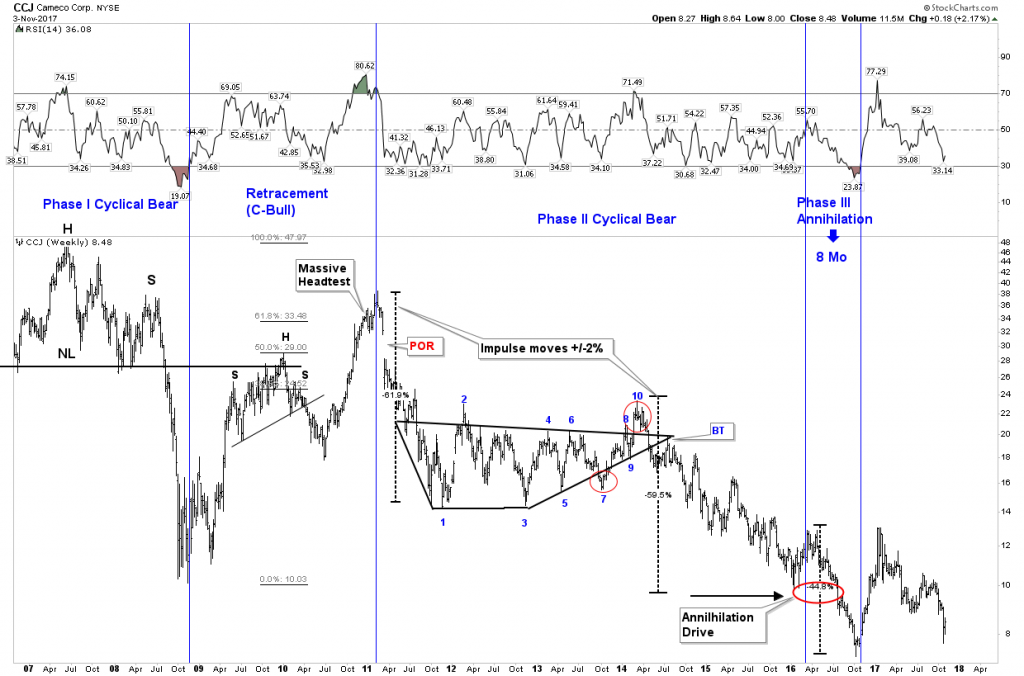
CCJ- What do they say about a second go at marriage…”The triumph of hope over experience”?
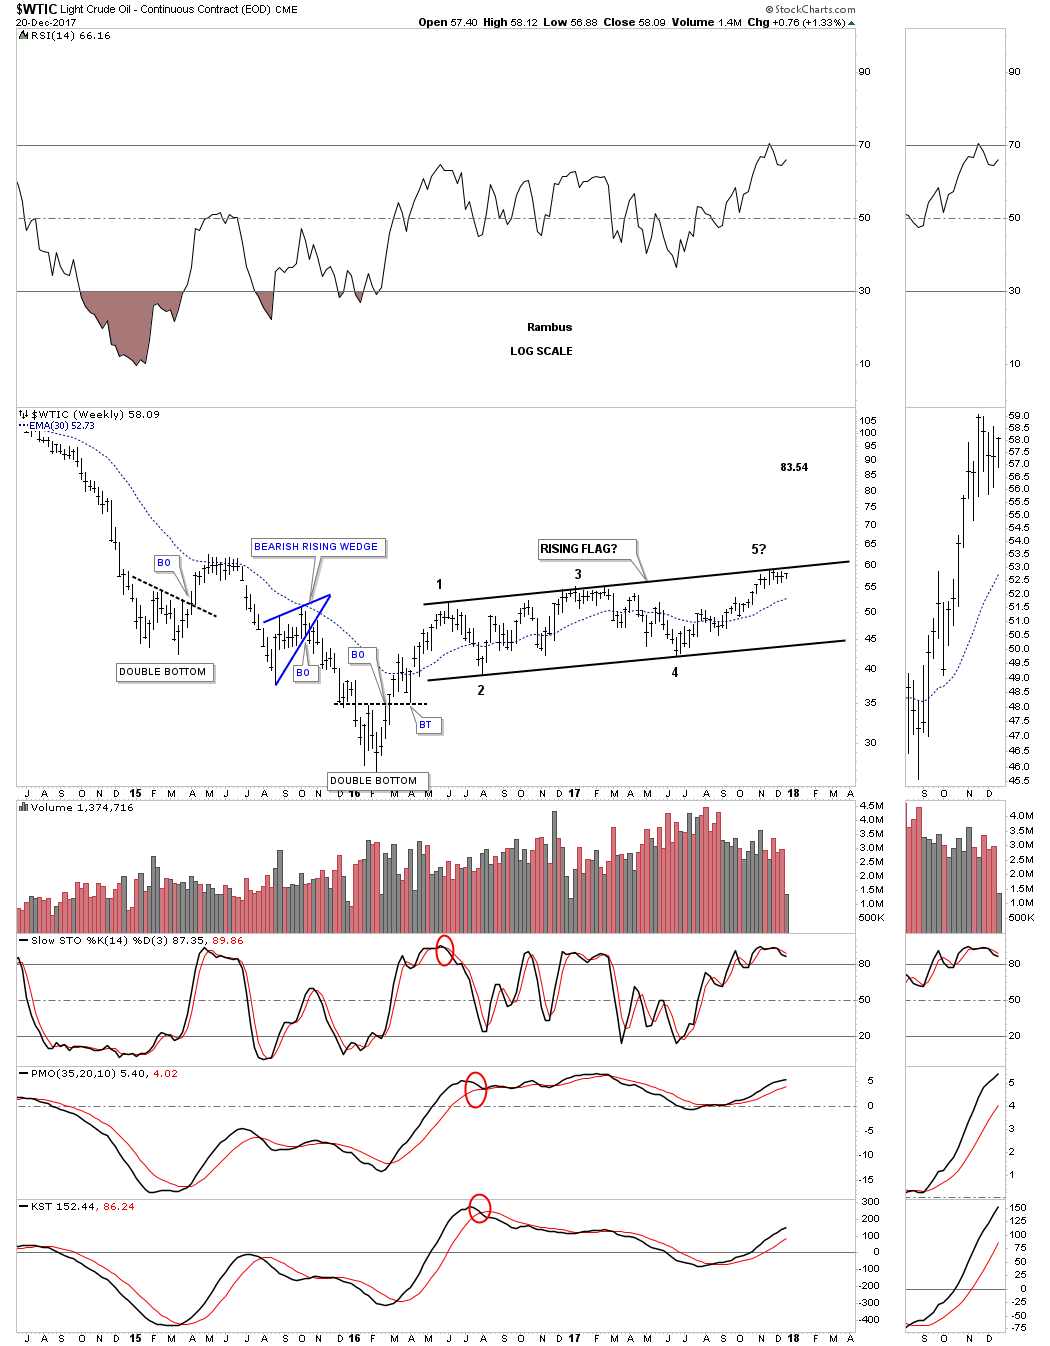
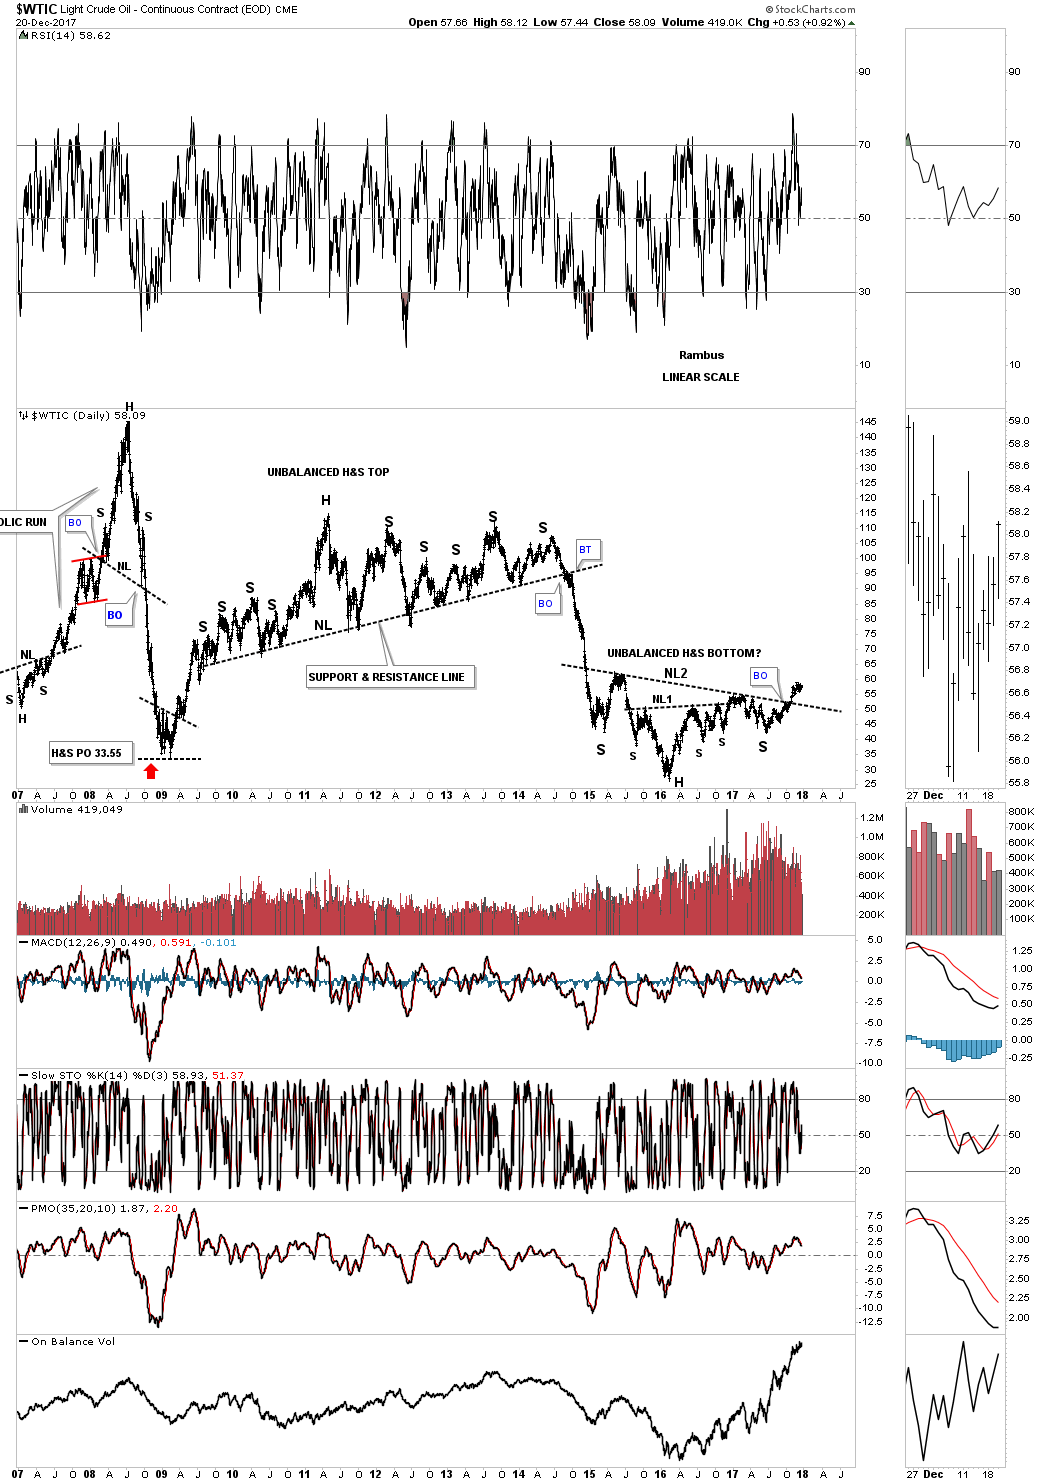
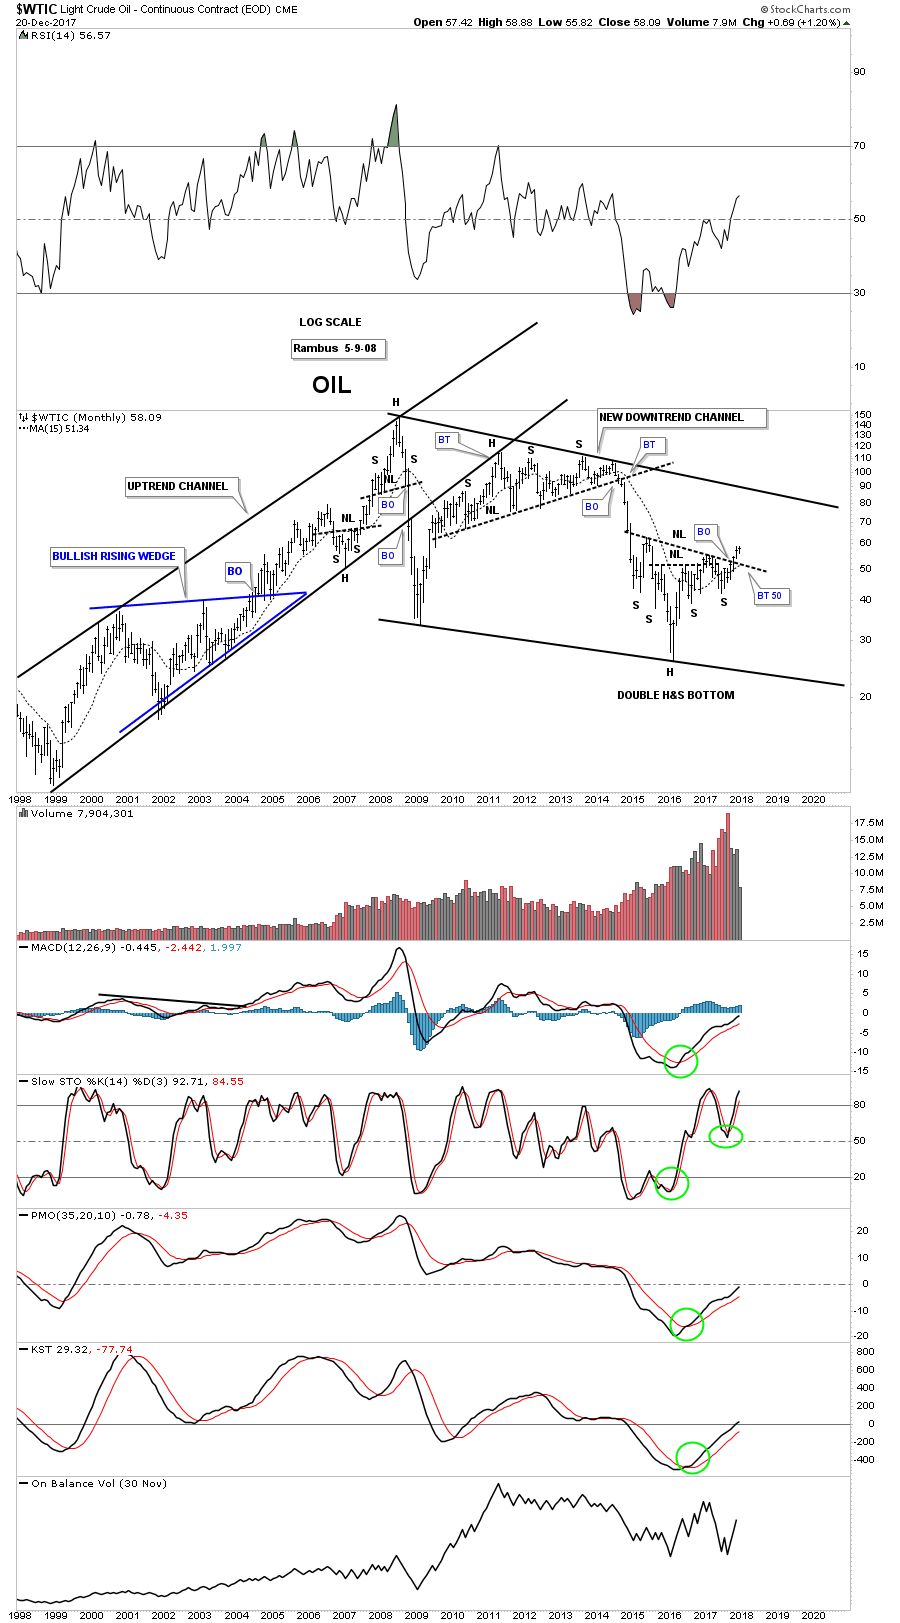
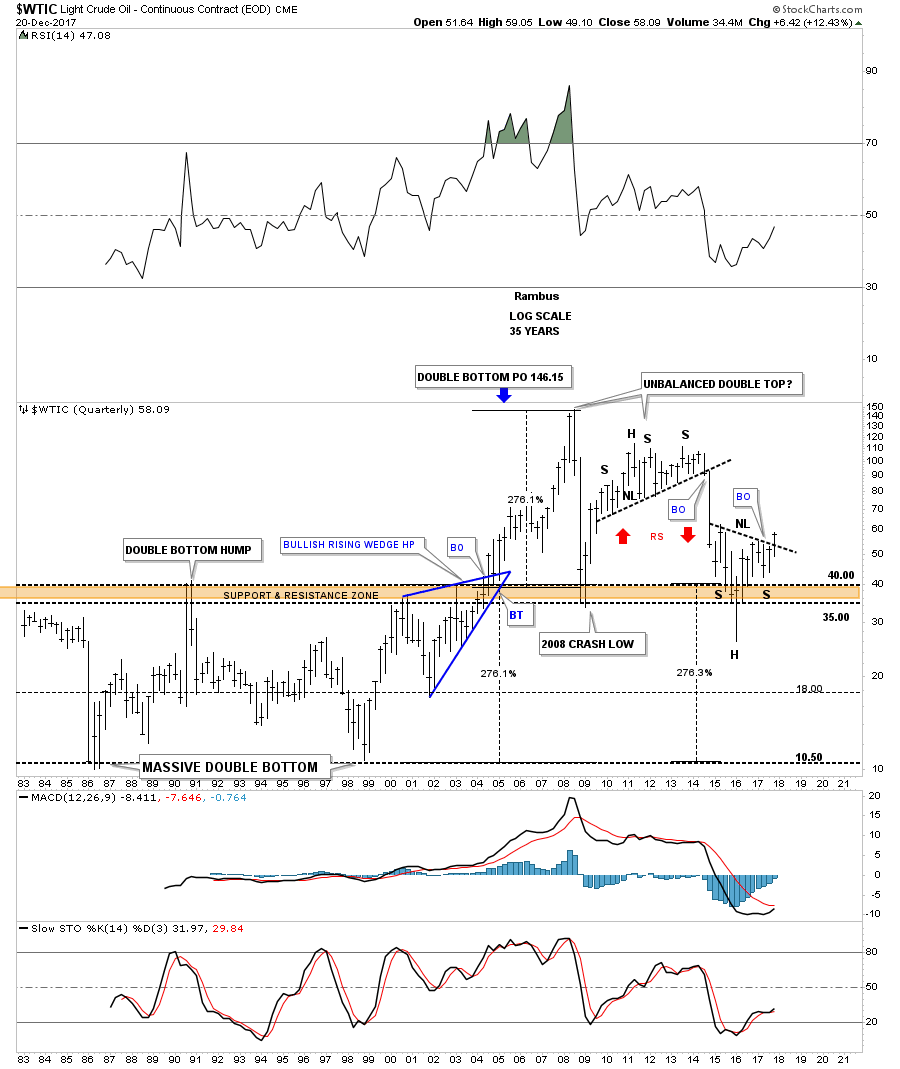
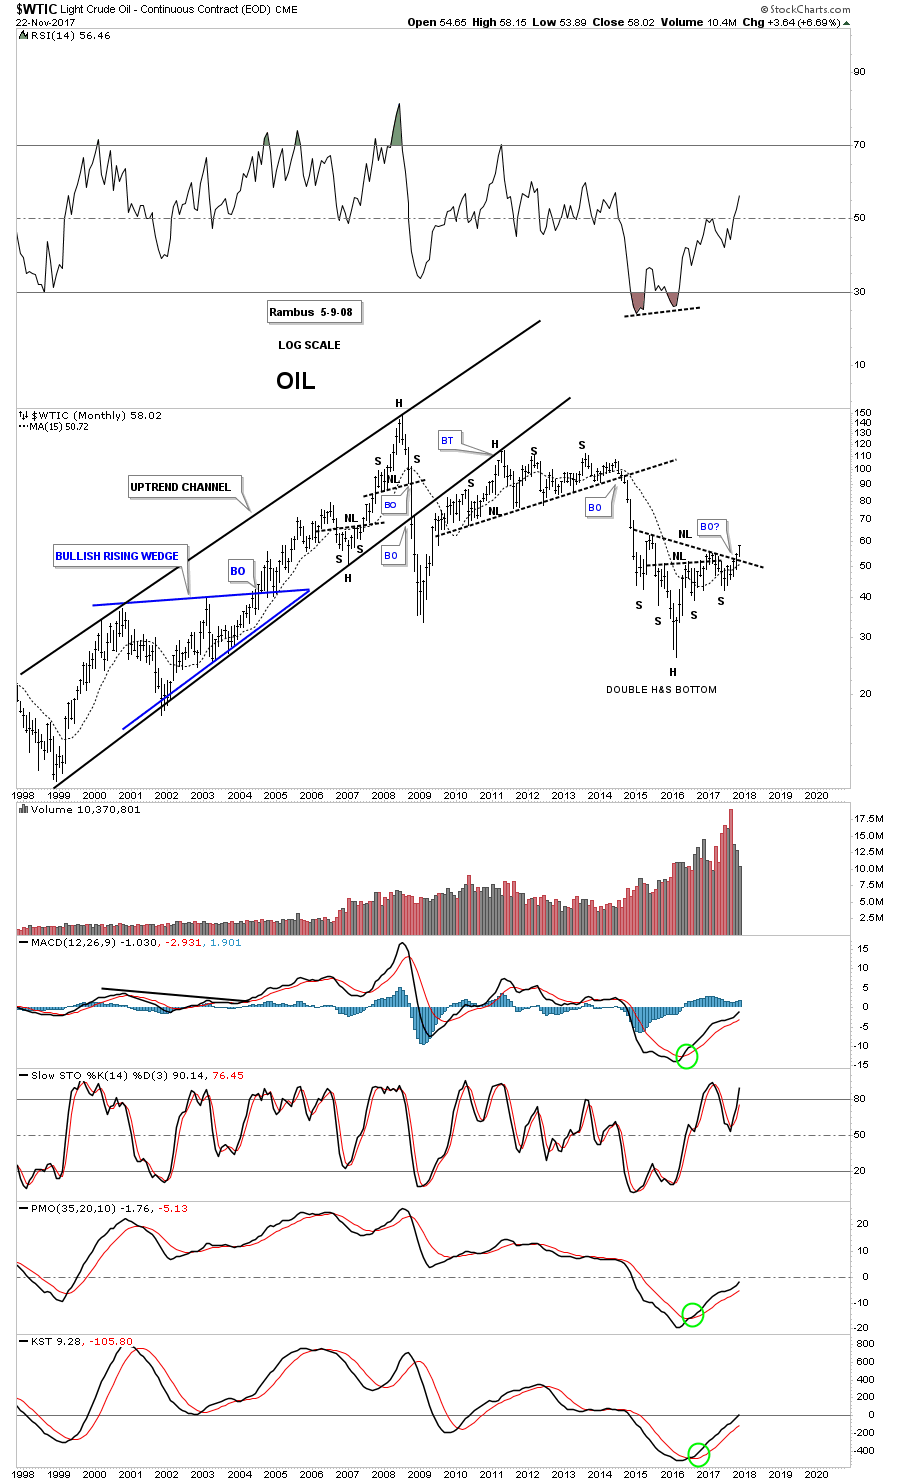
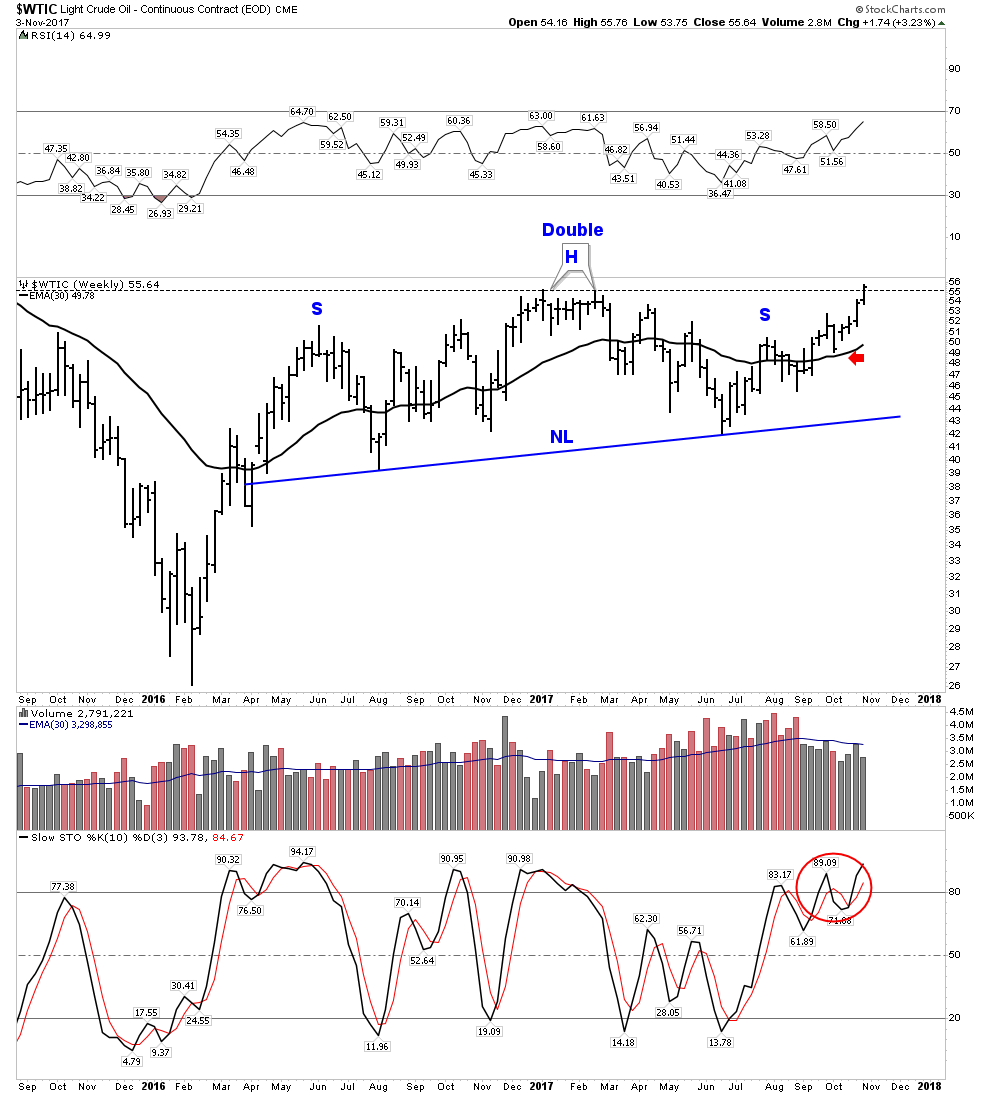
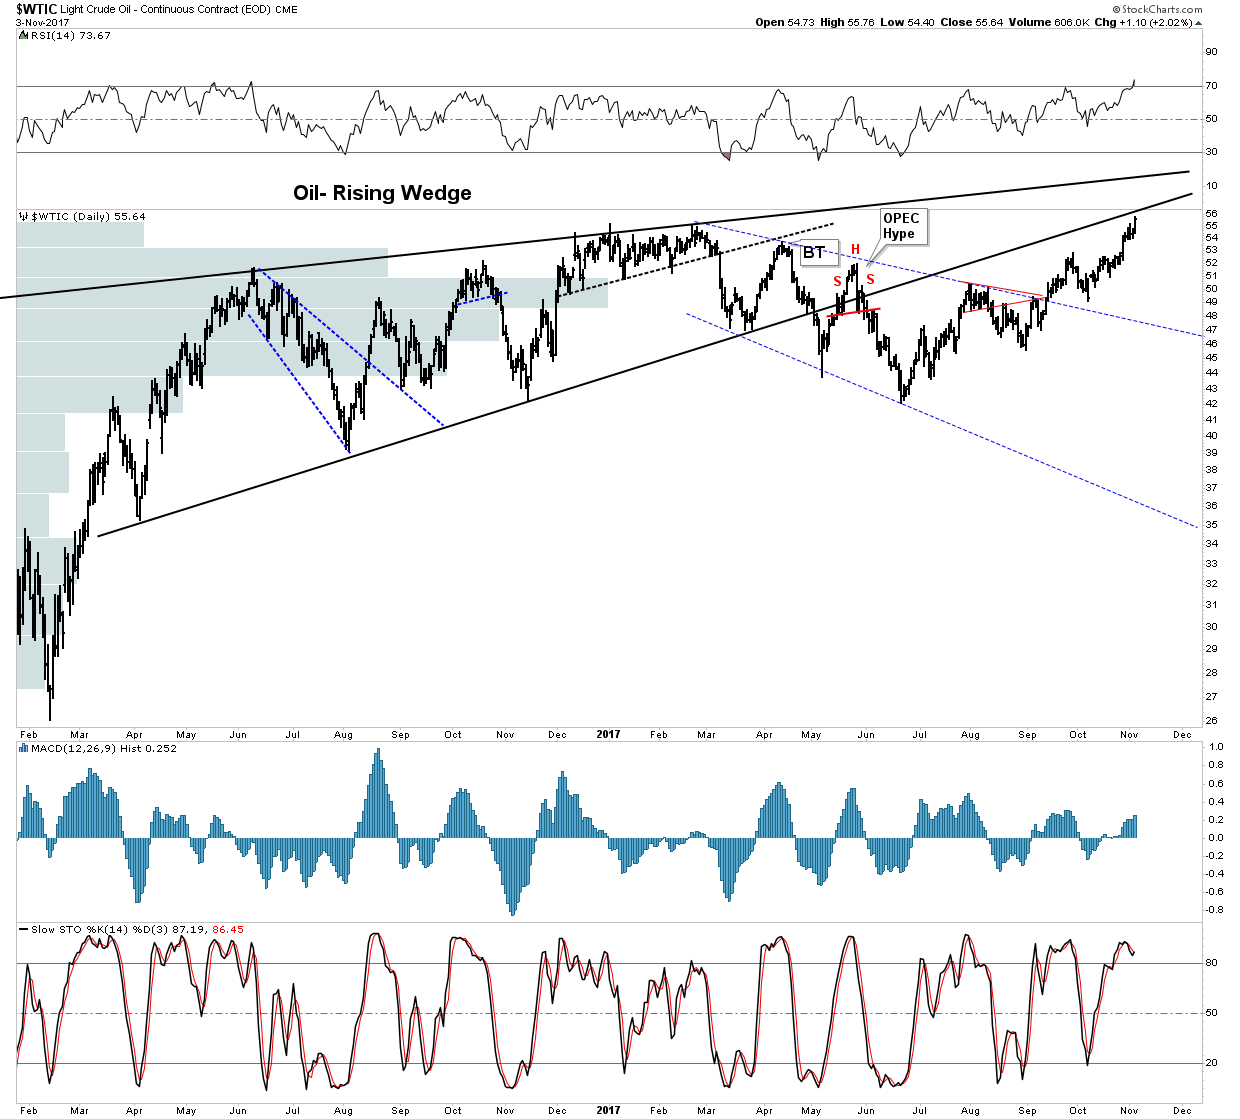
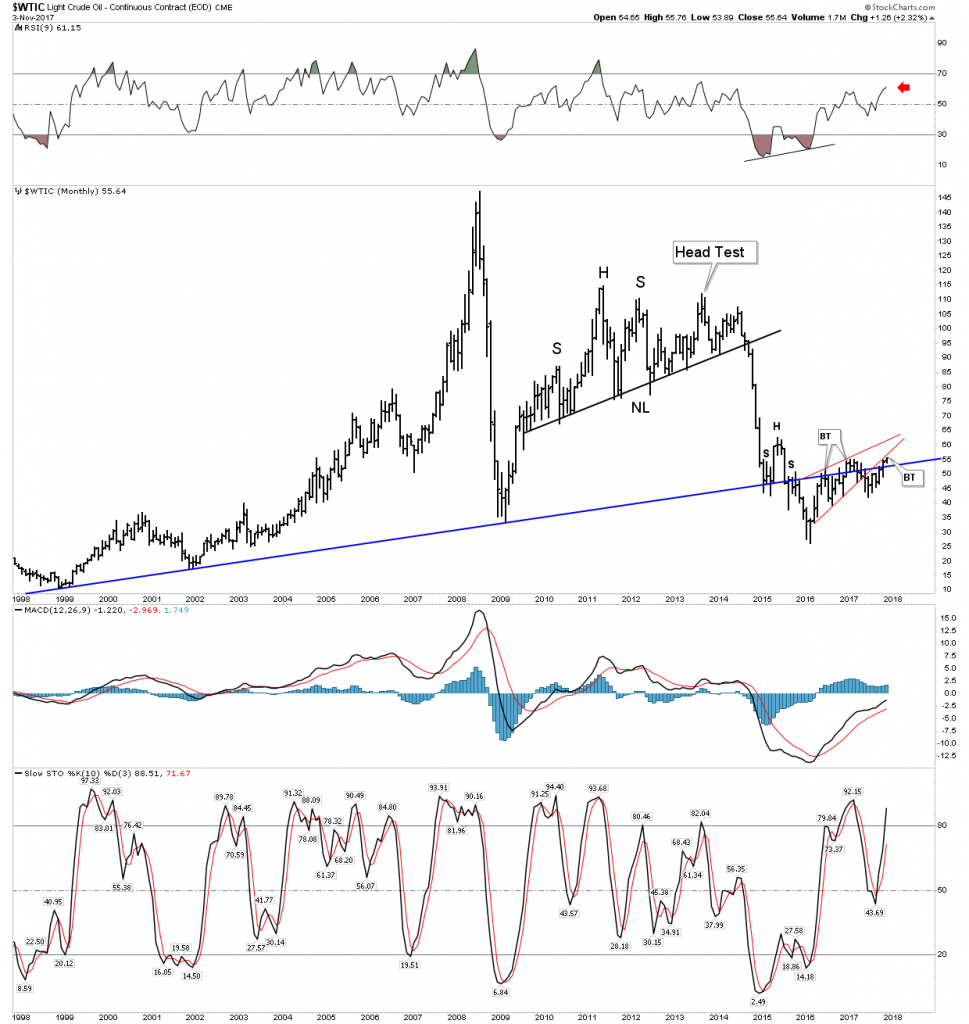
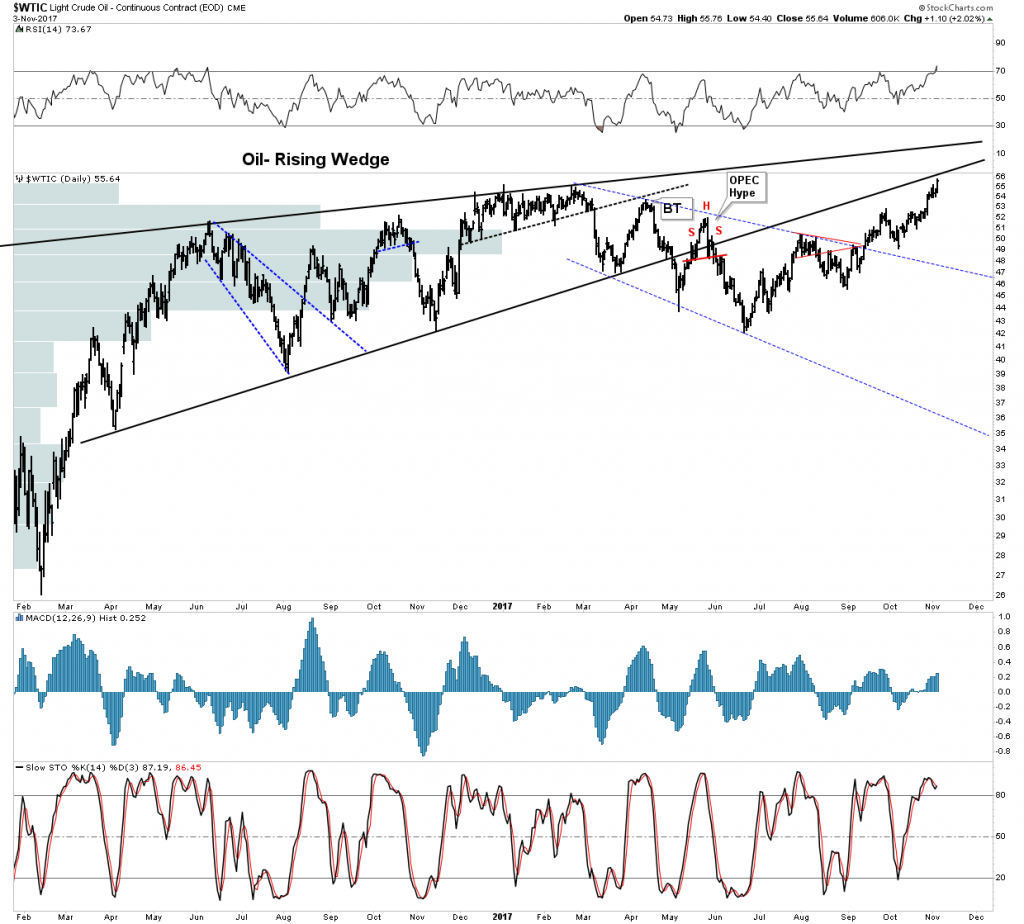
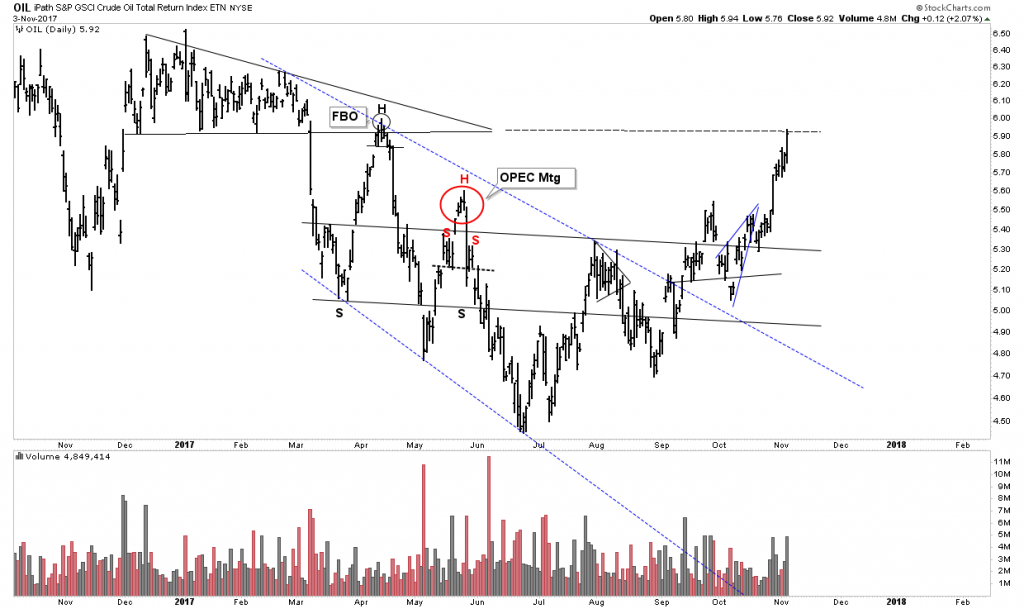
OIL- Solid Strength
Oil continues to power higher. Art Bermen has been the clearest voice as to why it continues higher and he thinks the move is not over. It has now reached the levels where I originally shorted it last February. It was a great trade, however it only made the initial move lower which I had anticipated. The charts and fundamentals still indicate to me that oil is in a secular bear market. The previous secular bear lasted 18 years, we are presently approaching 10 years in the current one. Clearly, the trend for now is higher, however once the next recession arrives the target in the low $30 range may be achieved, but for now I watch from the sidelines. When that time comes, it will be a heck of a trade.

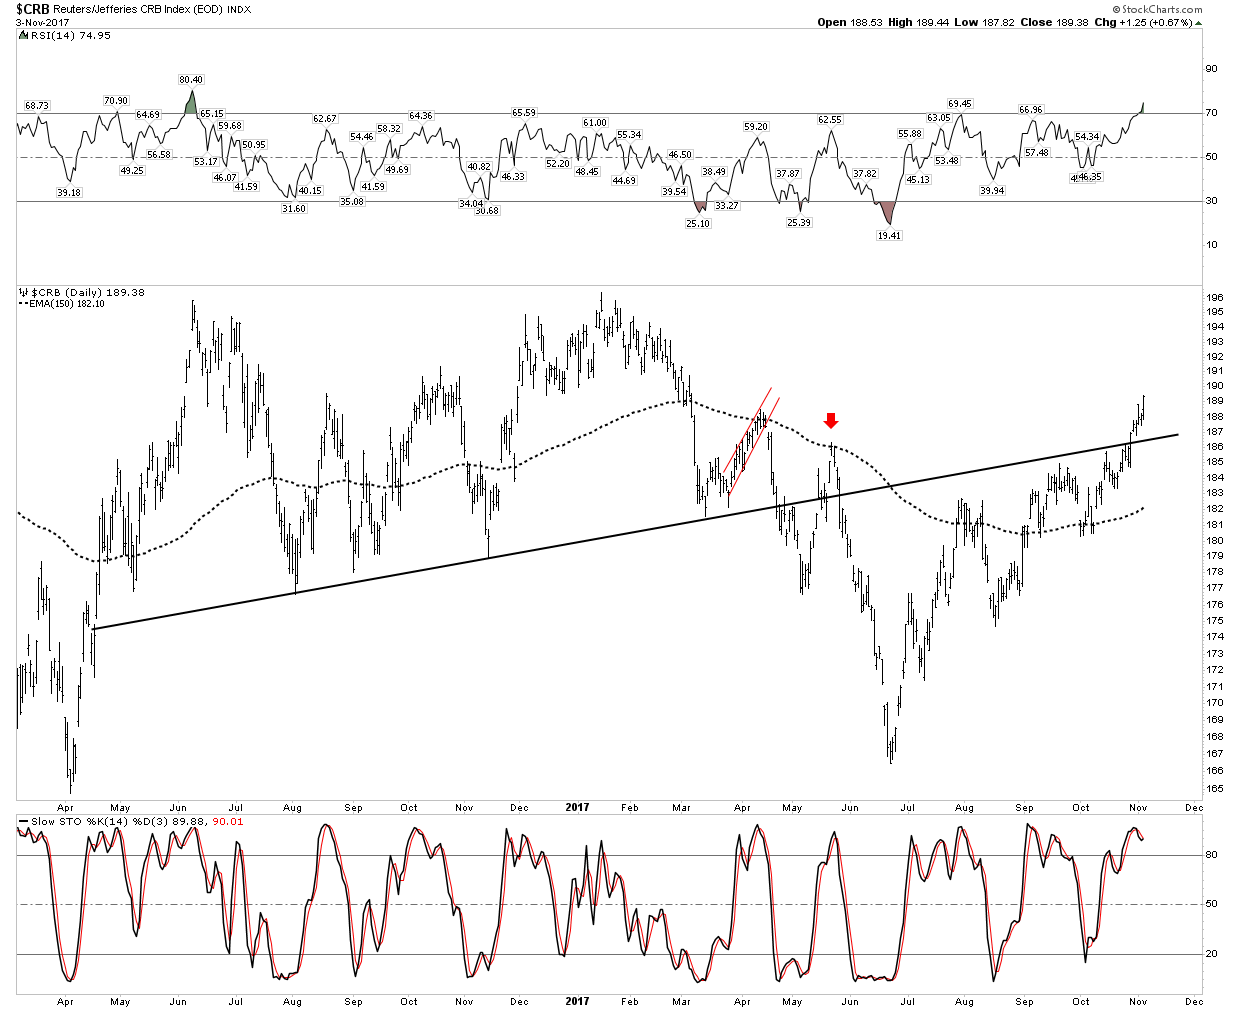
Commodities
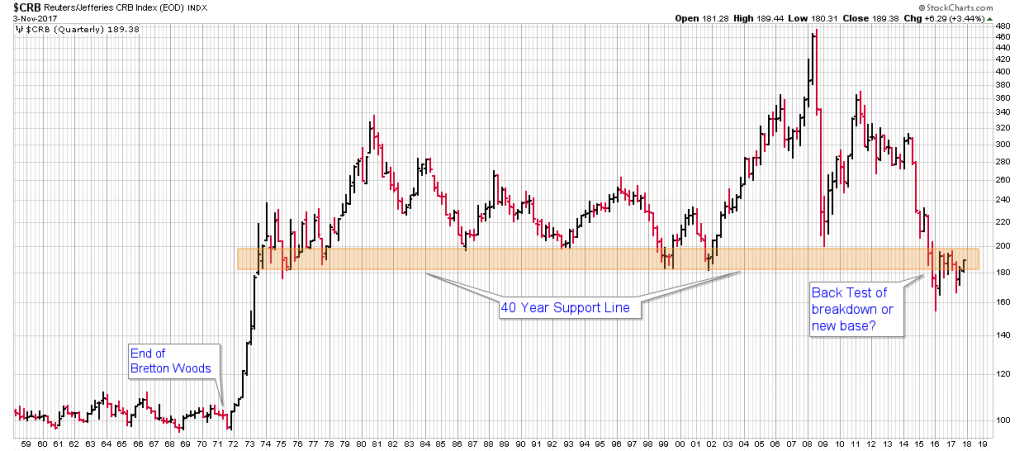
Commodities as a whole have now established an uptrend, despite the rising USD. Still some sectors such as the ags continue to wallow, but the liquid fuel component and lumber have powered the CRB above its NL.
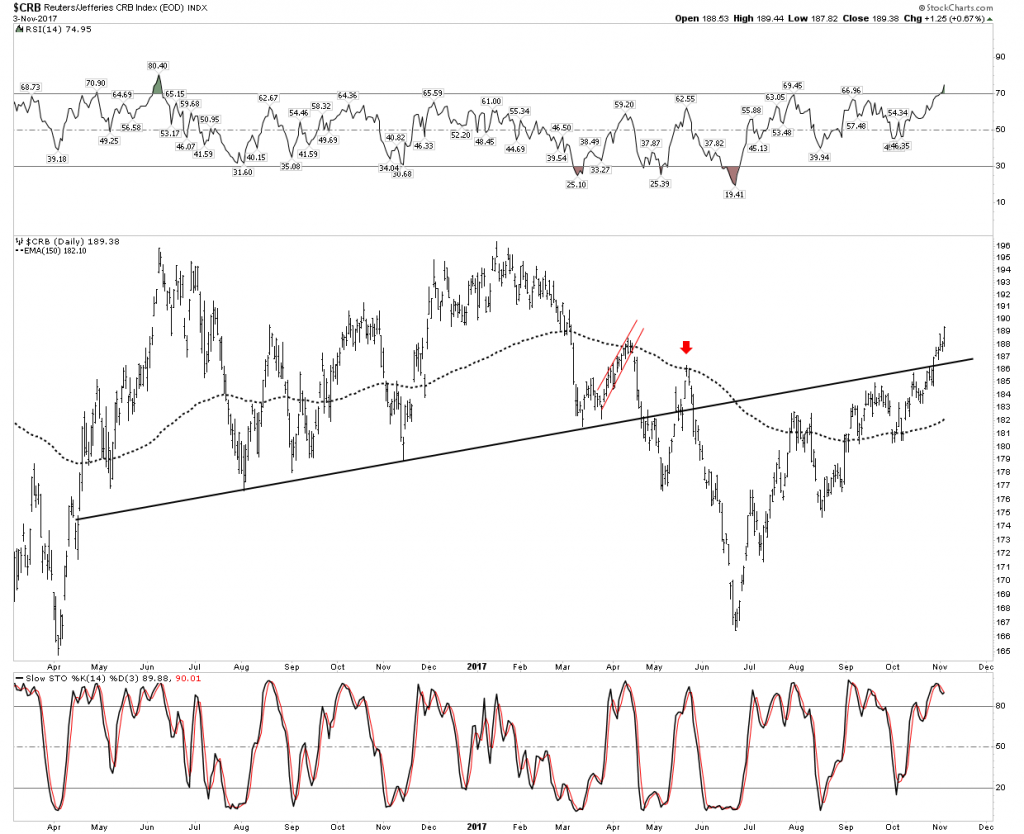
Viewed from the long term perspective however, commodities need to continue significantly higher, maybe another 10% to indicate a new price regime has been established:
Conclusion
The general markets continue to power higher with momentum firmly intact. If you are playing this sector you are making money, but be careful as numerous signs point to a top within 2-4 months. Meanwhile the PM sector is getting beaten up, but therein may lie the opportunity of a lifetime, especially now that we know the new FED chair is just another Brainless Keynesian who thinks there will never be any repercussions to endless money printing. Perhaps it’s time to take our eye off of the shiny object and buy what is real value, the precious and the electric metals.