accounts@rambus1.com
Category Archives: public
Notice to Subscribers
To make Charts Bigger :
click on chart to open in a new page
then click on chart again
Welcome New Subscribers
Dave (Rambus) is putting finishing touches on his latest report…stay tuned
Anybody having issues or questions with the subscription process e me at
gmag@primus.ca
Welcome Rambus Chartology’s First Yearly Subscriber
rlscott
an excellent chartist in his own right
you are now live rl…please log in again
Hello Everybody …we are close to operational
Please read the Registration Instructions on the right sidebar
2 Steps:
1…you register and are sent a password in 2 minutes
2…you pay a registration fee $29.99 a month Or $299 a year
Your Subscription will take effect within an hour ..often less
Your Subscription gives you access to:
1..All New Rambus Posts
2..Rambus Model Portfolio (Presently 12 Handpicked Junior Miners)
3..Rambus Stocks on Buy Signal (other PM Stocks and General Stocks with buy signals)
4..Weekend Reports
5..Stocks of the Week
6..Big Picture Charts
7..Timeless Tutorials and
Soon to be “Chartology Chat Forum”
………
problems logging in or paying ?…
gmag@primus.ca
…..
Its ALL Rambus with support from AuDept and Fullgoldcrown
We are Long Time Members of the Goldtent Community
www.goldtent.net
Goldtenters encouraged to log in with their Goldtent Handles
Official Opening target for Midnite tonite
Non Members still will see Public Rambus Posts from before this week and some occasional new publicly shared posts…and you are always welcome to come and visit and see whats new too …
2 Members who jumped the gun and registered are Live Now…
Billybob22 and havman…you are each on for 2 free weeks ..just log in
SSRI weekly stock review
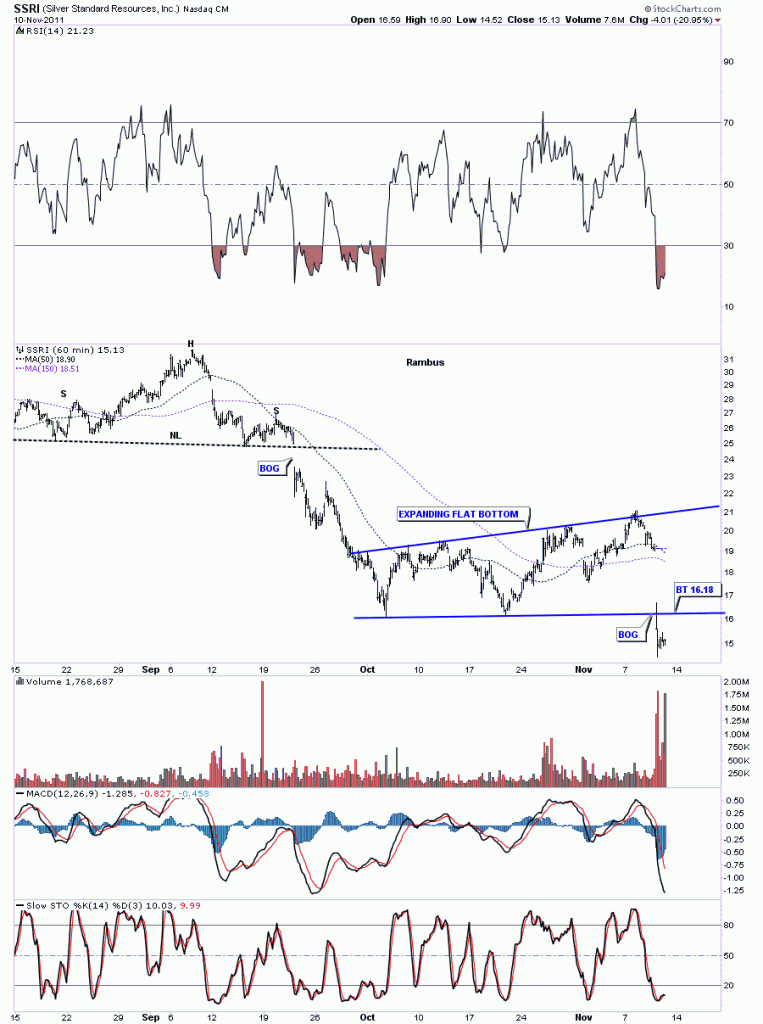
This weeks stock review comes from a new subscriber, flasinthepan, who is interested in SSRI as he’s been holding it for sometime now. Today’s action was not pretty as the stock gaped down 2 points on the opening and didn’t look back. The pattern on the 60 minute chart broke down from an expanding flat bottom triangle. The breakout came on extremely heavy volume giving investors little chance to get out.
SSRI 60 minute breakout.
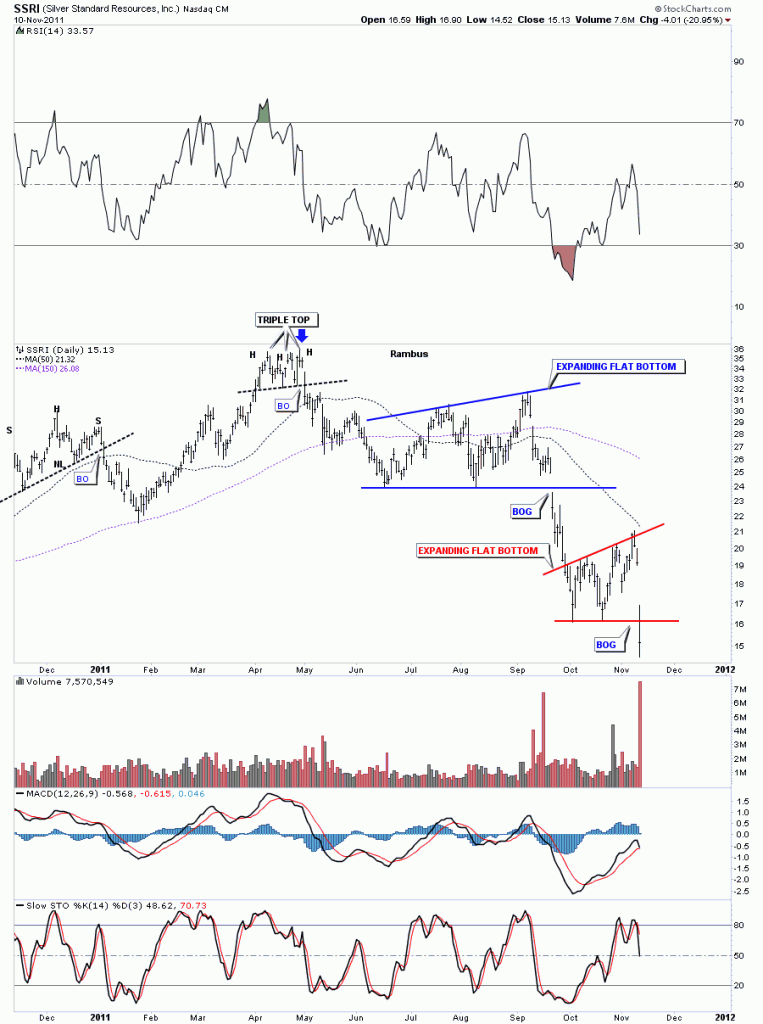
The daily look is just as ugly as the 60 minute. Note the blue expanding flat bottom triangle that formed just above our smaller one. The thing about either a flat top or flat bottom pattern is that the breakout usually occurs thru the flat horizontal rail. This stock has been cut in half since it hit it’s high back in April – May of this year. Notice the big gaps that accompanied each breakout from the expanding flat bottom triangles. Also note today’s volume spike.
SSRI daily expanding flat bottom breakout.
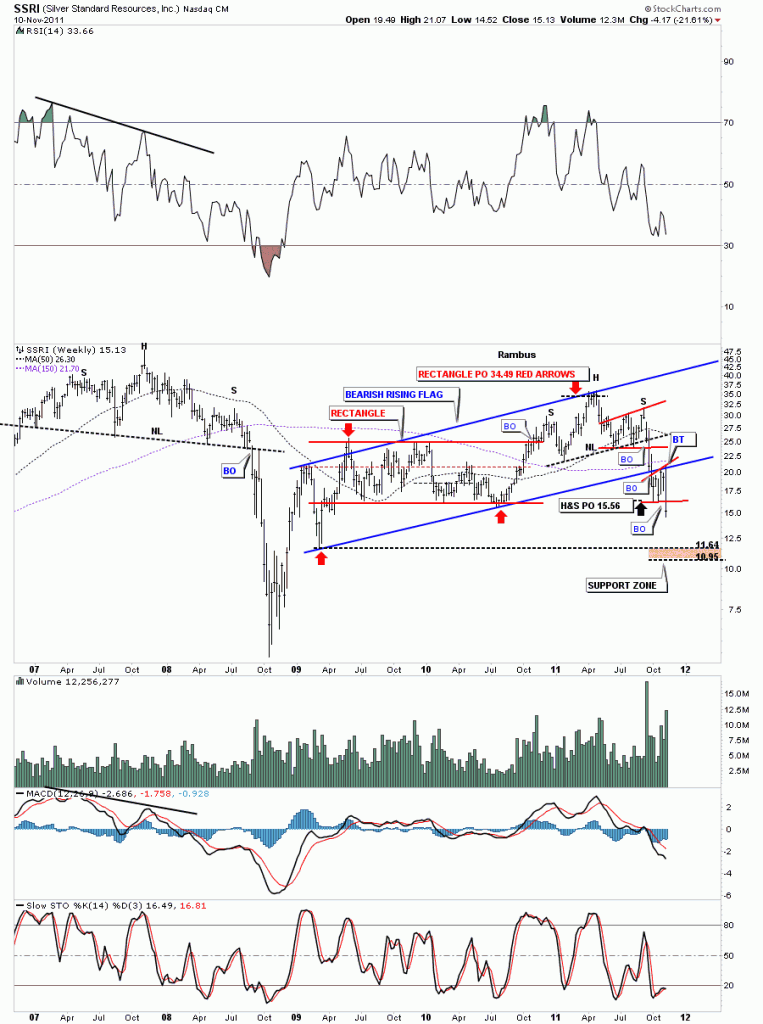
The weekly looks paints an even more bearish picture for SSRI. Notice the big blue rising flag that is made up of a rectangle and a H&S top formation. The expanding flat bottom on the daily look is the right shoulder. That H&S top projected down to 15.56 which was below the bottom blue rail of the rising flag. That was your first clue that SSRI might be in trouble. Next notice the backtest which stopped right at the blue bottom rail and was the top of our latest expanding flat bottom. Again another important clue that SSRI was not acting like it should if it was in a bullish phase. I’ve added a brown support zone where the decline may run into some support.
SSRI weekly bearish rising flag.
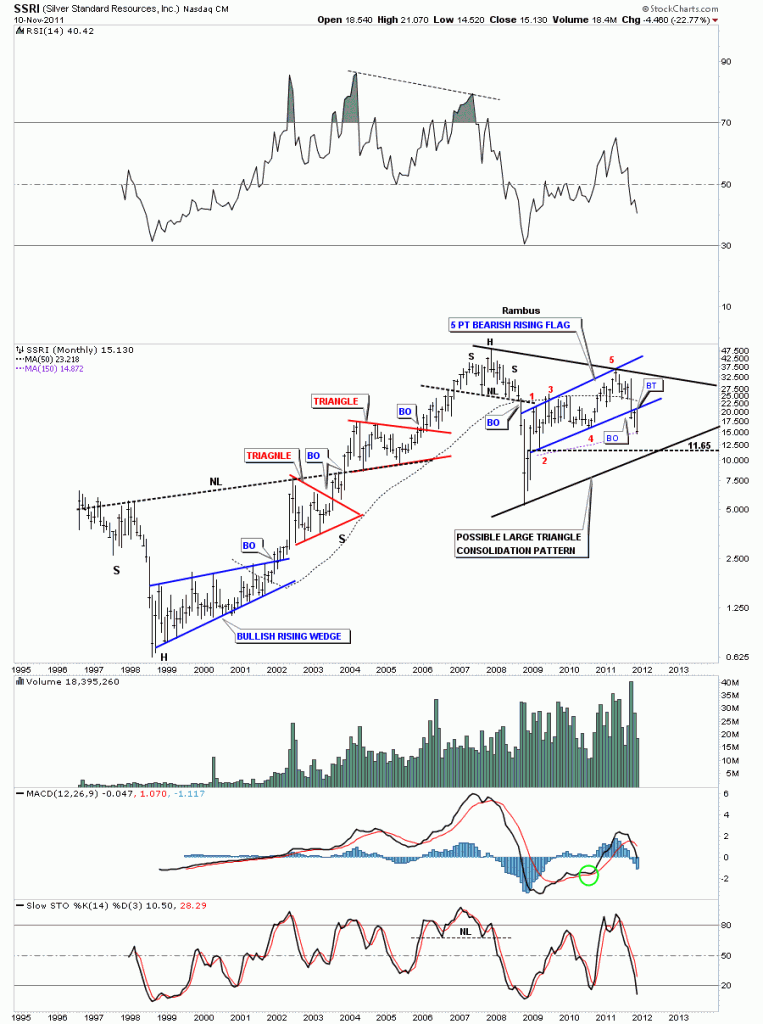
The monthly look shows all of SSRI’s history going all the way back to 1997. Please note the bearish rising flag has 5 reversal points making the rising flag a reversal pattern. As bearish as the monthly chart looks there is an outside possibility that the whole area from the 2008 high and wherever the eventual bottom is could end up being a huge triangle consolidation pattern, black rails.
SSRI monthly look.
Bottom line with the precious metals stocks is that they are all over the place right now. Some are close to all time highs some are in the middle of their big trading range and some like SSRI, AEM and TRX are breaking down. It pays to keep a close eye on any precious metals stock you are holding. What you don’t want to see is it breaking a support zone like the chart of SSRI did today. Even if you had a sell/stop in place, on the daily chart, chances are today’s gap may have gaped over your sell/stop leaving you still in the game when you might not want to be. The only rule in the stock markets is “THERE ARE NO RULES”.All the best flashinthepan. Rambus
DOW Capitulation Yesterday
In yesterday’s post, on the Dow, I said I was looking for another backtest to the 11,600 area that was the breakout point of the double bottom. It felt like the world was ending yesterday with all the news on how bad things are around the world. Whenever sentiment gets like that its time to put on your blinders and ear muffs and look to the charts for clues which are unemotional. Its the chartists that is the emotional part of the equation. Yesterday’s big down day was fairly rare in terms of down to up volume. The chart below shows just how panicked investors were. Whenever investors panic like yesterday they throw the baby out with the bathwater and then some realize, after the fact, what did I just do. Now when the markets turn backup they will be sitting on the sideline consumed with fear and will wait for the all clear signal to get back in again which will be at higher prices. Yesterday’s capitulation spike in, down to up volume, was the 3rd such spike since the bottoming process started in August. Also note the 2010 bottom also had 3 capitulation spikes that showed up during it’s bottoming process. Where yesterday’s capitulation spike was formed was perfect in that it came on the backtest that was much higher than the lows of the double bottom. Sometimes the down to up volume will mark the low and sometimes it will come as part of the bottoming process. So the bottom line is the 11,600 backtest point is still in play and with yesterday’s capitulation spike the odds go up that it will hold. Watch the 11,600 closely
Dow down to up volume capitulation spike.
HUI update
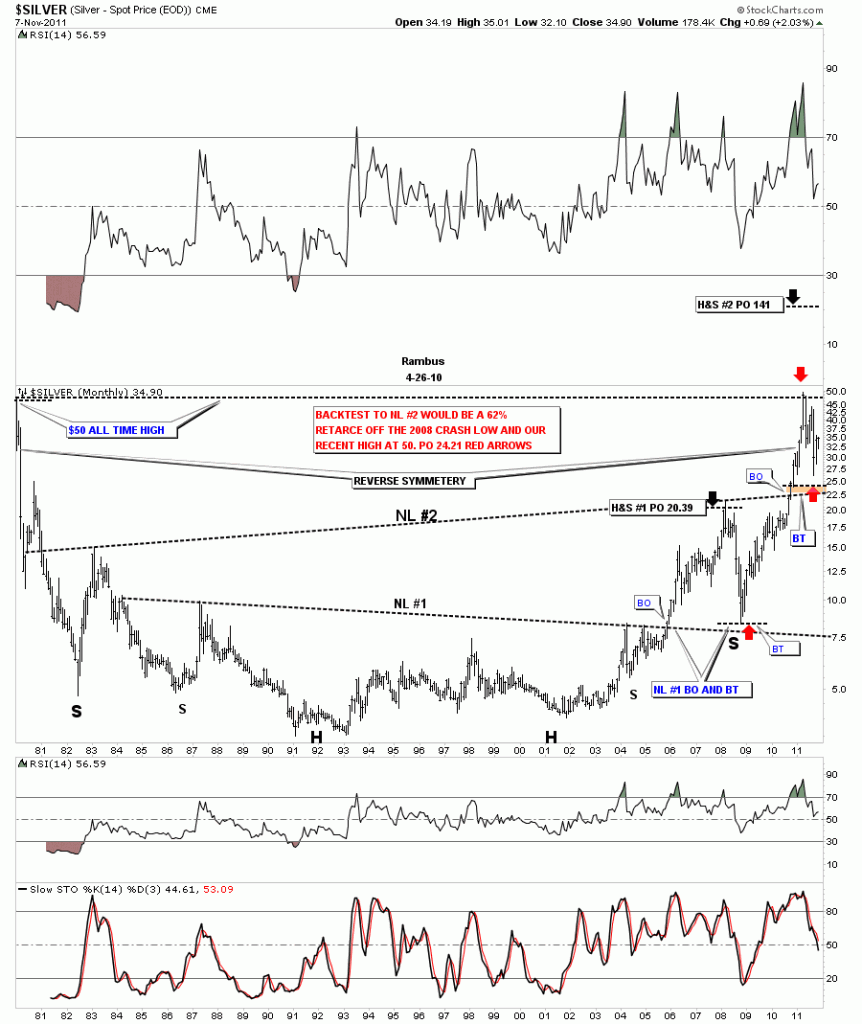
Silver long term 30 year look
In the weekend report I showed a 30 year long term look at gold so you could see the big base that launched it’s bull market. Silver’s huge base is just as impressive as golds. On the chart below the first thing you will notice is the two H&S patterns that formed the almost 30 year base. I’ve labeled the two H&S patterns as Neckline #1 and neckline #2. The lower or smaller H&S base reached it’s price objective of 20.39 just before everything crashed in 2008. During the crash silver found support just above it’s neckline which qualified as the backtest. That crash low in 2008 also created the right shoulder of the much bigger H&S base, NL #2. The rally sliced right thru the NL #2 like butter until it hit 50. Again, like the smaller H&S #1, the price corrected all the way down to just above NL #2, close to the 62% retrace, red arrows on chart below. That also qualified as the backtest IMHO. The brown area on the chart shows where I was looking for the backtest to stop and just like the lower H&S neckline #1 the backtest stopped just short of a full test all the way down to the neckline. Close enough for government work. The big #2 H&S base has a price objective all the way up to 141.
Silver 30 year base with two H&S patterns

