PM Ratio Charts (STUNNING) Story

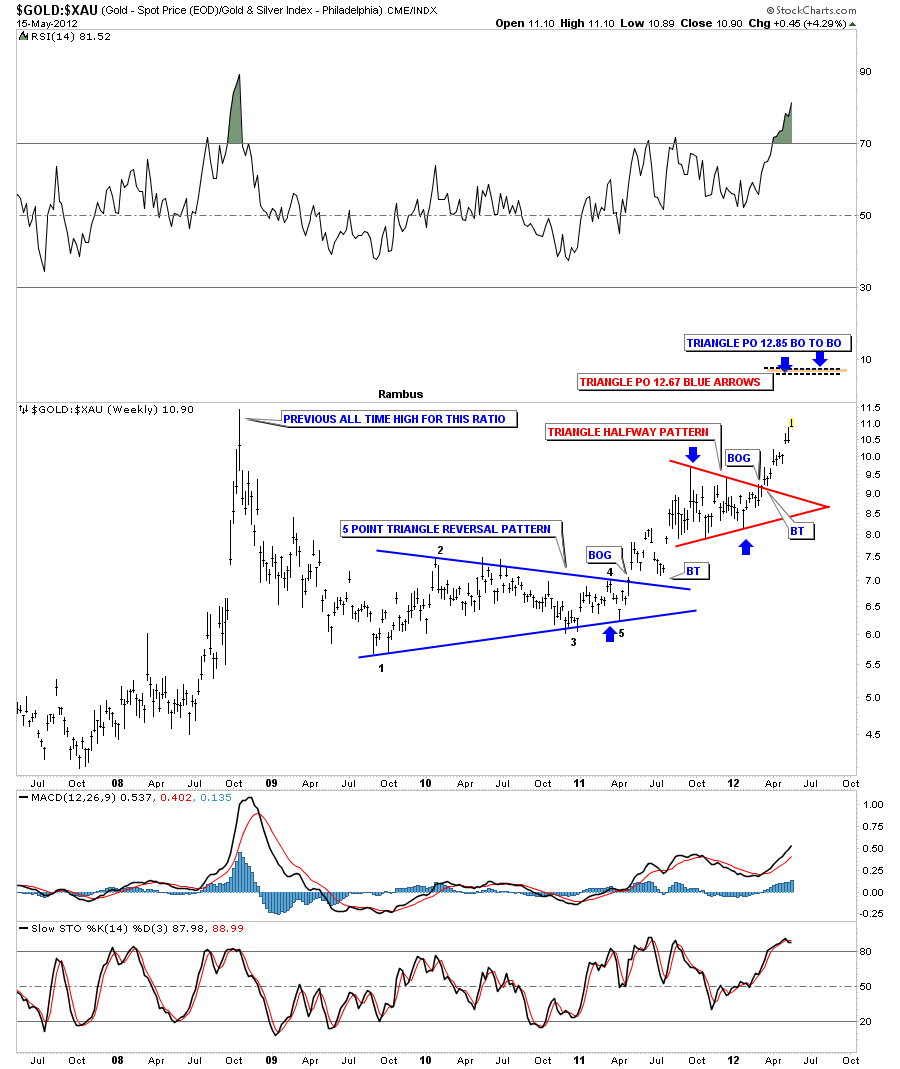
The gold to XAU ratio chart is showing we are approaching the all time high made back in 2008. That was a spike high that reversed almost immediately and signaled the bottom was in for the precious metals stocks. On the chart below you can see we have a different setup as we approach that all time high this time.

As you can see on the chart above the ratio bottomed out with a 5 point triangle reversal pattern to the upside. The ratio then went on to form a red triangle consolidation pattern that broke out to the upside about three months ago. If we view that red triangle as a halfway pattern the price objective comes in around the 12.80 area based on two different measuring techniques I use. So even though this ratio is at an extreme it looks like it wants to go higher IMHO.

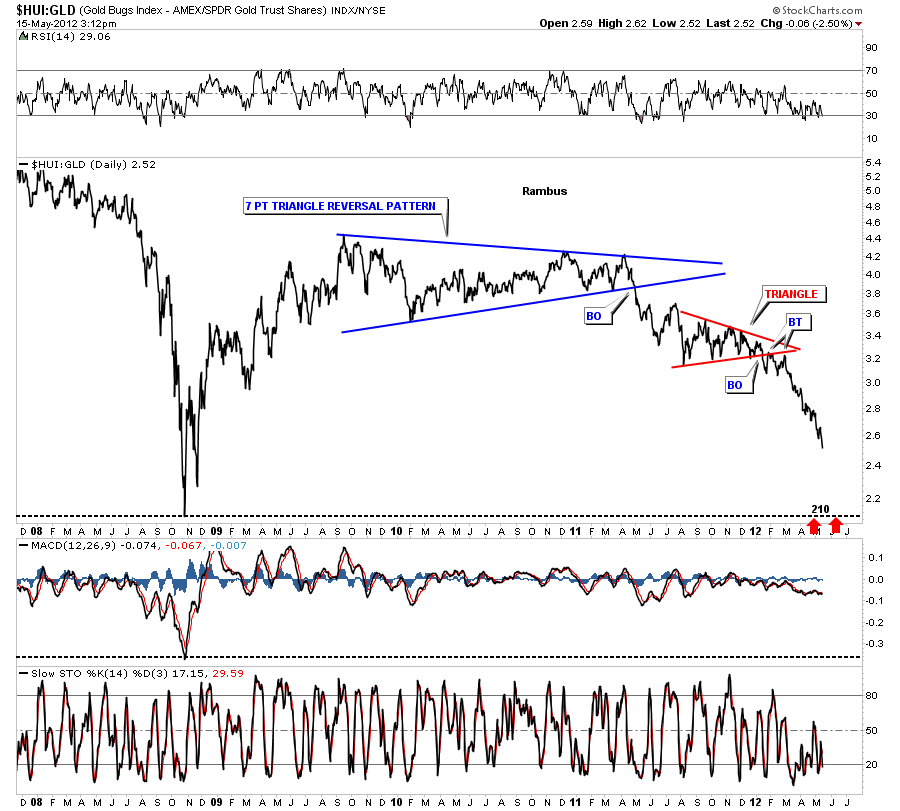
Below is a daily look that shows the HUI:GLD ratio chartĀ  still has a ways to go yet before we test the 2008 crash lows down at 210. I mentioned several months ago that I thought that the PM stocks were accelerating to the downside relative to gold. This has been the case as the chart below shows.

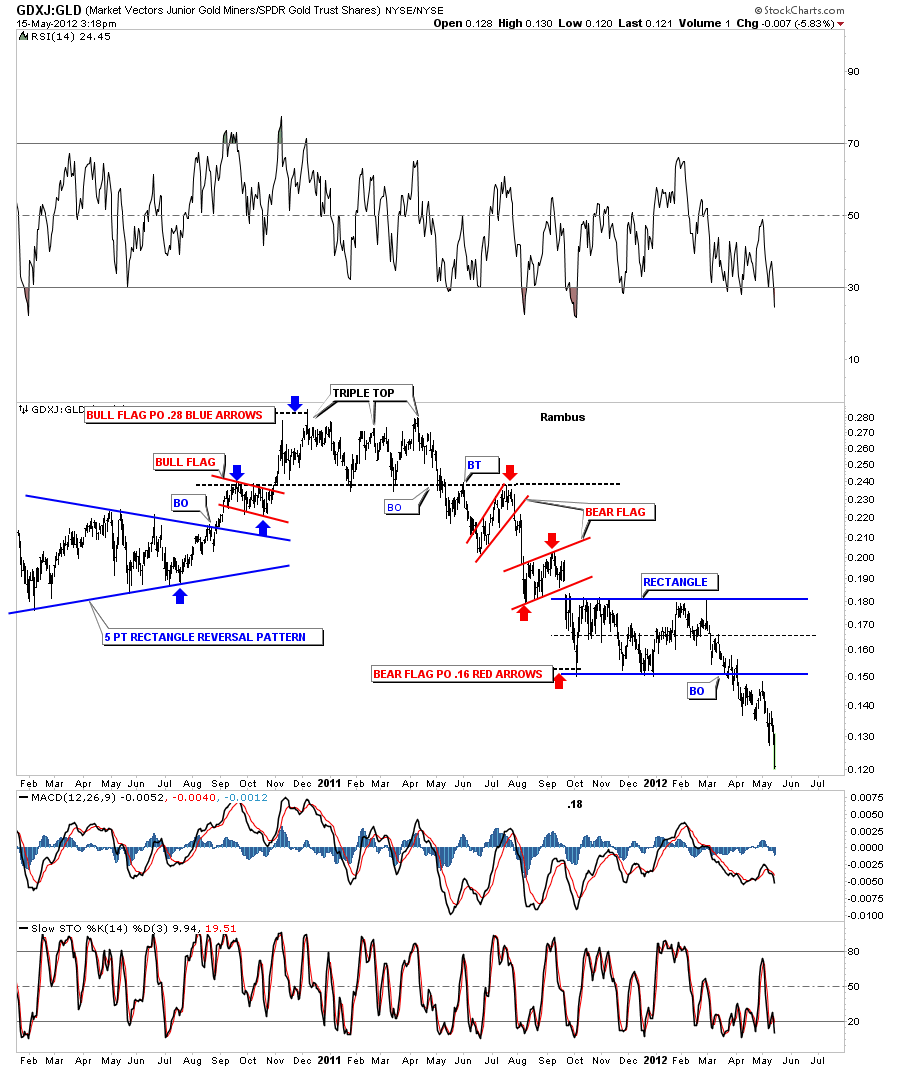
The GDXJ:GLD really shows the little juniors plunging against GLD after completing a rectangle consolidation pattern.

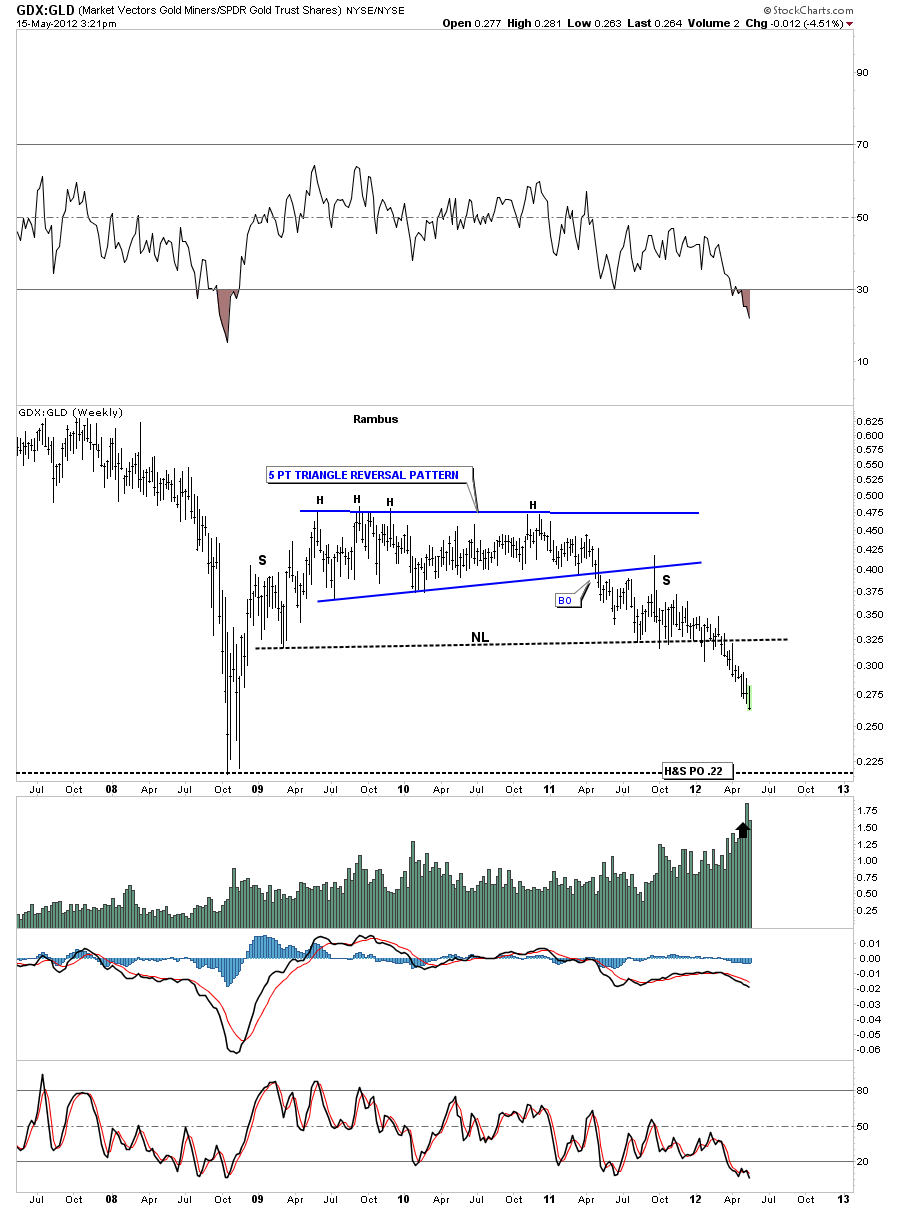
I can make a case for a big H&S top pattern with the weekly GDX:GLD ratio chart that shows there is still some more room to move lower before we reach the crash low of 2008. Although the PM stocks seem to be oversold compared to gold there is still room to move down before we reach the 2008 panic lows. Note the price objective that measures down to the 2008 bottom.

 

UUP Update

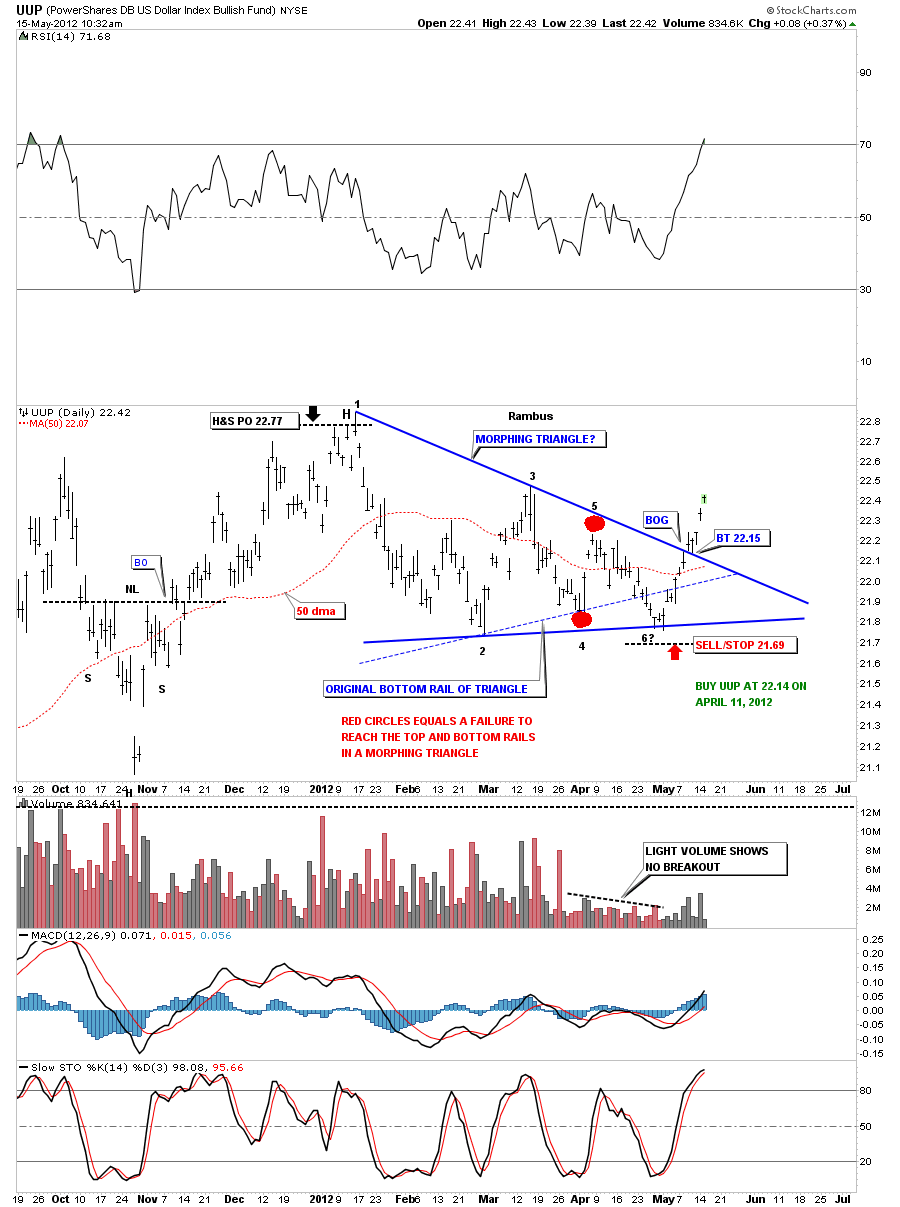
Just a quick update on the morphing triangle that we have discussed previously. As you can see on the chart below it all worked out according to plan. Most Technically Analysis were watching that thin dashed blue bottom rail of the original triangle and when UUP broke below it they turned bearish on the dollar. This was the fake out before the breakout. Once we got back above theĀ  blue dashed rail of the original triangle the top rail came into play that was the next objective to conquer. Note how clean the breakout and backtest was. That was about as pretty as it gets. Now the UUP – Dollar is in rally mode that will put pressure on just about everything else for the time being.

………………………………………………………..
EDITOR’S NOTE :

Rambus Chartology is Primarily a Goldbug TA Site where you can watch Rambus follow the markets on a daily basis and learn a great deal of Hands on Chartology from Rambus Tutorials and Question and Answeres .

Most Members are Staunch Goldbugs who have seen Rambus in action from the 2007 to 2008 period at www.goldtent.org and now Here at Rambus Chartology since early 2012 .

To review his Work and incredible calls from the 2007-2008 period click on the top right sidebar Deja Vu

To Follow Rambus Unique Unbiased Chart Work and participate in a Chartology Form with questions and answeres and learn the Art and Science and Mindset of a Pro Trader please Join us by subscribing monthly for $29.99 at

www.rambus1.com

We have many subscribers from all over the world who are glad they did as they enjoy the many daily updates and commentaries provided at this exciting new site

As you will see Rambus (Dave) has prepared us for this difficult period by being one of the only ones to see and warn about this incredibly debilitating PM smackdown

You will find Rambus to be a calm humble down home country tutor with an incredible repitoir of all the TA based protocols tempered with his own one of a kind style…simply put…He wants to keep his subscribers on the right side of these crazy volitile and downright dangerous markets

See you at the Rambus Chartology

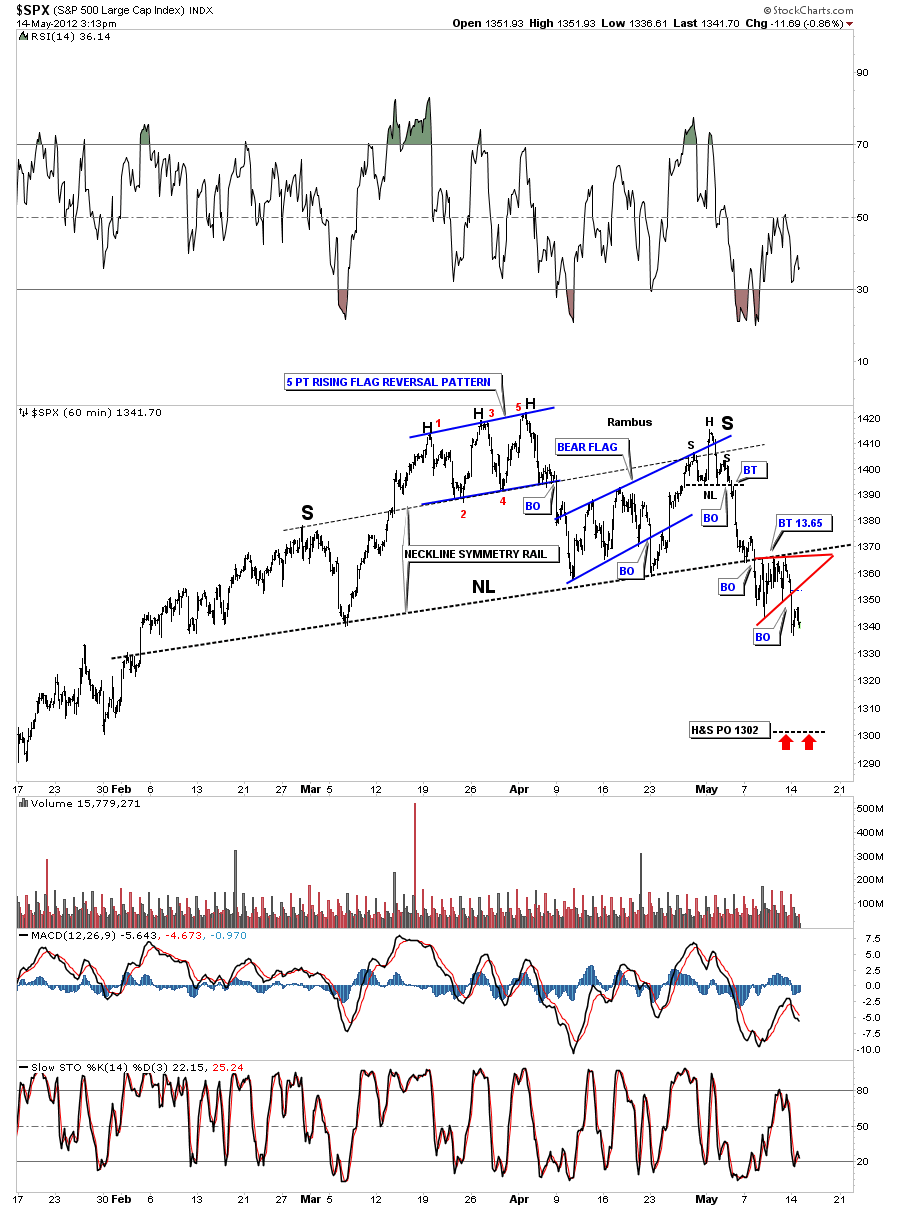
SPX Update

Just a quick update on the 60 minute chart of the SPX. Last Friday I showed the little red triangle that was forming just beneath the neckline. Whenever you get a little consolidation pattern that forms just above, just below or sometimes right on a critical trendline that is usually a bearish setup in our current instance.

EDITOR’S NOTE :

Rambus Chartology is Primarily a Goldbug TA Site where you can watch Rambus follow the markets on a daily basis and learn a great deal of Hands on Chartology from Rambus Tutorials and Question and Answeres .

Most Members are Staunch Goldbugs who have seen Rambus in action from the 2007 to 2008 period at www.goldtent.org and now Here at Rambus Chartology since early 2012 .

To review his Work and incredible calls from the 2007-2008 period click on the top right sidebar Deja Vu

To Follow Rambus Unique Unbiased Chart Work and participate in a Chartology Form with questions and answeres and learn the Art and Science and Mindset of a Pro Trader please Join us by subscribing monthly for $29.99 at

www.rambus1.com

We have many subscribers from all over the world who are glad they did as they enjoy the many daily updates and commentaries provided at this exciting new site

As you will see Rambus (Dave) has prepared us for this difficult period by being one of the only ones to see and warn about this incredibly debilitating PM smackdown

You will find Rambus to be a calm humble down home country tutor with an incredible repitoir of all the TA based protocols tempered with his own one of a kind style…simply put…He wants to keep his subscribers on the right side of these crazy volitile and downright dangerous markets

See you at the Rambus Chartology