This content is for Yearly and Monthly members only.
Subscribe
Subscribe
Already a member? Log in here

Below is an updated chart of the gold chart I promised you. I don’t see a gap but it definitely broke the bottom rail of the rectangle and also the all important 300 dma. The bottom of the rectangle will now act as resistance on any backtest at 1626. Notice how long today’s bar is vs the ones inside the rectangle consolidation. That’s what I like to see on a breakout, a nice long bar.
The chart below shows the 10 year bull market for gold and the 300 dma. You can see how impressive the 300 dma has been. Today’s move is out of character for the 300 dma and one should pay close attention to what it maybe saying.
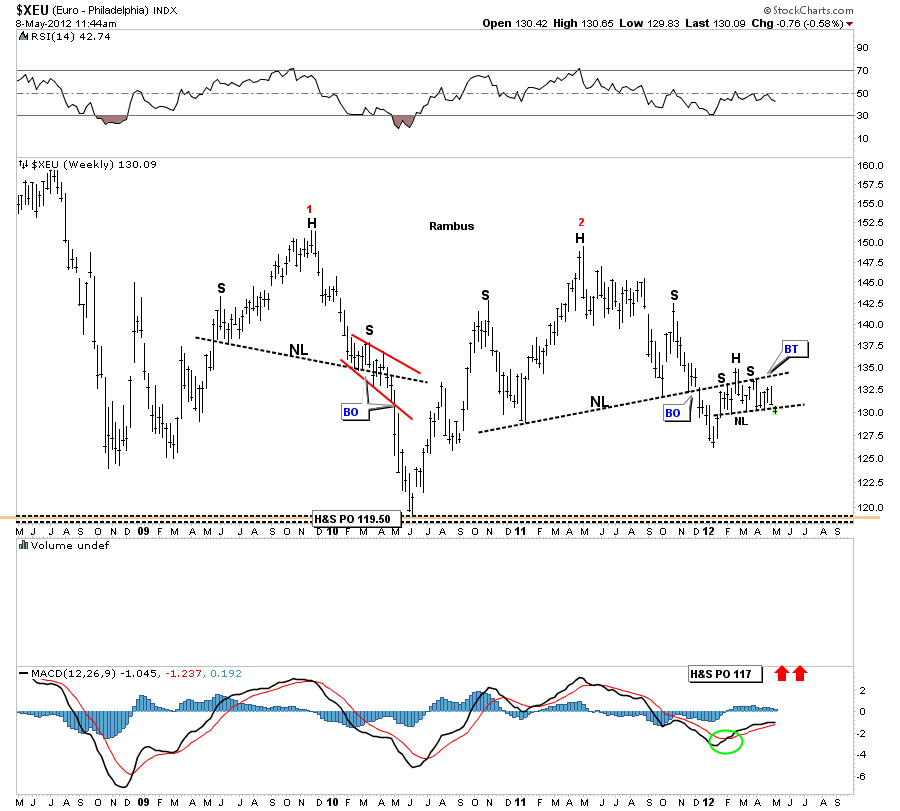
Finally, after the euro broke the big neckline back at the end of 2011 it now looks like the backtesting in complete. The backtesting process took on the shape of a H&S consolidation pattern. Today we are breaking the neckline. I hope everyone can see how all the pieces of the big jigsaw puzzle are coming together right now. All the big H&S tops that I’ve been showing for the last several months or so have painted a very clear picture of what we can expect. I believe we are still very early in this deflationary move. How far and long it goes is anybodies guess but the charts should keep giving us clues as we progress forward.
The weekly chart shows a price objective down to the 117 area for the big H&S top pattern.

………………………………………………….
EDITOR’s NOTE :
There is Big Money to be made on the downside and Rambus intends to do just that !
He Invites you to subscribe if you havent already done so and see his Trade set Ups and Targets for the Short ETFS including his “Kamikaze Trades” (3 X Shorts)
Also find out where he projects the bottom of this PM carnage will be…hint…the bottom in PMs will be well before the bottom in the SMs