This content is for Yearly and Monthly members only.
Subscribe
Subscribe
Already a member? Log in here

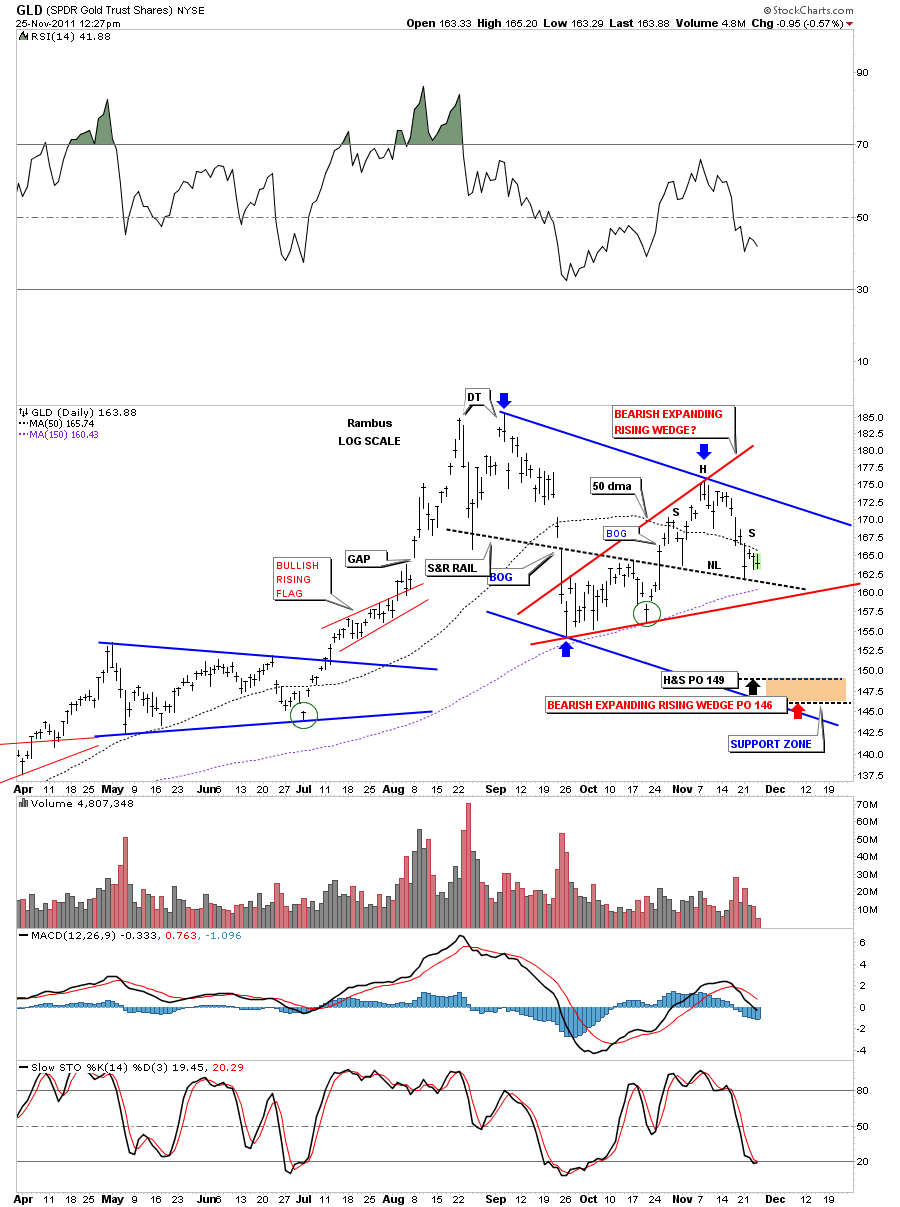
Below is an 8 month daily chart of GLD that I showed the other day. You can see the possible H&S that is forming on the S&R rail. We haven’t broken the neckline yet but the situation is looking more ominous as each day passes. Please notice the 2 blue arrows. One at the top of the chart at 1920 and the lower one at 1550 or so. Look hard at that decline. What you are seeing will be similar to what lies ahead for this next impulse leg down. A decline in price and time will be fairly equal to the first leg down off the 1920 top. If you still haven’t got your hedge on yet the next 3 to 4 weeks could be very painful if the neckline and the bottom rail of the red bearish expanding rising wedge fails. I plan on doing a more indepth weekend report based on this weeks support breaks on the stock markets and the dollar pattern that has developed, which will have a huge impact on the stock markets and the precious metals and stocks.
GLD 8 month little H&S top and the bigger bearish expanding rising wedge.
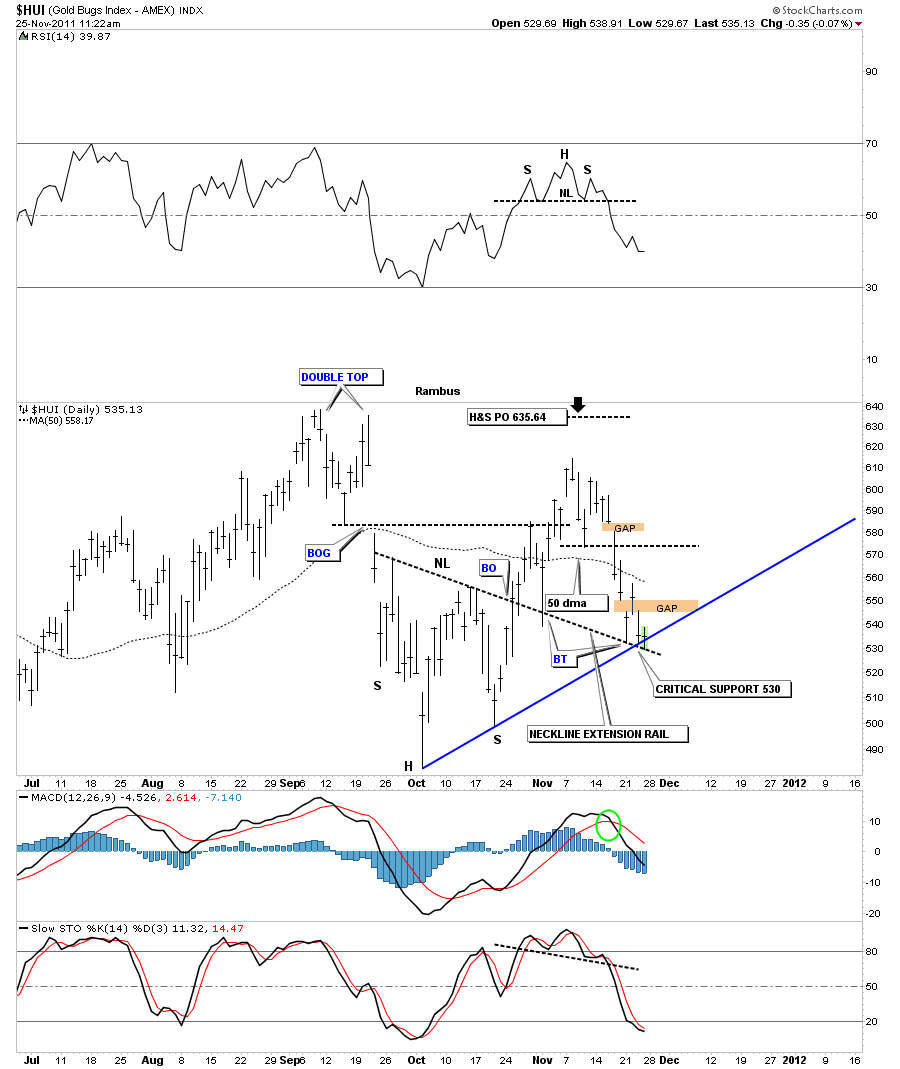
Below is our 6 month daily chart showing the inverse H&S bottom and the rally that ensued. After the first backtest to the neckline the HUI made a bee line straight to 615 that fell short of it’s price objective at 635. Now that we can look back at that failed price objective, at 635, I think it was a warning sign of weakness. Now on to our current area of support at the 530 area. We had another test of that low this morning. By looking at many other individual precious metals stocks and the bear flags that I’m seeing I think the 530 area in going to fail. But if your a hardcore gold bug and just have to buy you have a good low risk entry point right here with a sell/stop place below the neckline extension rail.
HUI 6 month daily 530 support zone.
But you better stick to charting…your Football Handicaping was a way off the mark…Detroit was a little overbought
🙂