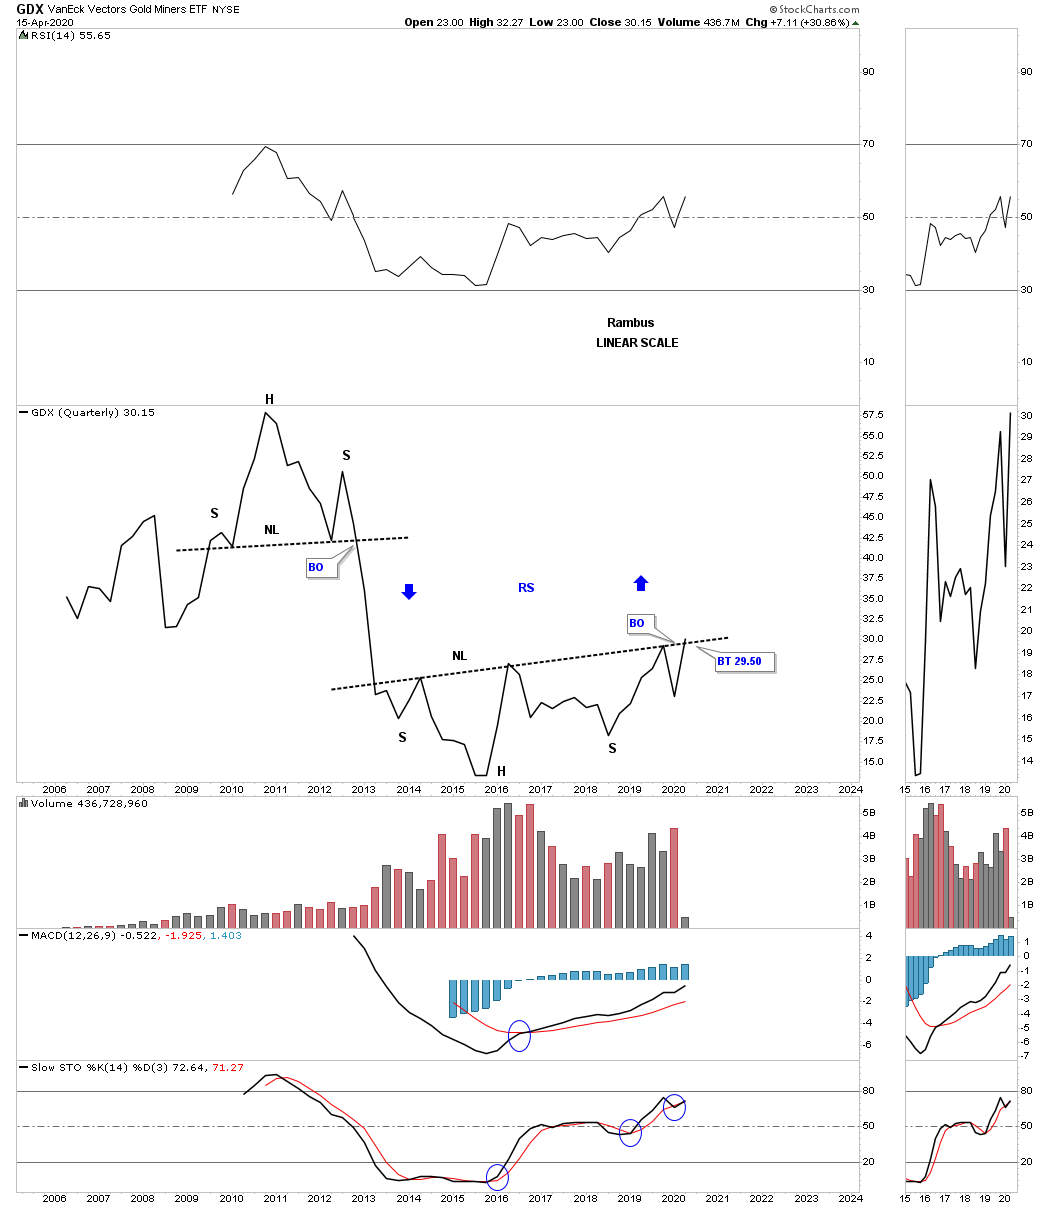
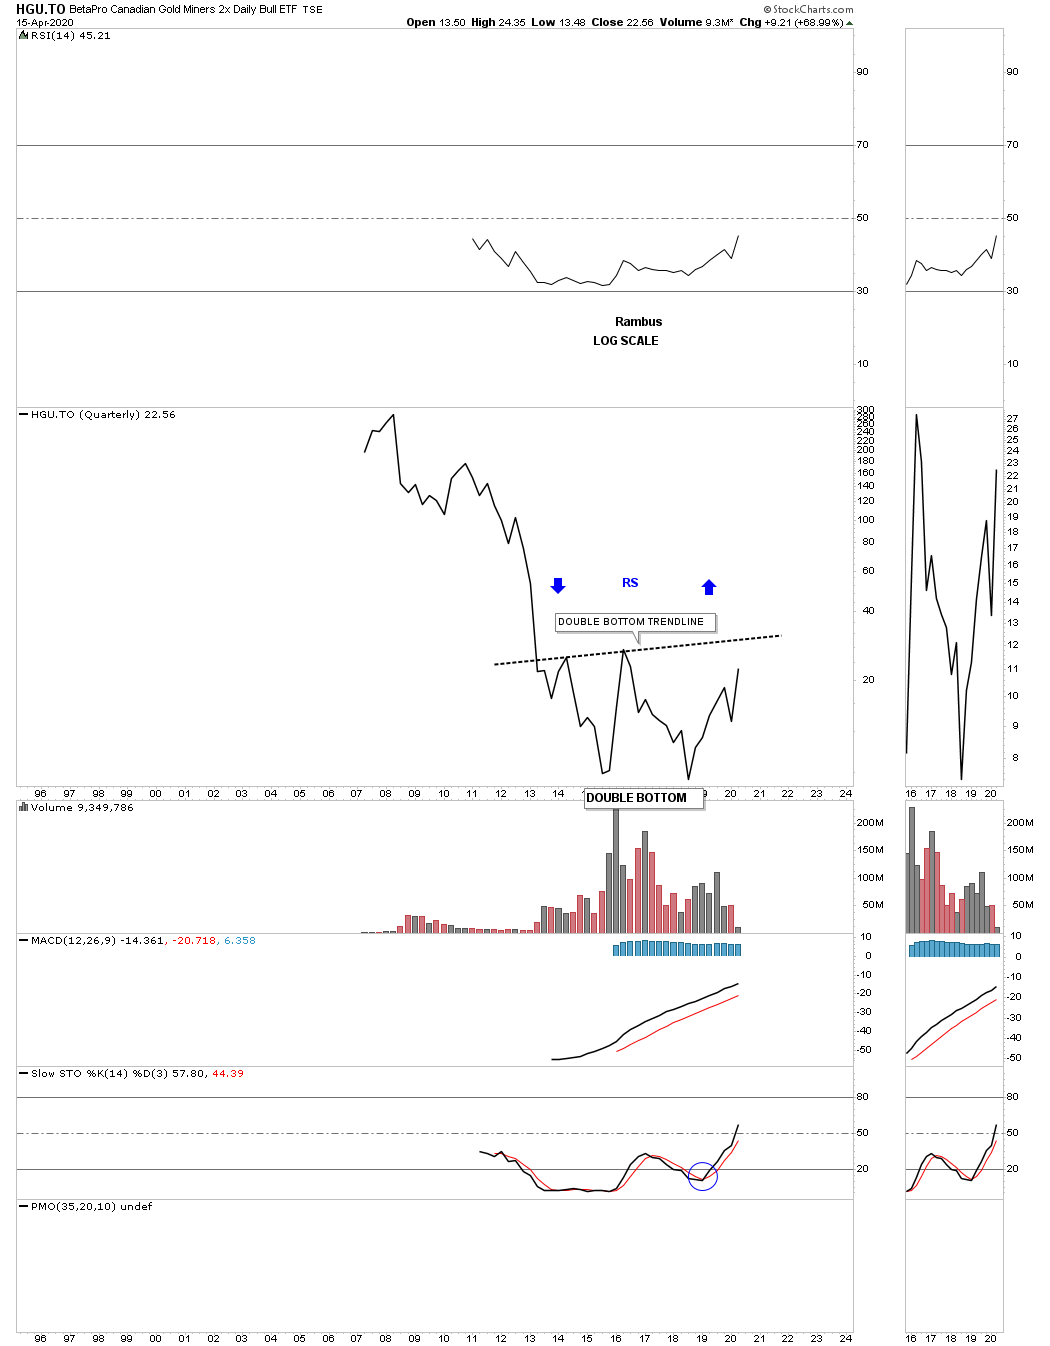
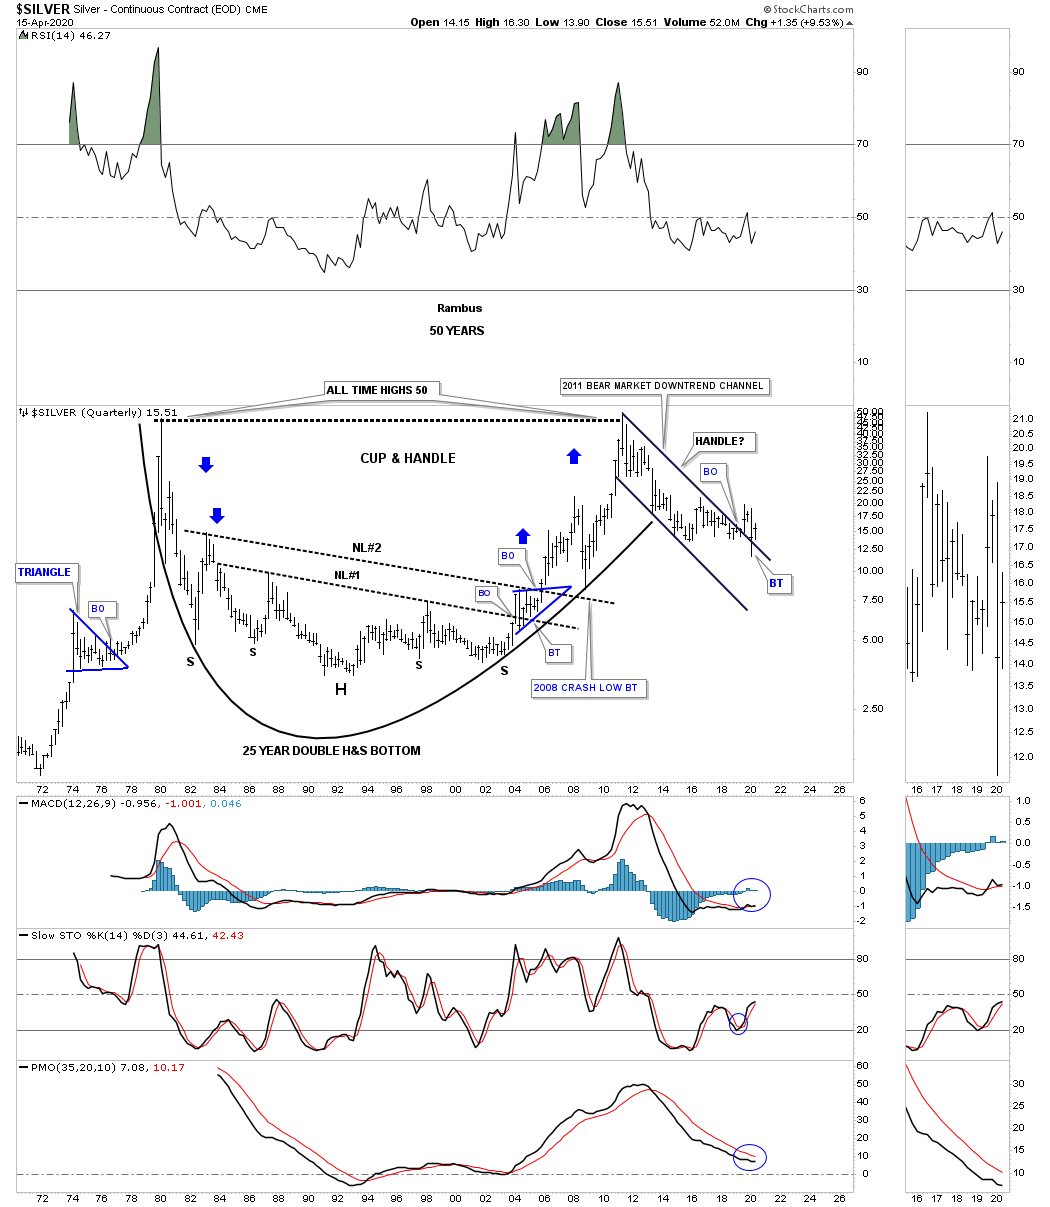
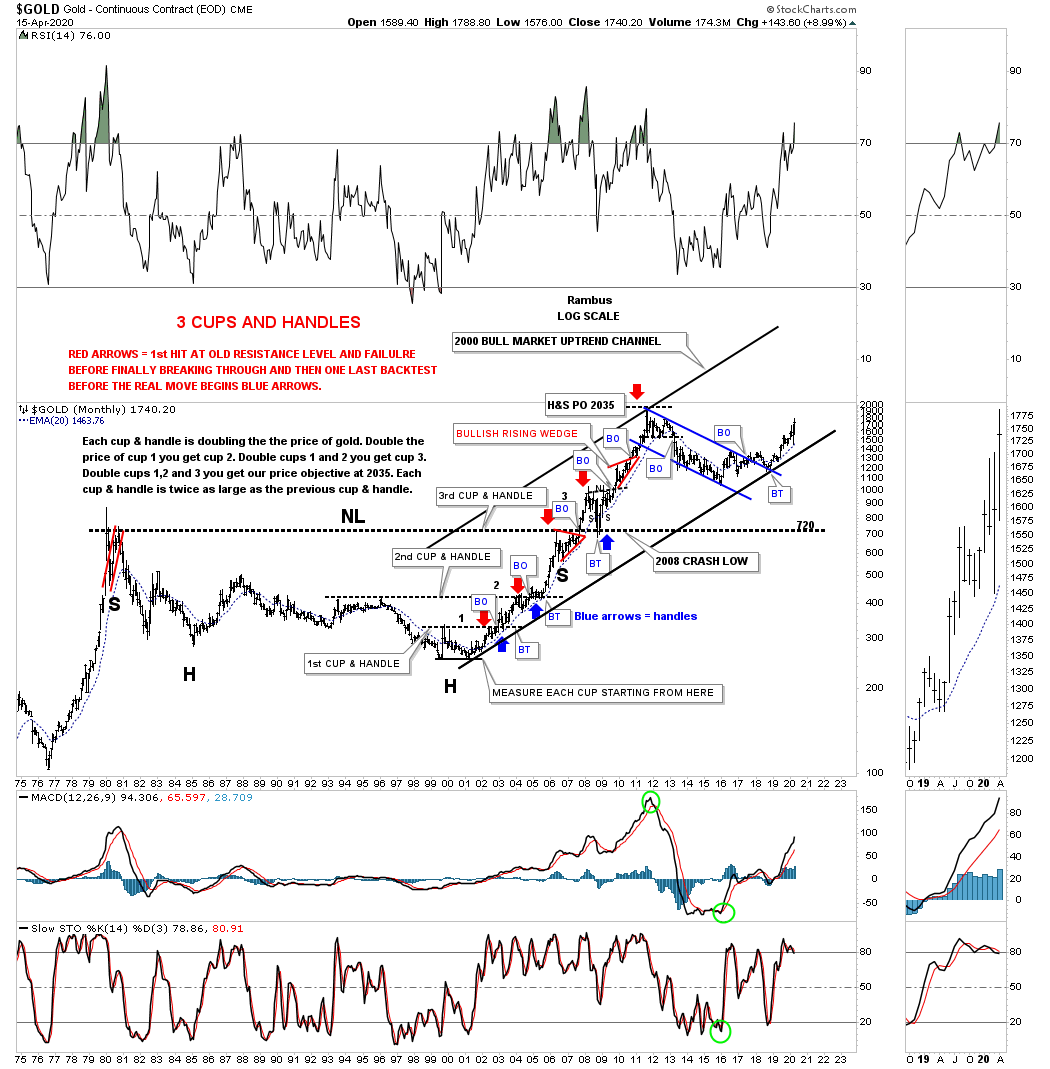
Weekend Report…The History of the End of the World Chart.

There are just a handful of events in ones lifetime that are truly history making in their magnitude. For instance the 1918 Spanish Flu pandemic, the 1929 stock market crash, Pear Harbor, the 1987 stock market crash and 911 to name a few. When all of those historical events took place it felt like the end of the world for those that were living in that time period. How could our world ever be the same after everything around them was crashing?

Since the beginning of 2020 we are currently witnessing two historical events going on at the same time that people in the future will be analyzing in detail, the 2020 Coronavirus pandemic and the 2020 stock market crash. As citizens of the world we are truly living smack dab in the middle of these two history making events which we won’t know how things are eventually going to turn out until they come to an end. In a year or two from now it will become very clear what the outcome was, but when you are living through these historical events it can feel like the end of the world.

Years ago I built a long term monthly chart for the $COMPQ that goes back 40 years which I call, “History Chart of The End of The World.” This chart shows all the important end of the world events going back to 1980.

If you look at this chart starting at the bottom left hand corner I’ve labeled all the important historical events that felt like the end of the world if you were trading in the markets back then. There was one day during the 1987 crash that is still the biggest one day percentage decline in history where the markets were down around 23% or so.

The COMPQ quickly recovered from that low and rallied into the September 1989 high which began another correction caused by the Saving and Loans crisis. If that was’t bad enough a year or so later began the start of the Gulf war which the markets shrugged off as not important. Those 3 history making events created the green bullish rising flag with a nice clean breakout and backtest. Less than 10 years later the COMPQ finally put in its bull market high. Just before the bull market high was established there was one more historical event which most have forgotten about, but at the time the markets were really rattled by the 1998 LTCM, Long Term Capital Management, debacle.

After the 2000 top was completed came the first real bear market since the 1970’s as shown by the green falling wedge. The percentage decline for the COMPQ was massive and it felt like the end of the world back then. Many thought another Great Depression was beginning that would last for years to come. Again, if that wasn’t bad enough then came the start of the Iraq war at the bear market low. How could the markets ever rally with all this bad news? The markets did find a way to stabilize and found a way to rally higher into the 2007 housing and banking crises. At the November 2007 high began the infamous bear market decline that this time for sure was going to put the US in the next Great Depression.

As the INDU and the SPX began their great bear market decline taking out their 2002 lows the COMPQ  on the other had declined far less because its 2000 to 2002 bear market was much more severe than the INDU and the SPX which produced a clear positive divergence for the tech stocks. Finally in March of 2009 the bear market that was going to last for many years came to an abrupt end and the SPX rallied strongly out of that 2009 bear market low creating the biggest bull market of all time with one consolidation pattern forming on top of the previous one. Note the 10 year blue triangle consolidation pattern which was needed to consolidate more than 20 years of the last secular bull market. You can also see the clean breakout and backtest to the top rail of that 10 year blue triangle consolidation pattern.That 10 year blue triangle is a halfway pattern between the two secular bull markets with the first one starting in the mid 1970’s and our current one that began at the 2009 low. When we look at this, “End of The World Chart,” in a year or two from now are we going to see the end of the world or will it be delayed until the next crises?

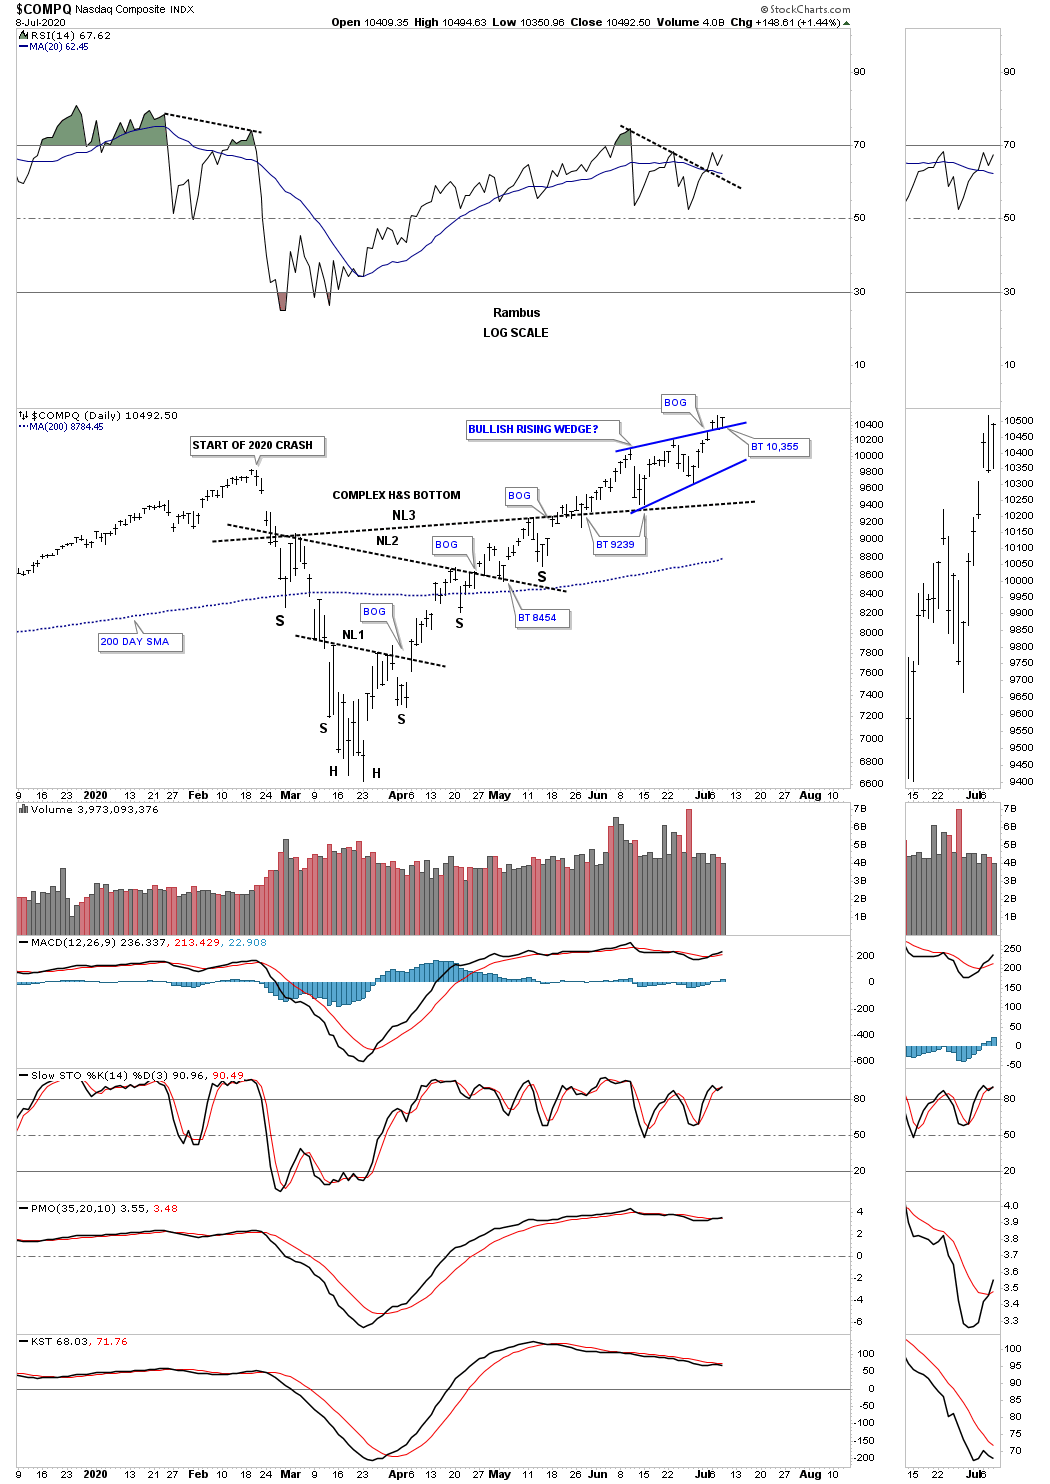
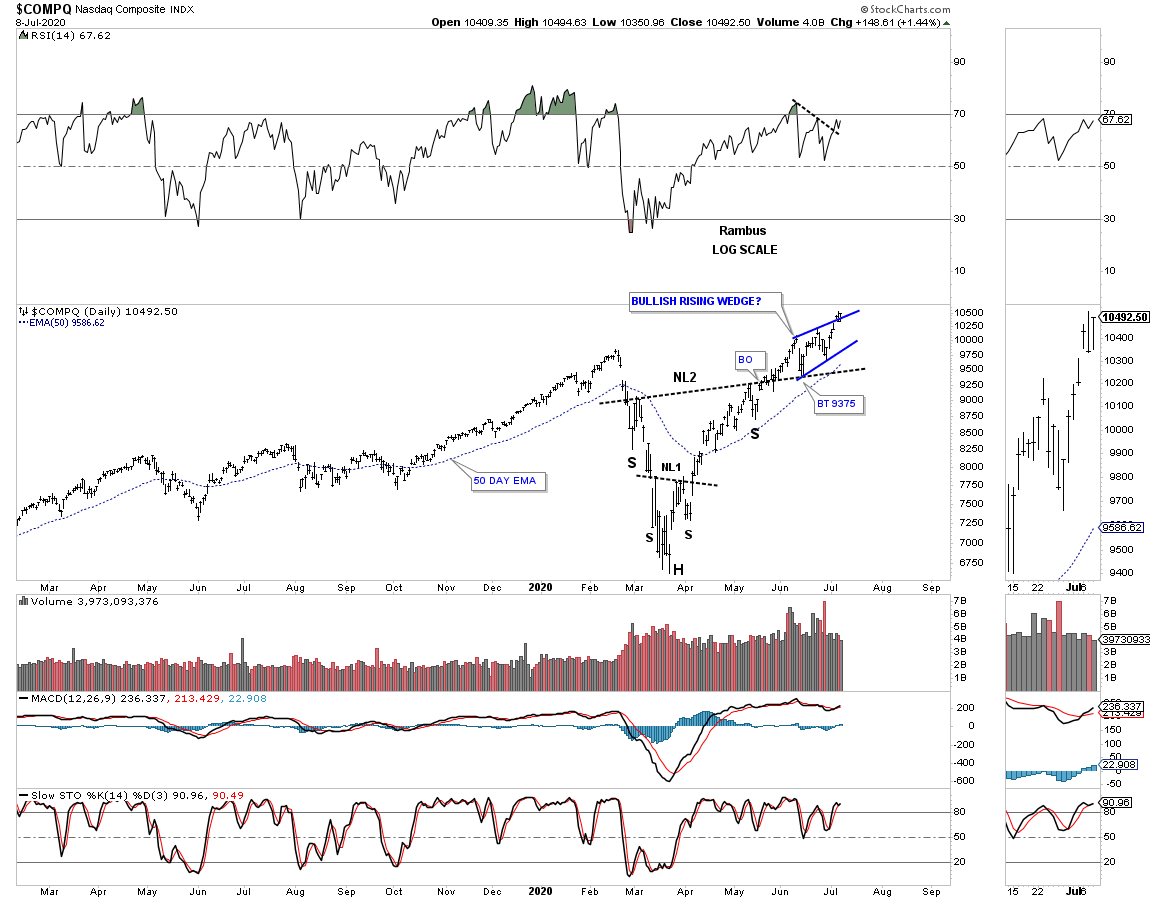
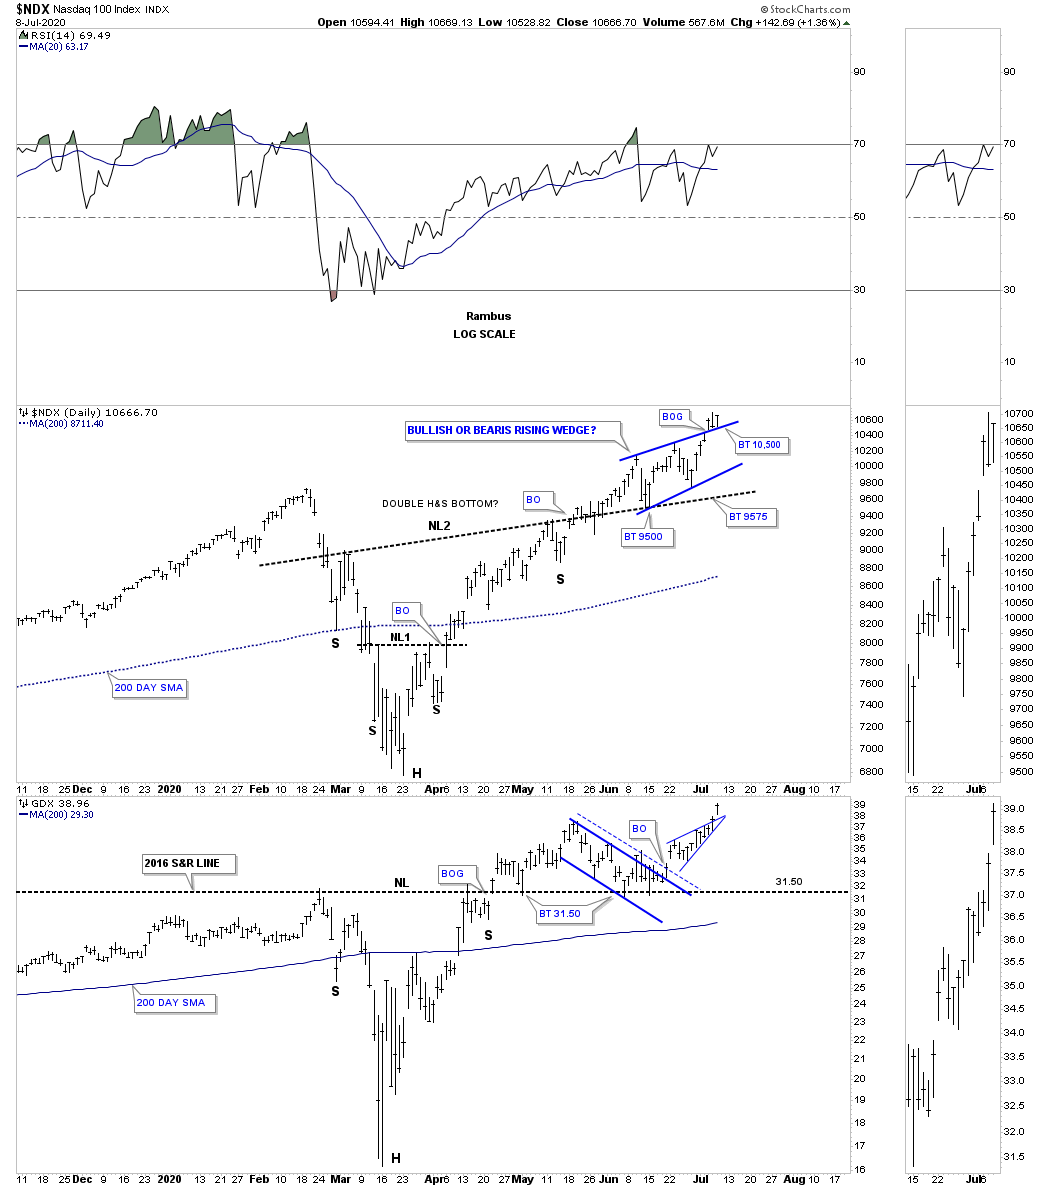
There was a short term pattern that showed up during the crash decline off the February 13th high at 28,045 to the March 23rd low at 18,189 on the INDU which is a pretty rare halfway gap or breakaway gap pattern. These halfway gaps show up in nearly vertical moves either up or down and show roughly the halfway point of the move. What these halfway gaps can also show us is that the impulse move has come to an end. Sometimes we can see a bottoming pattern start to form that will be a reversal pattern which tends to be the case most of the time. After some chopping and filling a consolidation pattern may form which would take the stock much lower.

If you recall I was very bullish the US stock markets going into the all time highs on February 13th. Once I saw the double top forming I suggested for everyone to exit all long positions because a double top is a reversal pattern and you don’t argue with a reversal patten no matter how big or small it may be. I also posted that the double top was forming just below  the top rail of the 2019 bearish rising wedge which could be the last reversal point. The last point I made about the top setup was that if the bearish rising wedge played out like it should we would most likely see a waterfall decline. We got the waterfall decline, but I had no idea it would be one of the biggest declines in the history of the stock market.

Normally when you see a halfway gap on one index it will show up on other indexes. Below is the 2019 bearish rising wedge with its halfway gap and price objective as shown by the black arrows.

The $NYA with its halfway gap and price objective.

The XHB, Homebuilders etf, also put in a halfway gap during its crash.

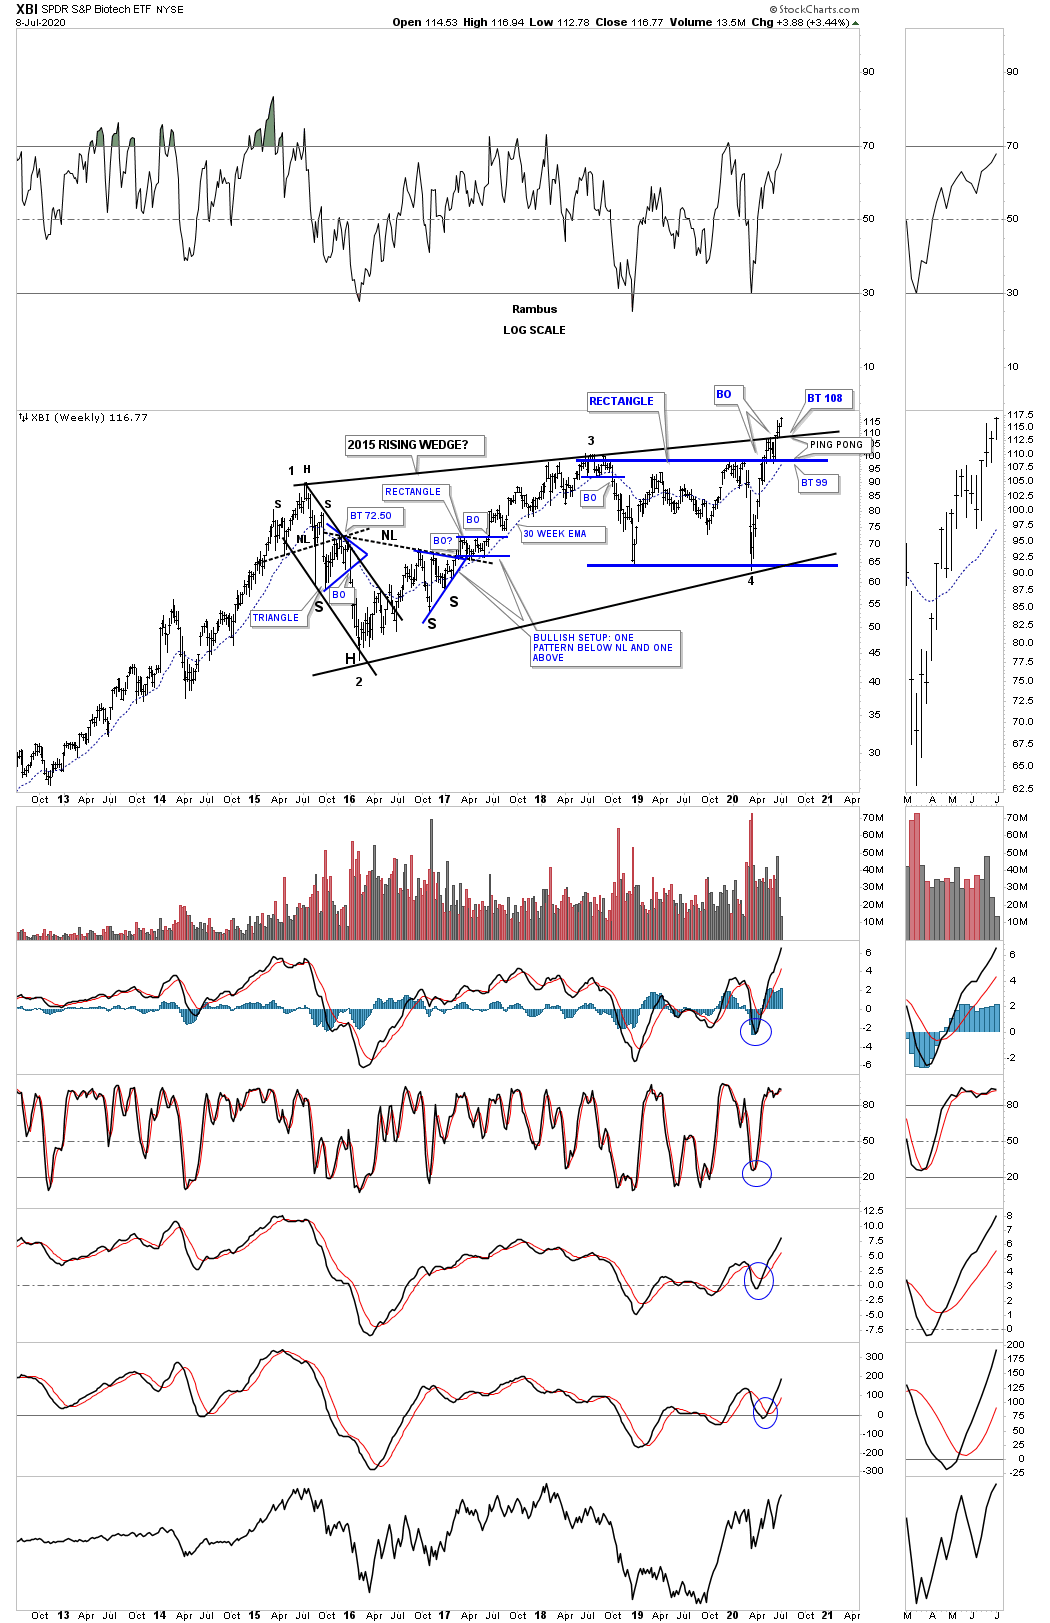
Another sector which put in a halfway gap to the downside was the XBI, Biotech etf.

The XLE, energy stocks etf, took a beating during its 2020 crash and also put in a halfway gap or breakaway gap.

Lets look at one more halfway gap pattern that has formed during the 2020 crash which is on the IYM, Basic Materials Sector. This halfway gap price objective measured out almost perfect as shown by the black arrows.

All the analysts are now trying to figure out what comes next in regards to the US stock markets. Some are comparing the 2020 crash to the 1929 crash which have a lot of similarities as both initial crashes were pretty dynamic and historic. Then there was the 1987 crash that produced the biggest one day percentage move in history of around 23% or so.

I’m going to present my take on what I think is possible based on some of the long term charts we been following for many years. This is just a possible scenario that could very well blowup tomorrow. As I’ve stated many times I’m not a big fan of fractals as they can workout beautifully until they don’t and they usually fail right when you expect them to play out the best, but when they do play out they can offer some great results. On the charts above we looked at some of the 2020 halfway gaps that formed on some of the US stock markets. Remember these gaps show up in fast moving markets.

The fractal I’m going to show you compares our recent 2020 crash to that massive 1987 crash on the SPX. There are some striking similarities between these two events which we’ll look at in detail. This first daily chart for the SPX we just looked at on the daily chart above which shows its halfway gap in the middle of its impulse leg down.

Next is the massive impulse leg down the SPX experienced in 1987. As you can see the SPX produced a halfway gap to the downside during its 1987 crash which is very similar to the halfway gap on the 2020 crash. The 1987 crash low marked the low that has held to this day. After the 1987 low was established there were two more attempts to take out 1987 bottom, but the bears failed and the rest they say is history.

Now lets take the 1987 and 2020 fractal a step further and look at a long term quarterly  chart for the SPX which starts at the 1987 crash low so you can see what took place afterwards. Starting at the bottom left hand corner of the chart you can see where the 1987 crash found its low. Now look at the current 2020 crash at the top right hand side of the chart. The black box in 1987 and the one in 2020 are the exact same height which measures price not time. What followed after the 1987 crash was the formation of the blue 1987 bullish rising wedge halfway pattern which took about 8 years to complete. What this chart doesn’t show is the price objective for the 1987 bullish rising wedge HP which was reached at the 2000 secular bull market high.

If we compare the black rectangle in 1987 to the black rectangle in 2020 you can see there is very little room for the 2020 price action to drop below the initial low made at 2191 to keep the fractal alive. From that 1987 low it took almost 2 years of trading before the SPX could make a new all time high above the 1987 high. The 12 month sma also did a good job of holding support all the way up to the 2000 bull market high.

The other very important feature on this chart is the massive 2013 flat top expanding triangle that I view as a halfway pattern in the really big picture going back many years we’ll look at in a minute.

This next very long term quarterly chart for the SPX runs from 1946 to 2002 which puts the 1987 bullish rising wedge, we just looked at on the chart above in perspective as a halfway pattern. Also, you will be able to see why I call that massive 13 year flat top triangle a possible halfway pattern to the upside. Before the 1987 crash the SPX was enjoying a strong bull market that began at the last reversal point in the 13 year bullish rising wedge which was needed to consolidate the last secular bull market.

This last chart for tonight is a 75 year quarterly chart which ties everything together. The blue rectangle at the 1987 crash is the exact same height as the 2020 blue rectangle which measures the first rally out of their respective massive 13 year consolidation pattern before their record setting crash with the 1987 crash low holding. We won’t know for some time if the current low on the 2020 crash is going to hold support.

All we know right now is that the 1987 and the 2020 crashes are very similar along with what the long term charts are showing. So is this massive fractal thats been developing for many years going to fail right at the moment of truth? It is what it is until it isn’t. Please everyone take care of yourselves and look after your loved ones. All the best…Rambus
Wednesday Report…US Dollar Ratio Charts Are Telling a Very Important Story

Before we look at tonights charts I would like to take a minute and explain to our new members how we manage the different portfolios. We have 3 different portfolios, the Kamikaze, Leveraged and the PM Stocks Trade portfolios with each having $100,000. That $100,000 in each portfolio is then broken down into $5000 increments for each trade giving us a total of 20 trades for each portfolio. Currently we have just 4 trades in the Kamikaze Portfolio, 5 in the Leveraged Portfolio and 0 in the PM Stocks Trade portfolio. What that means right now is that we have a very high level of cash. It is completely up to you on how you want to manage your own portfolios. I just wanted to put this out there because sometimes we may have up to 20 trades in the Leveraged Portfolio, 20 trades in the PM Stock Portfolio and 8 to10 in the Kamikaze Portfolio, all at one time. It boils down to what the markets are giving us which sometimes is a lot and other times not much.

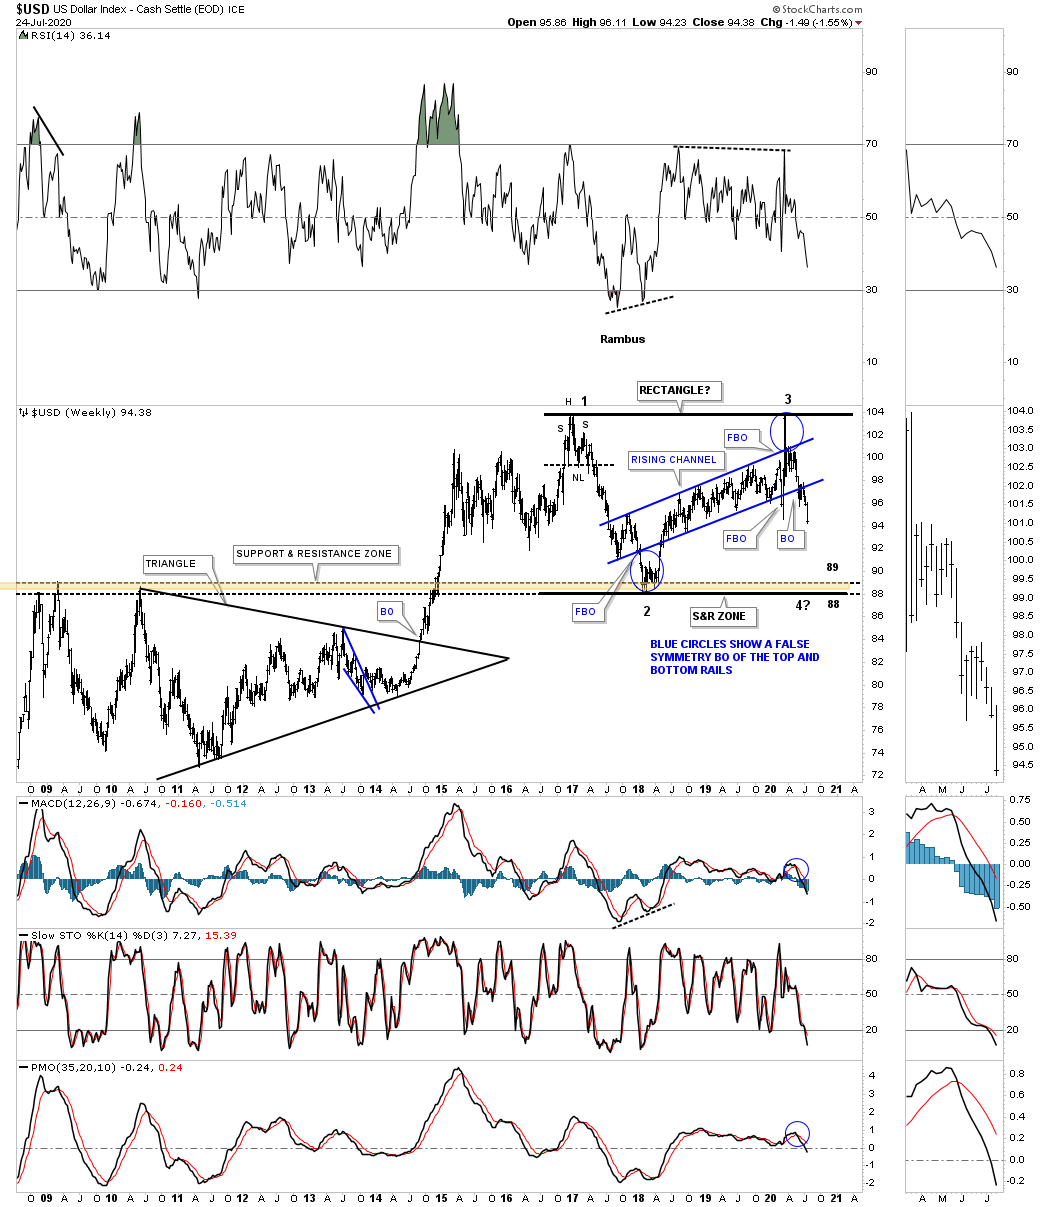
I would like to start by looking at some US dollar charts we’ve been following as its beginning to show some serious strength lately. This nearly 2 year daily chart shows the rising wedge we’ve been following for close to a year that has been trapped between the top and bottom trendlines. Recently there was a false breakout below the bottom rail which caused a whipsaw. Once the price action traded back inside of the rising wedge the false breakout was negated. Today the price action broke out above the top rail. What we need to see now is for the backtest to hold support to complete the breaking out and backtesting process.

This next chart for the US dollar is a 35 year monthly look which shows how the bullish rising wedge on the daily chart above fits into the 2011 uptrend channel.

This last chart is a 25 year monthly bar chart for the US dollar I built several years ago which at the time I had no idea if it would play out. Big chart patterns like this can take a long time to come to fruition, but it does give you something to follow until something breaks down. Until something breaks down you just go with it. Note the blue rising wedge that we just looked at on the charts above that is forming as part of the right shoulder of a possible massive 14 year H&S bottom. All in all the symmetry has been pretty good as shown by the neckline symmetry line which shows the bottom for the left and right shoulders. Keep in mind the H&S bottom won’t be complete until the neckline is broken to the upside.

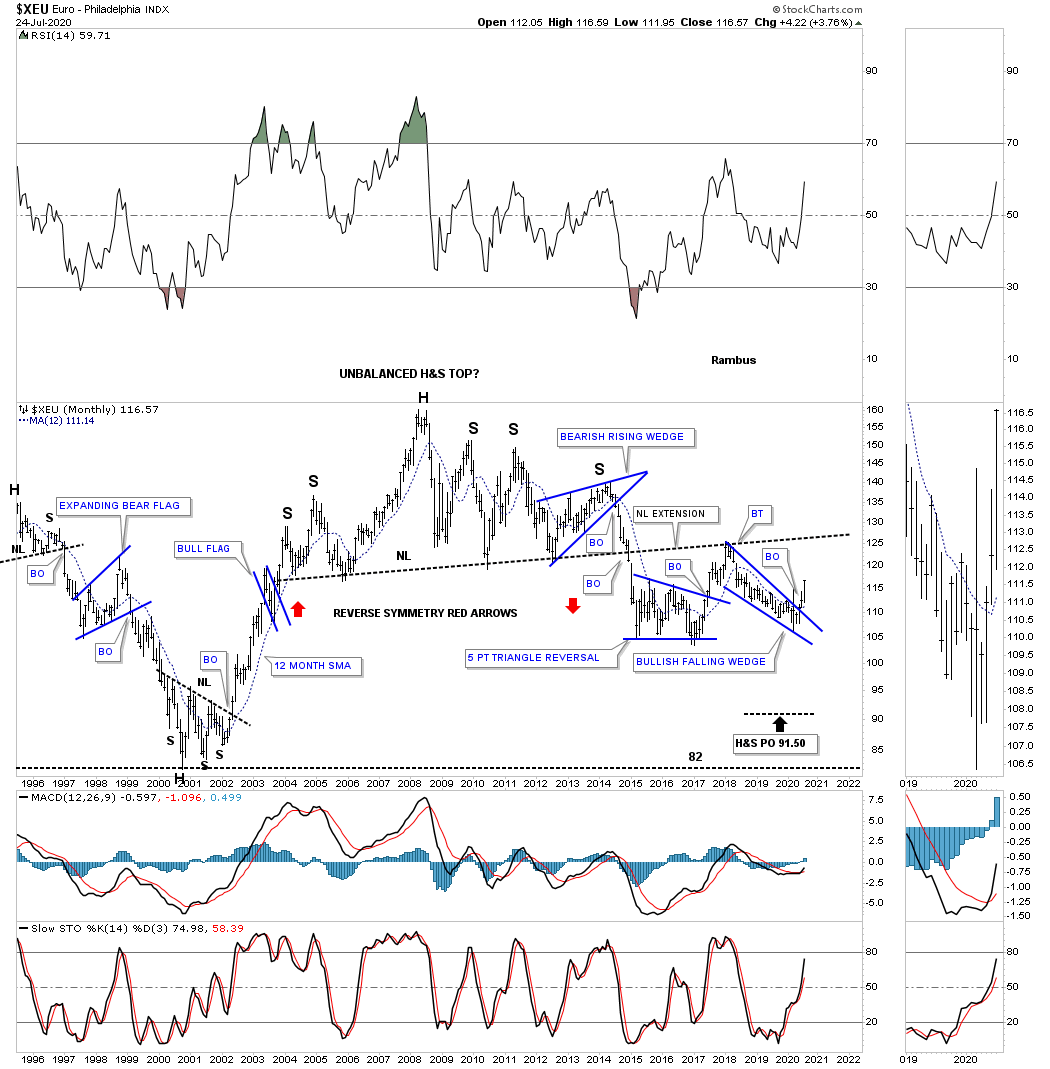
We know that there is a pretty close correlation for the most part between the US dollar and the Euro. If the US dollar is forming a 14 year H&S bottom then the odds are pretty high that the ratio chart, US dollar : XEU, should also be forming a massive H&s bottom which it is.

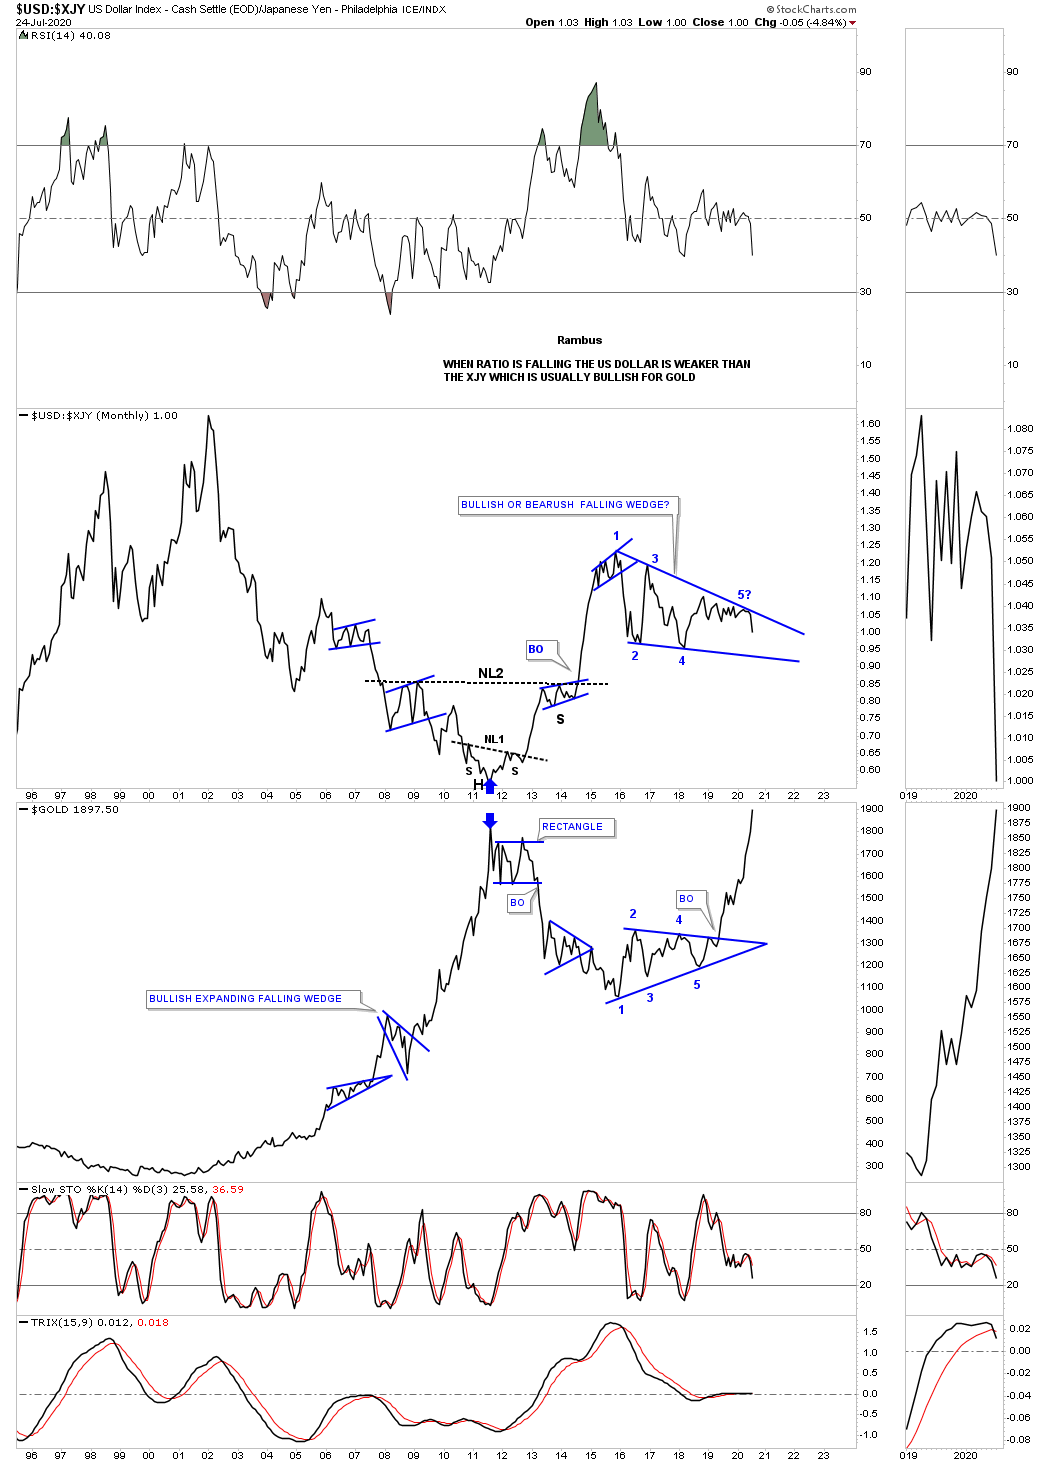
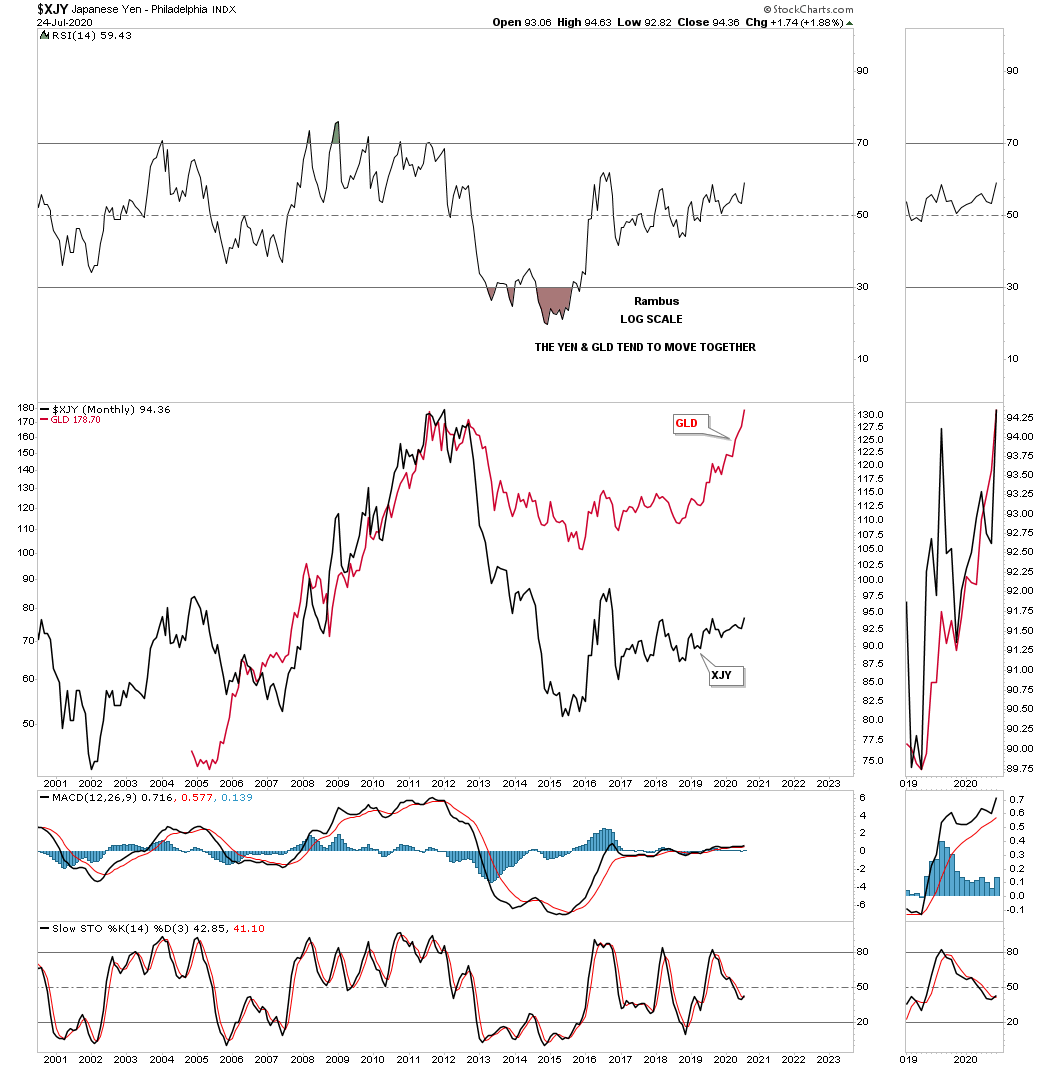
The same can be said for the USD:XJY ratio which is getting close to breaking out from the blue bullish falling wedge right shoulder. Again the neckline symmetry line is showing us the low for the left and right shoulder for neckline #3.

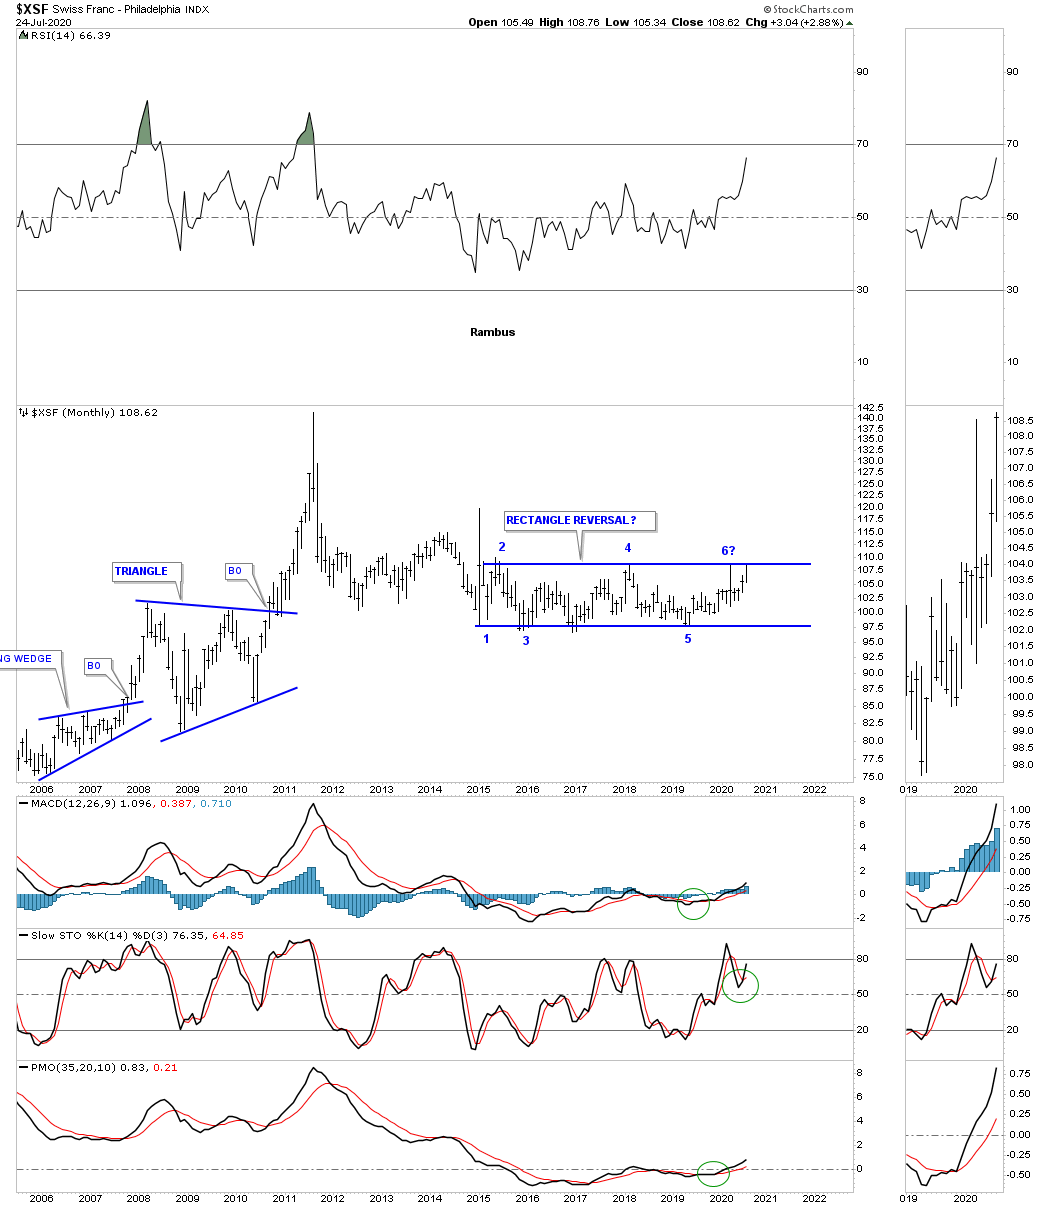
The US dollar to the Swiss Franc is also showing a massive H&S bottom.

I realize these massive H&S bottoms seem impossible for the average investor to believe. How can something 14 years in the making have any relevance to this time period?

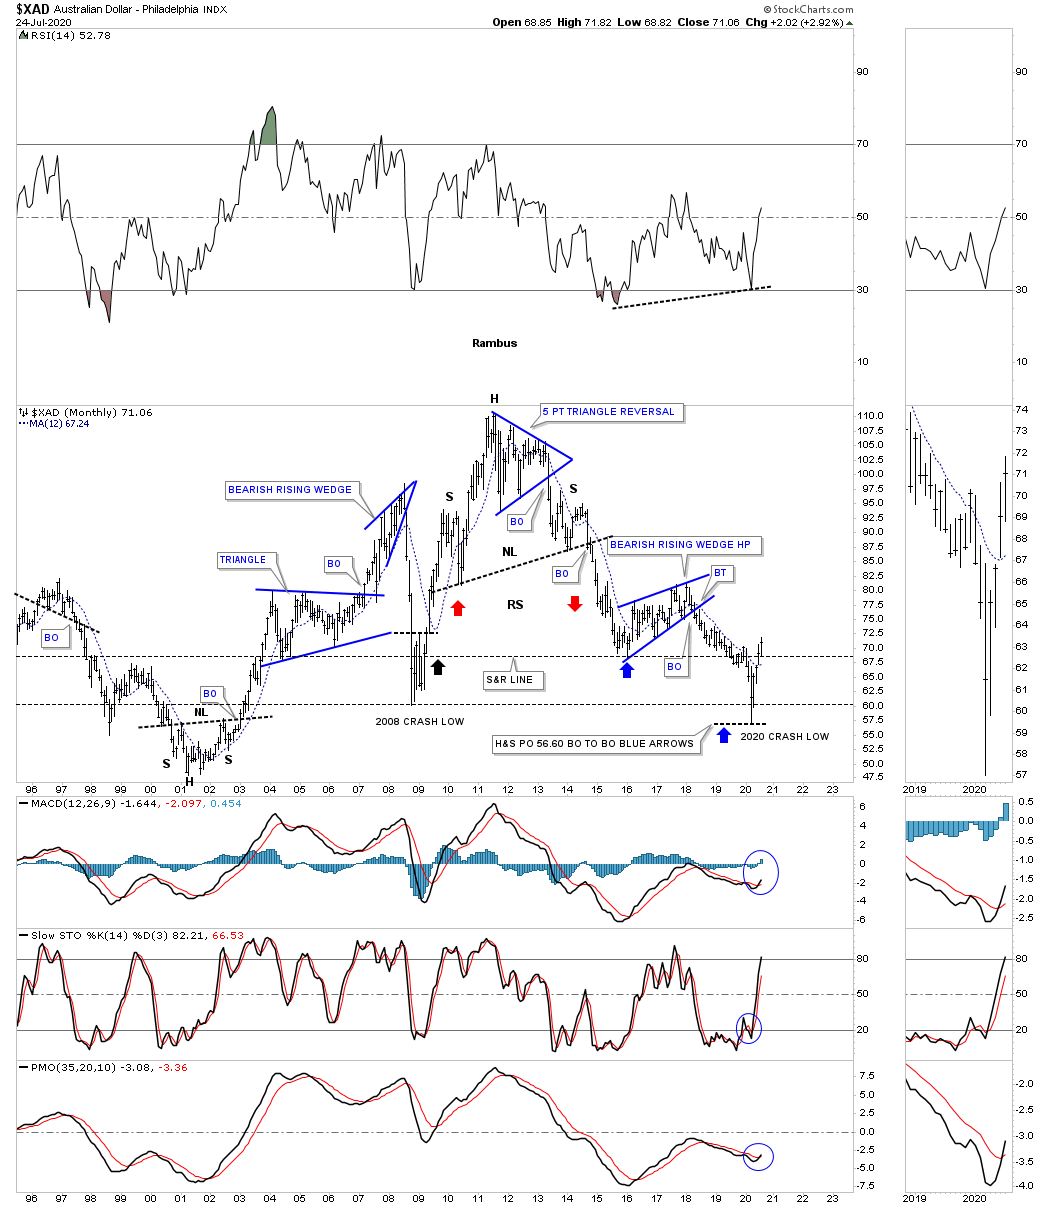
Below is the ratio chart which compares the US dollar to the Australian dollar.  While the ratio charts above still show the right shoulder under construction this ratio is breaking out from its massive H&S bottom complete with a breakout gap and neckline symmetry line.

This last currency ratio chart compares the US dollar to the $CAD, Canadian dollar. This ratio is showing a strongly slanted H&S bottom with a breakout above the top rail of the blue bullish expanding falling wedge right shoulder. The breakout this week of the blue expanding falling wedge strongly suggests that the slanted H&S neckline is going to give way to the upside.

This next chart is a weekly look at the USDU which is a more equally weighted index for the US dollar. After the backtest the impulse move is well underway.

Below is a combo chart which has the ratio UUP:DBC on top with the DBC in the middle and the UUP on the bottom. The last time we looked at this chart the ratio chart on top still hadn’t broken out above the neckline. What this chart shows us is how our current setup, brown shaded area on the right side of the chart, compares to the setup on the left side of the chart which shows the last deflationary event. This ratio combo chart suggest there is still a lot of time left  before this these charts run their course.

This next chart shows how gold to the US dollar did during the 2000 bull market in the precious metals complex. Just like gold itself this ratio produced some of the best chart patterns of any sector I’ve ever charted. Believe it or not this bear market has been in play for close to 9 years now with no signs of letting up just yet, especially if the 2016 rising wedge ends up being a halfway pattern to the downside.

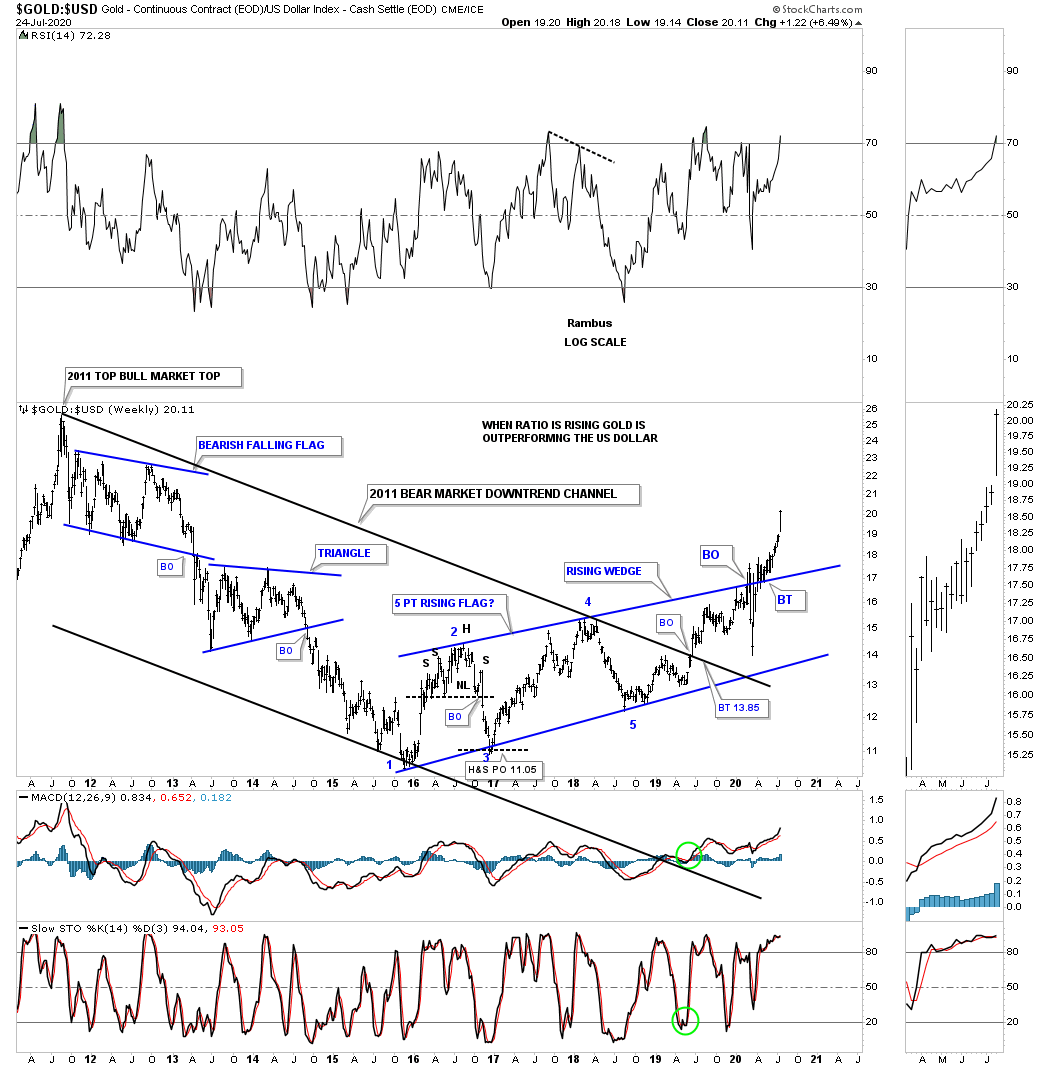
This last chart for tonight compares gold to the US dollar. When the ratio is rising gold is outperforming the US dollar. Since the bottom in 2016 gold has been outperforming the US dollar up until 3 weeks ago. There was a false breakout above the blue trendline that was negated when the ratio traded back inside of the 2016 rising wedge.

For those that like fundamentals to study maybe you can put your skills to the test and figure out why the US dollar has formed a massive 14 year H&S base compared to most of the important currencies of the world. This massive base is going to be in play for years to come. All the best…Rambus
 

Weekend Report…The Chartology of a Deflationary Event

The great debate on whether we’re going to see inflation or deflation has been answered in spades. For years some of the greatest minds of our time have discussed this issue in great detail with each side giving probable reasons as to why we’ll see either inflation or deflation. Both sides can make great points to their arguments but in the end only one side will win the battle that has been raging on for years. While the fundamentalist argue their points I’m going to show you from a Chartology perspective the true story of what is taking place in this great debate.

In this Weekend Report we’ll look at some short, intermediate and long term charts for the US dollar and some commodities indexes to paint a picture of what millions of investors, from around the world are actually doing with their money. These investors leave their mark on a chart that show up as short term battles to longer term wars that can last for years. These battles and wars create chart patterns that define the winner and looser of each encounter.

To understand the deflation scenario we are in lets start with a few charts for the US dollar. This first chart is the 25 year monthly fractal chart we’ve been following since 2014 which shows the 2 fractals, big base #1 and big base #2. Our last deflationary event took place when the US dollar broke out from big base #2 in September of 2014. That impulse move began the 2011 uptrend channel that has been in place ever since. The blue rising channel is the same rising channel we were following on the daily combo chart that had the UUP on top with the HUI on the bottom. As you can see there was a small false breakout below the bottom rail of the blue rising channel that was negated when the US dollar traded back inside of the rising channel. Note where the US dollar was when gold bottomed in 2000 then note where the US dollar was when gold topped out in 2011. This shows us that over short periods of time these two can run together but over the longer term there is a distinct inverse correlation. Until the US dollar breaks below the bottom rail of its 2011 uptrend channel we have to assume the US dollar’s bull market remains in tact.

There was another long term chart I built for the US dollar back in 2014 which was the 30 year bullish falling wedge which got a lot of snickers when I first posted it. Keep in mind I posted this chart before the breakout of the top rail. After the breakout above the top rail the question then became will it hold support on a backtest from above? As you can see it has held on 3 separate occasions so far with the last backtest in February of 2018.There was another layer of support at the Mar 2018 backtest area which was the 2000 H&S top neckline as shown by the neckline extension line.

There is another US dollar index I follow which is a little more equally weighted that is the USDU. Last week it broke out from a bullish rising wedge that began to form in late 2018.

Below is a 4 1/2 year weekly chart for the USDU which shows a pretty strong uptrend since late 2018 after putting in a double bottom.

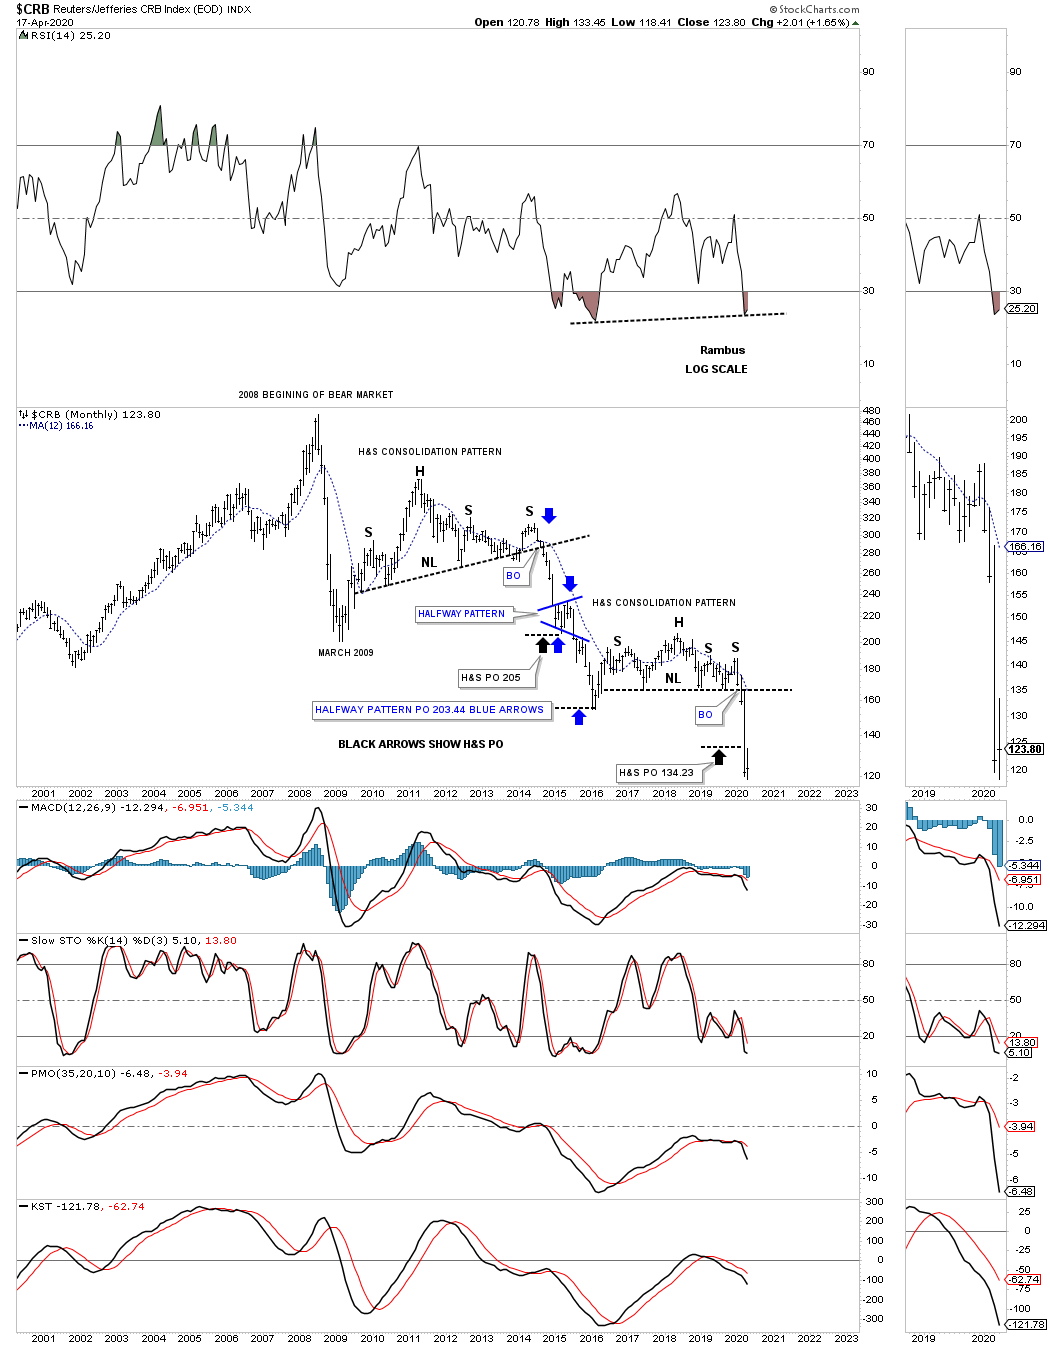
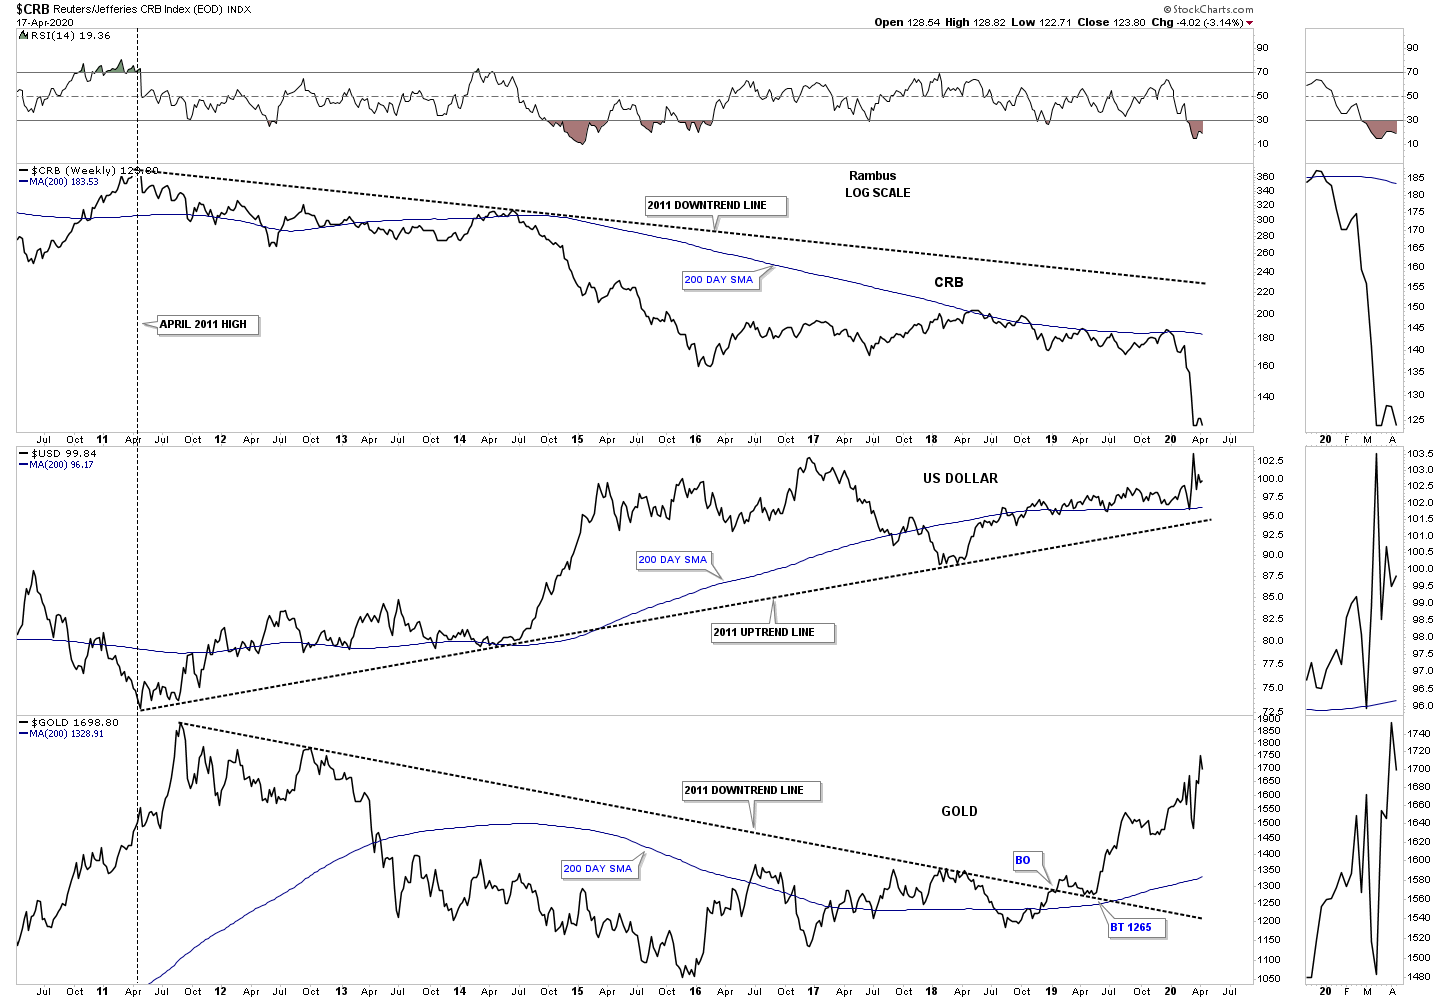
With the US dollar showing strength since 2011 lets look at some commodity indexes to see what shape they are in starting with this monthly chart for the CRB index. First note the right shoulder high in 2014. That is the point where the last deflationary event started which ended in early 2016. For the last 4 years the price action has chopped out a large H&S consolidation pattern with the breakout below the neckline last month.

There is also another important chart pattern that has formed since the 2016 low which is a bearish rising wedge.

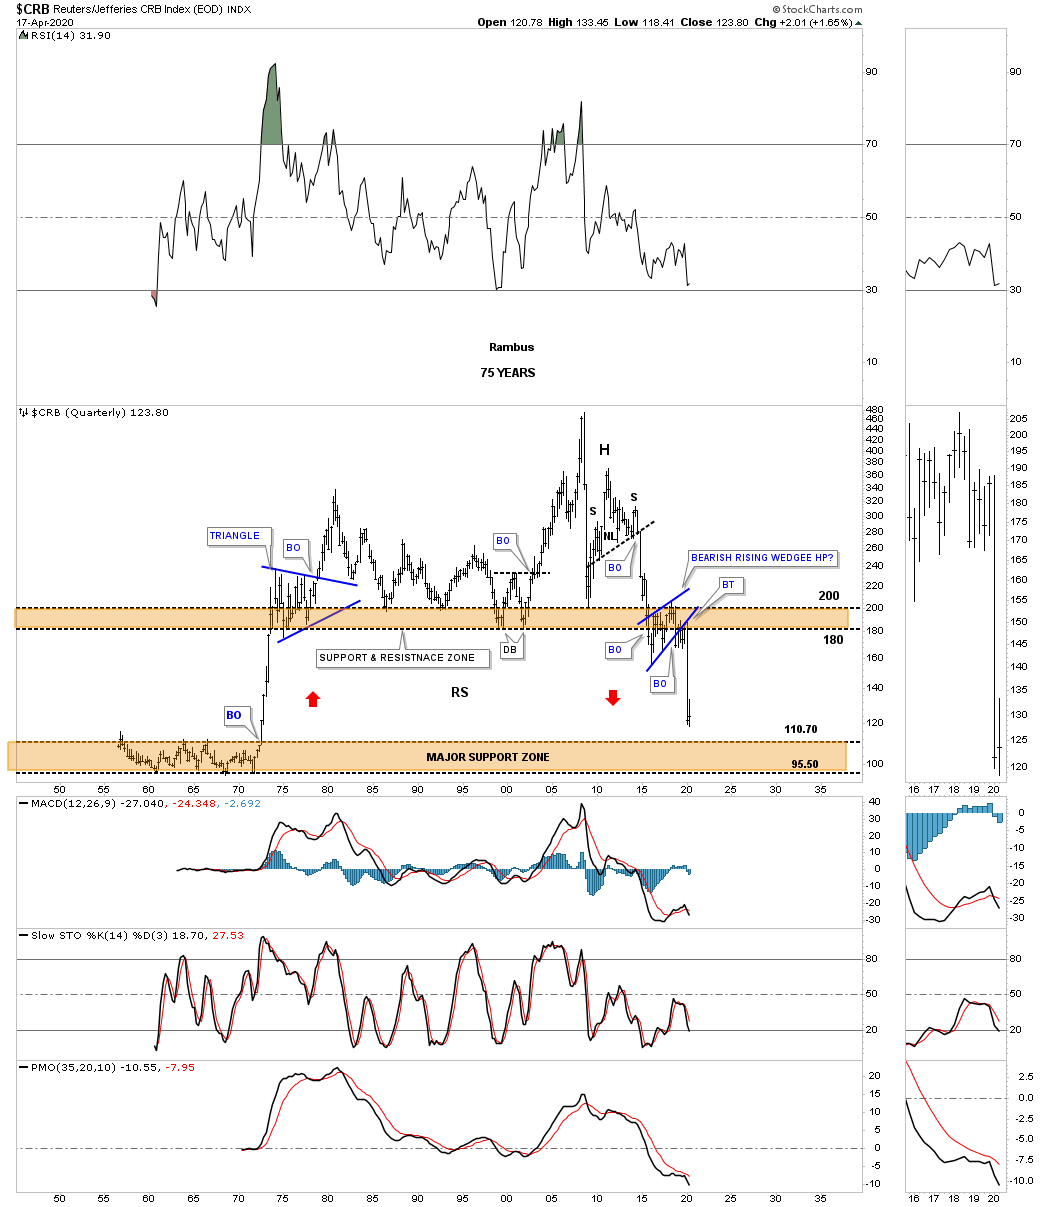
Below is another chart I built in 2014. When you put all the chart patterns together we come out with one ugly looking chart. Here again the right shoulder high in 2014 began the last deflationary phase. I was looking for the brown shaded S&R zone to hold support which it did after a strong overshoot. From that final low in mid 2015 came the backtesting process back up to the brown shaded S&R zone. It took nearly 3 years for the backtesting process to finish up and when it did we were left with the 2016 bearish rising wedge which I labeled as a halfway pattern to the downside. What I found very interesting when I first built this chart was the vertical price action that took place in the early 1970’s which is why I added the red arrows which shows how I was looking for reverse symmetry over that same area on the way down. The thin dashed back horizontal line shows the CRB index is now trading at a low not seen since January of 1973 which is pretty incredible when you think about it.

The most important commodity on the planet is oil which can tell us a lot about the economy. In a strong growing world economy there is a big demand for oil which causes the price to go up. On the other hand when the world economy is weak that strongly suggests a weak oil pice. Below is one of the charts for the WTIC we used back in the last deflationary event that began at the red circle at the top of the 5 point triangle reversal pattern. The red circle just shows weakness as the price action failed to reach the top rail which can be a precursor to the completion of a pattern. The thin blue dashed upslopping trendline was the first area we were waiting to give way. Then came the bottom rail of the 5 point triangle which had a perfect breakout and backtest as shown by the blue circle. The triangle price objective was achieved in January of 2015 at 44. It took almost another year before the final low was reached in February of 2016.

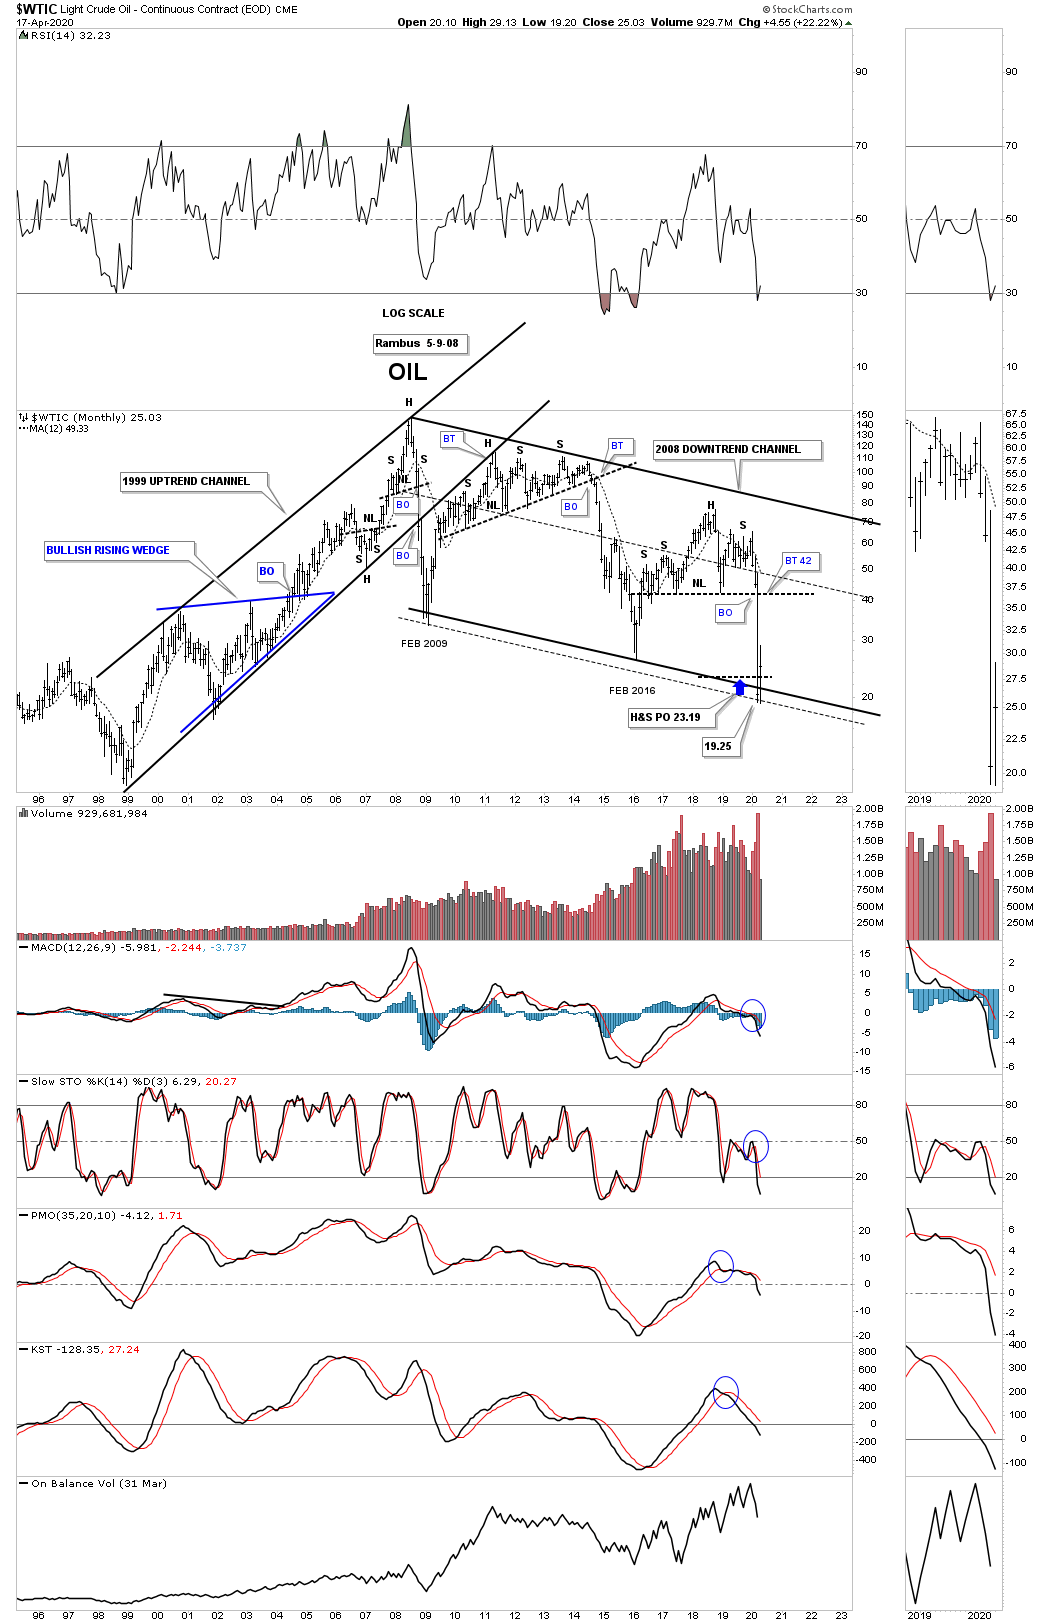
Many times when a stock is building out a multi year chart pattern it can be made up of several smaller individual patterns. You can see this on the H&S pattern on the weekly chart above which has a bull flag left shoulder and the blue triangle right shoulder. Below is a 25 year monthly chart for WTIC which shows the 1999 uptrend channel that ended with the small H&S top in 2008. That small H&S top in 2008 was made during the same time as the stock markets and PM stock indexes which led to the infamous 2008 crash which was, by looking at this chart, was the birth of the deflationary environment we currently find ourselves in.

After the 2008 crash ended in February of 2009 came the countertrend rally which ended up backtesting the bottom rail of the 1992 uptrend channel on multiple occasions, but could never break through above it. Then WiTC began to build out a very long drawn out trading range which eded up being a 5 year H&S top. That H&S top was one of those very large patterns that you spot early on and then have to wait for it to finally complete, testing your patience to the end, but the wait was finally worth it.

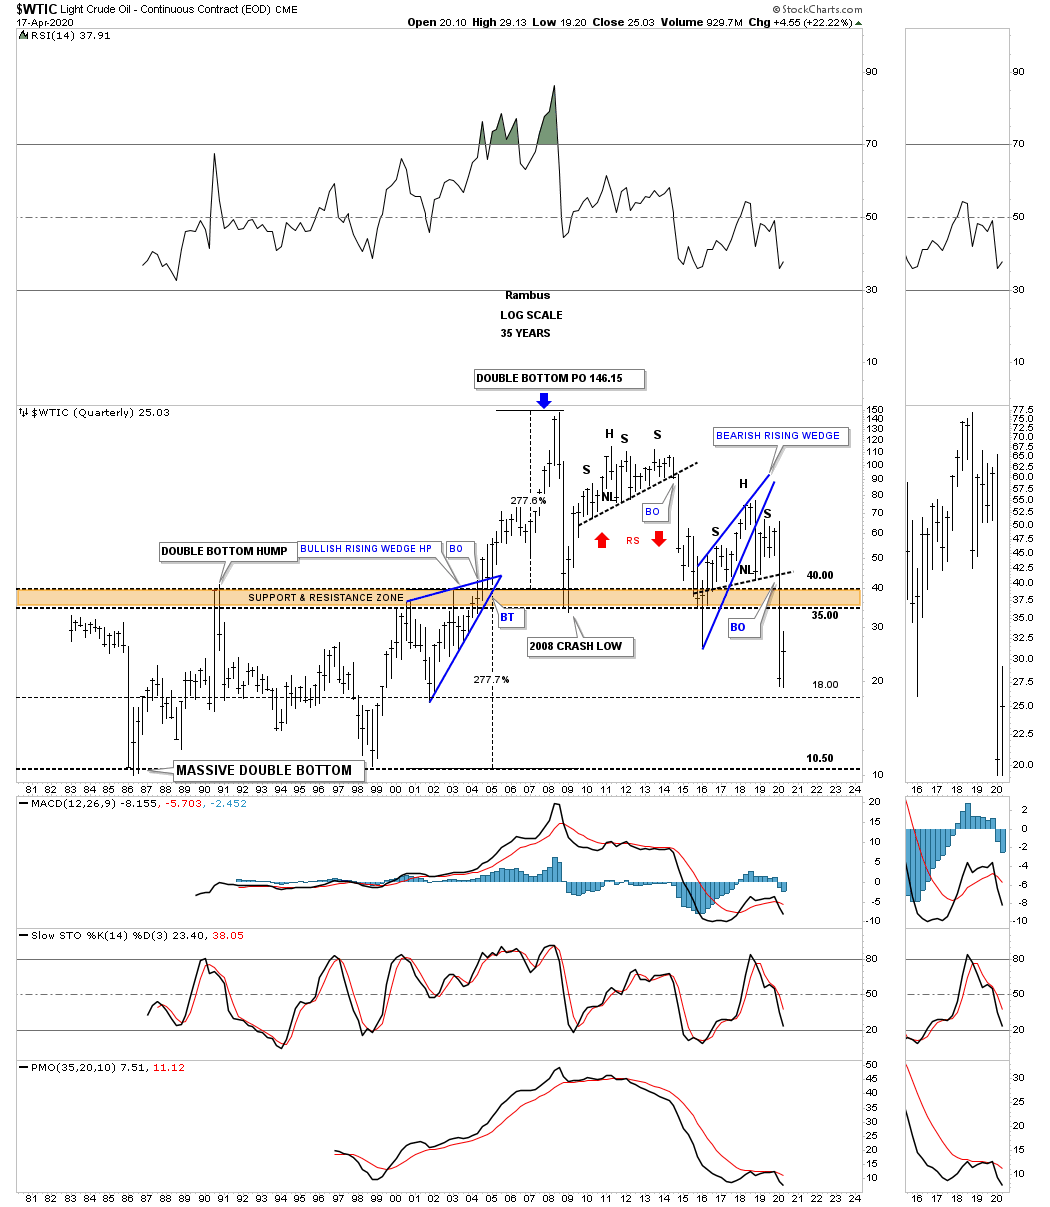
This last chart for WTIC is a 35 year quarterly chart which shows some classic Chartology. From the early 1980s WTIC formed a massive double bottom which finally completed in July of 2004 which launched oil on its parabolic run to its all time high at 147 in July of 2008. Note the width of that massive double bottom which was 277%. When you add 277% to the double bottom breakout point above the double bottom hump trendline you get a price objective up to 246. As you can see the 2008 high came just in time for the 2008 crash during that deflationary decline. You can see how the 5 year H&S top we just looked at on the chart above fits into the big picture. The red arrows show you a good example of reverse symmetry, how oil went up is how it came back down over the same area.

Just like the CRB index we looked at earlier I was looking for support to come into play at the brown shaded S&R zone and just like the CRB index the price action punched through a bit before reversing back up. Like most commodities at that time oil bottomed in January of 2014 and began to build the blue bearish rising wedge which ended up being part of the classic H&S top. During the formation of a classic H&S top the left shoulder and head form inside of the rising wedge with the right shoulder high forming around the bottom rail on the backtest. Is it possible that WTIC is going to reach its all time lows going all the way back to the 1986 low before this deflationary cycle is finished?

Below is the weekly combo chart for many different commodities indexes we’ve been following. I’ll let this chart speak for itself.

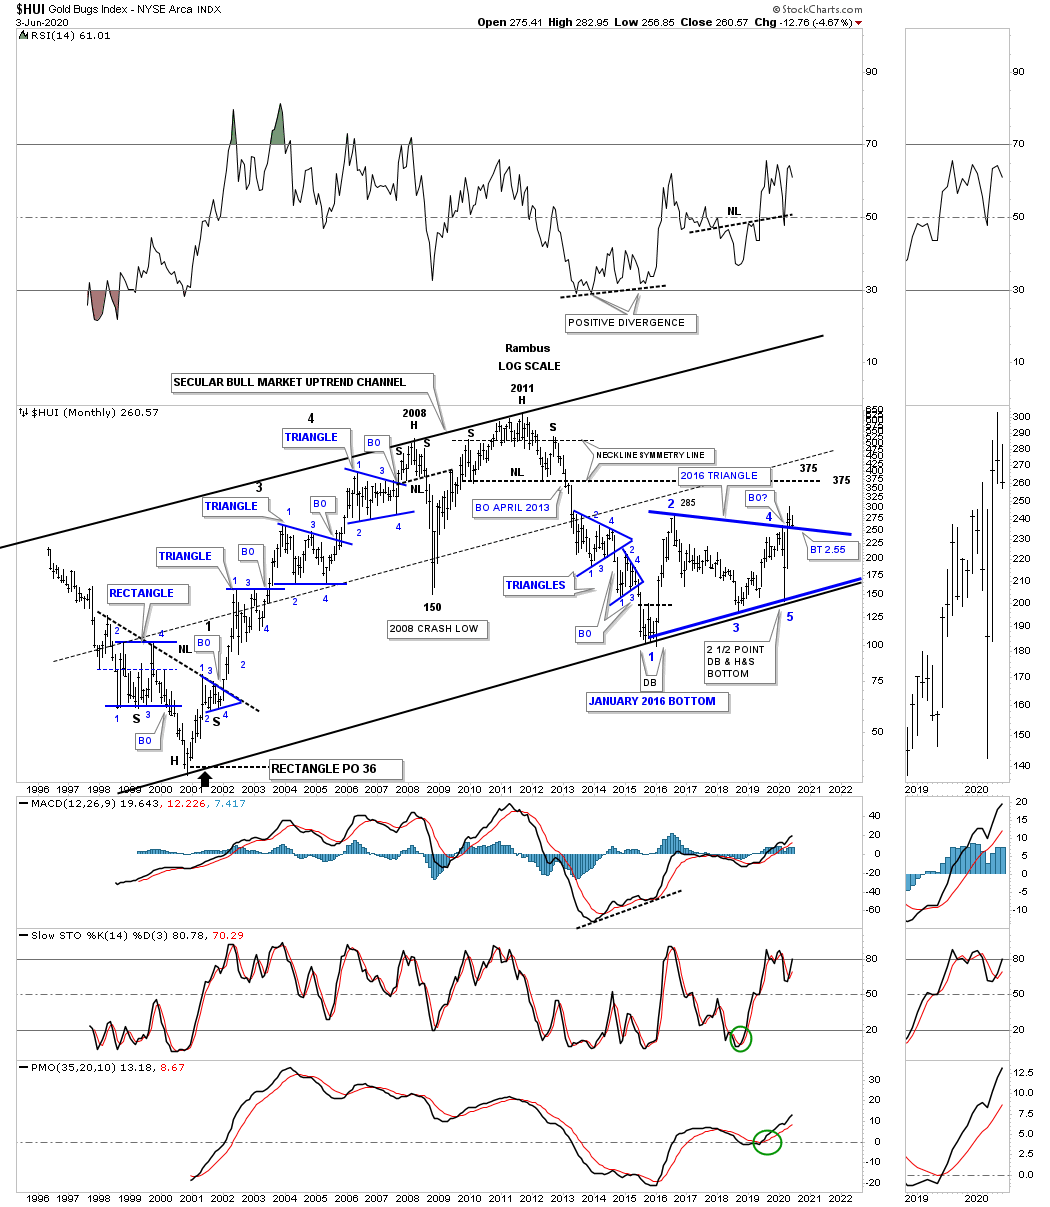
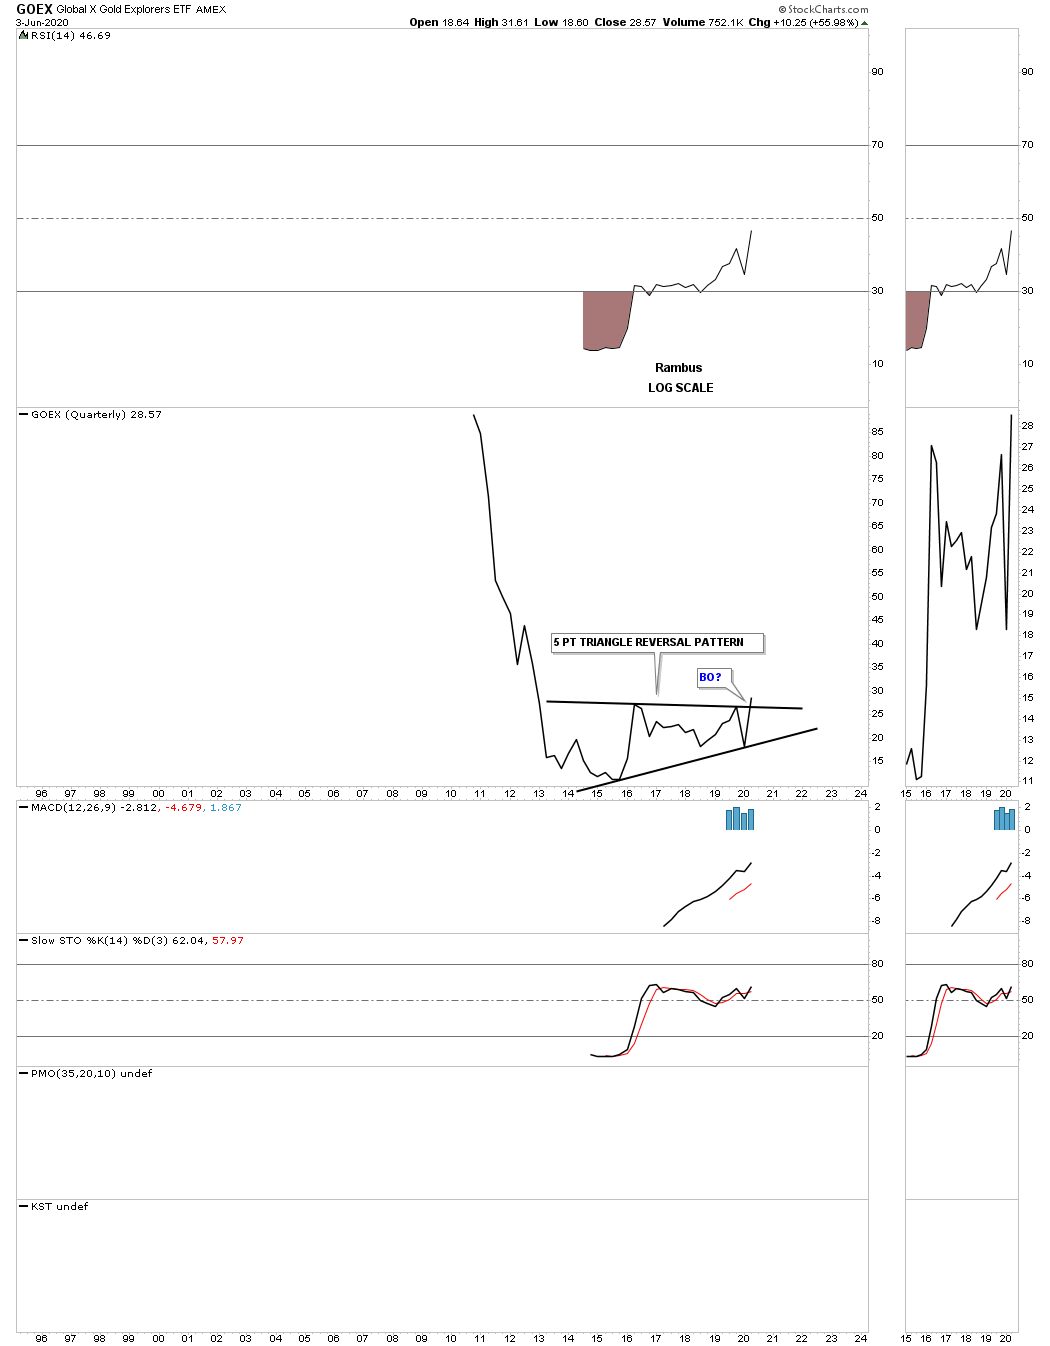
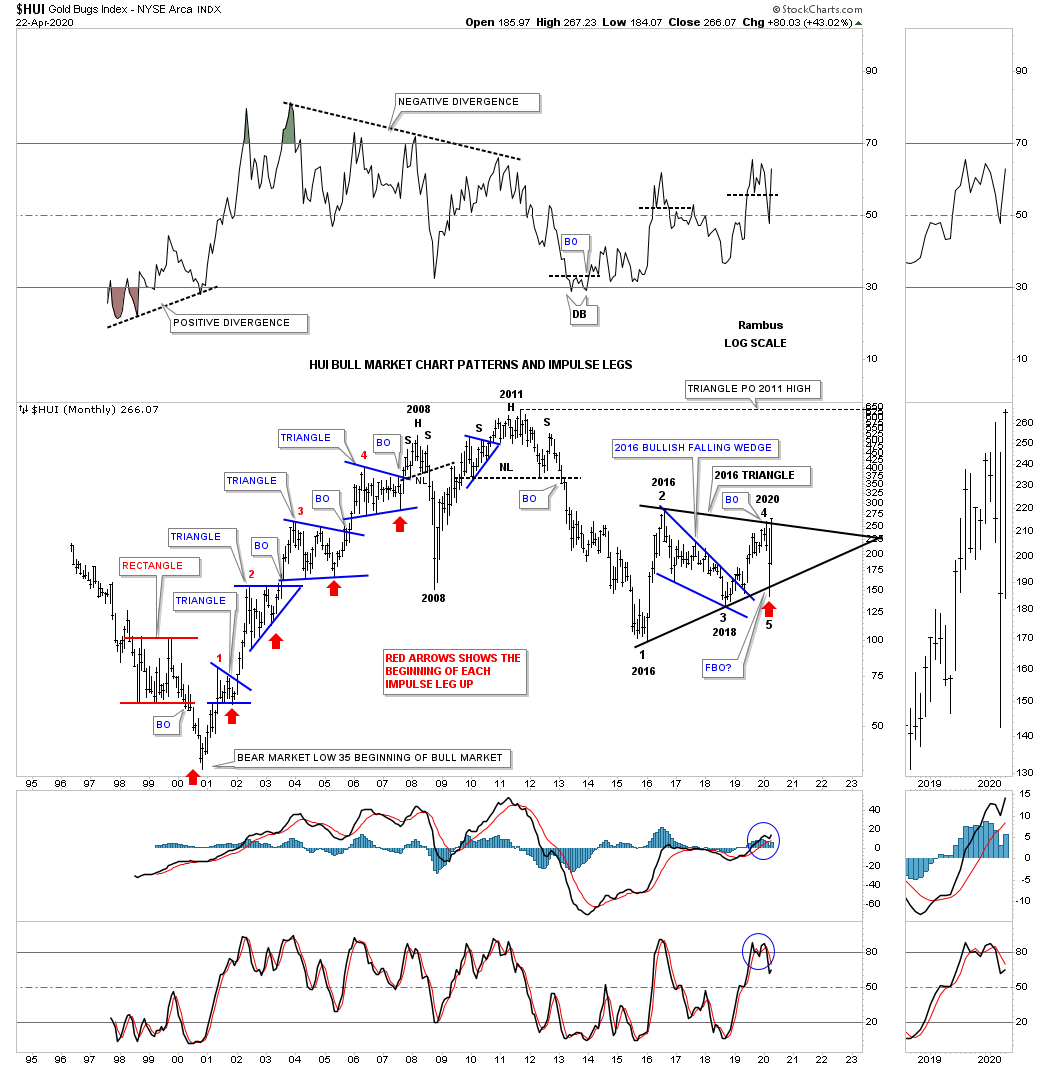
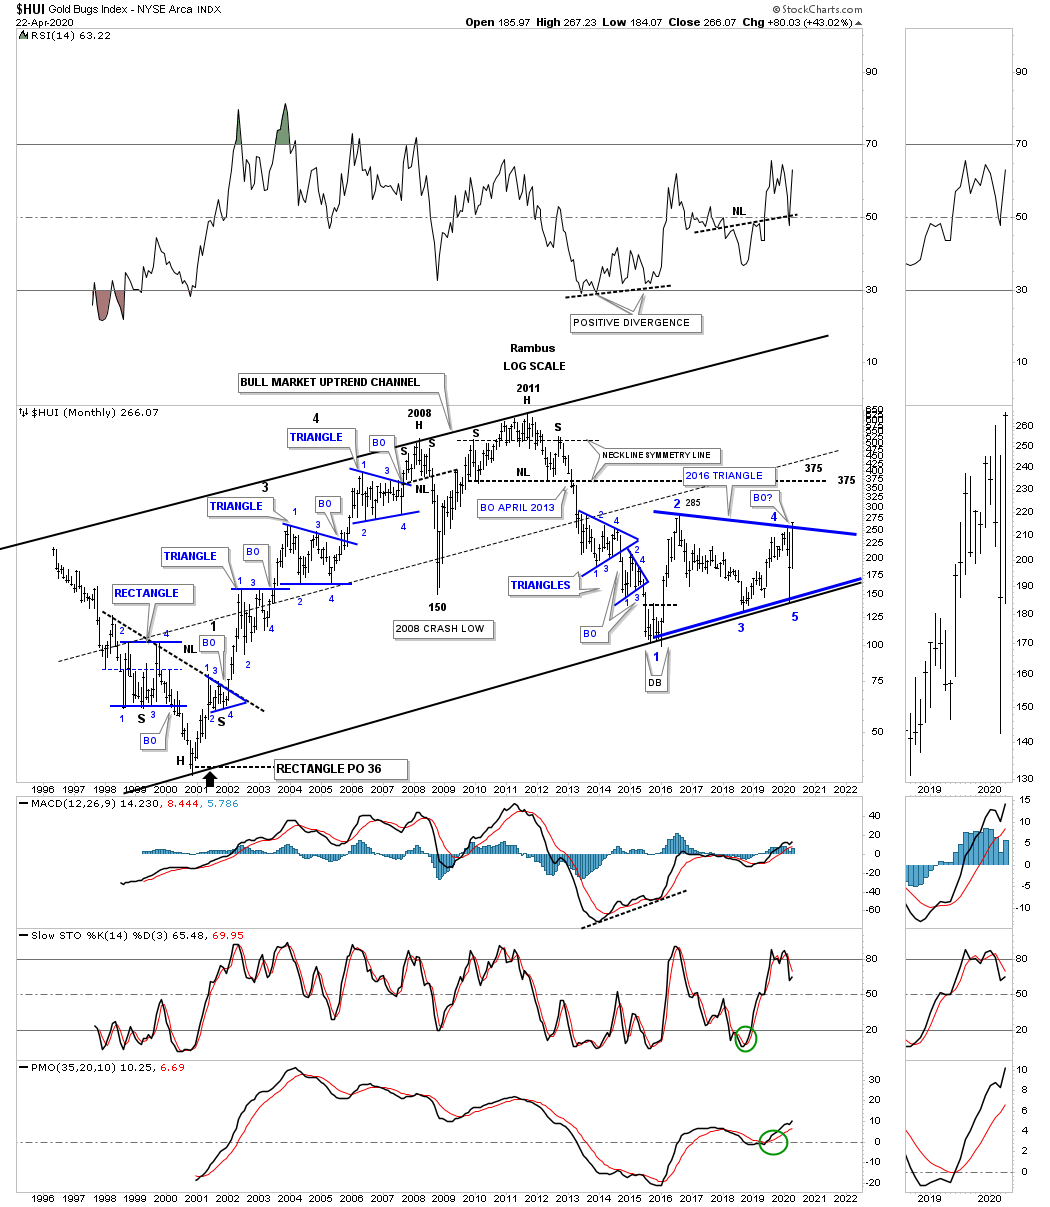
There is one last chart that I needed to get posted tonight which is a long term monthly chart for the HUI. All I can say is watch the bottom rail of the 2016 black triangle. Last week the HUI completed 4 reversal points which makes the black triangle a consolidation pattern to the downside. This is where the bulls have to step up to the plate in no uncertain terms and rally the HUI off that bottom rail to avoid a breakout. Please everyone stay safe and watch out for your family and friends. All the best…Rambus


Markets Update…The Fastest Decline in History

Yesterday I showed you the double top on the PM stock indexes that was just beginning to show itself. Today we got confirmation in no uncertain terms the double top is valid. Below is a weekly line chart which can take out some of the noise a bar chart can make.

Below is a weekly bar chart for the GDX which is getting close to testing the bottom rail of the 2016 triangle around the 19.75 area. What is so important about the bottom rail at 19.75 is a touch will complete the 4th reversal point putting the triangle into the consolidation pattern to the downside. On the other hand if the bottom rail can hold support at 19.75 then we could see a 5th reversal point form which would be complete when the top rail is hit and then broken.

Below is a longer term monthly look at the GDX which shows a potential much more bearish setup than the chart above.

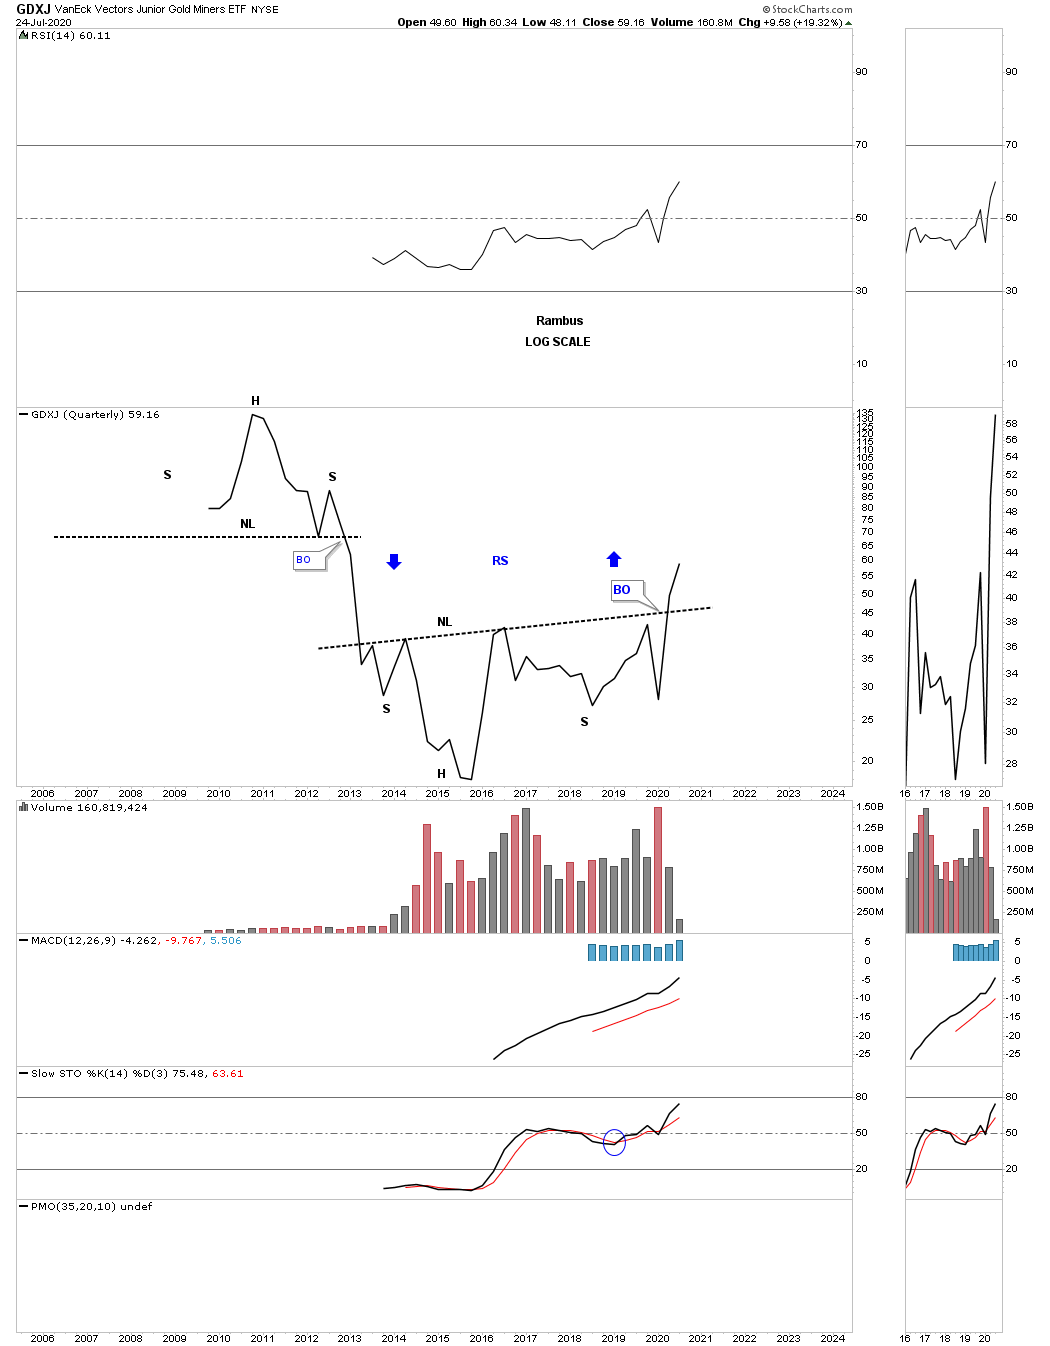
The GDXJ is setup just a bit differently but all the same pieces of the puzzle are still there. Keep a close eye on at the bottom trendline at the possible 4th reversal point.

This last chart is the daily combo chart for the US stock markets we’ve been following for a long time. If you recall this fastest decline in history began with the unsuspecting double top which didn’t look that terrible at the time. The thing about double tops is that they are first a reversal pattern. Form that point there is no way to know how powerful it will end up being. Remember that small double top that formed on the PM stock indexes last August which still hasn’t been broken. I also suggested if this rising wedge plays out the way it is supposed to then we could see a waterfall decline to where the bearish rising wedge began to form which was at the Christmas Eve low on December 24th 2018 at a minimum. As you can see that low is giving way now on many of the indexes.


Weekend Report…Energy Complex Deflation Was All in the Charts

I promised you on Friday that I would take an in-depth look at the energy complex in the Weekend Report. If there is one sector to define the possible deflationary event we’ve been discussing for the last several months or so oil is probably the most important commodity of all. Eventually we’ll know the cause in no uncertain terms, but the charts have been suggesting for a long time now that something is afoot and we need to pay attention.

Lets start by looking at the UNG, natural gas fund, as it has been leading the way lower. This first chart is a 10 month daily look which shows a 6 point diamond consolidation pattern which at the time of its development I thought would probably be a reversal pattern to the upside as the price for natural gas was already so low. As you know I usually try to take one position on the initial breakout and a second position on the backtest. I missed the initial breakout and the backtest failed to reach the bottom rail of the diamond so I never got positioned. The other important feature on this chart is the blue bearish falling wedge which we know shows up in fast moving impulse moves.

This 6 year weekly chart for UNG is the chart that really got my attention for the energy complex. Once the 6 point diamond gave way to the downside that strongly suggested that the bottom rail of the 2016 flat top expanding triangle was also going to break to the downside as well. The breakout came on December 9th of 2019. If you look real close you can see a ping pong move that took place between the bottom rail of the 6 point diamond and the bottom rail of the 2016 flat top triangle before the actual breakout as shown by the blue circle.

It is always important to tie everything together by looking at a long term monthly chart. Below is a 12 year monthly chart which shows the previous consolidation pattern that  formed between 2012 to 2015 which was a bearish expanding rising wedge. The importance of that pattern is that it gives us a way to measure for a price objective using the 2016 bearish flat top triangle as a halfway pattern. I haven’t put the price objectives on this chart but the two methods I use measures out between roughly 5 and 8 dollars.

I also look at the $NATGAS, which is showing a bear flag on this 5 year weekly chart.

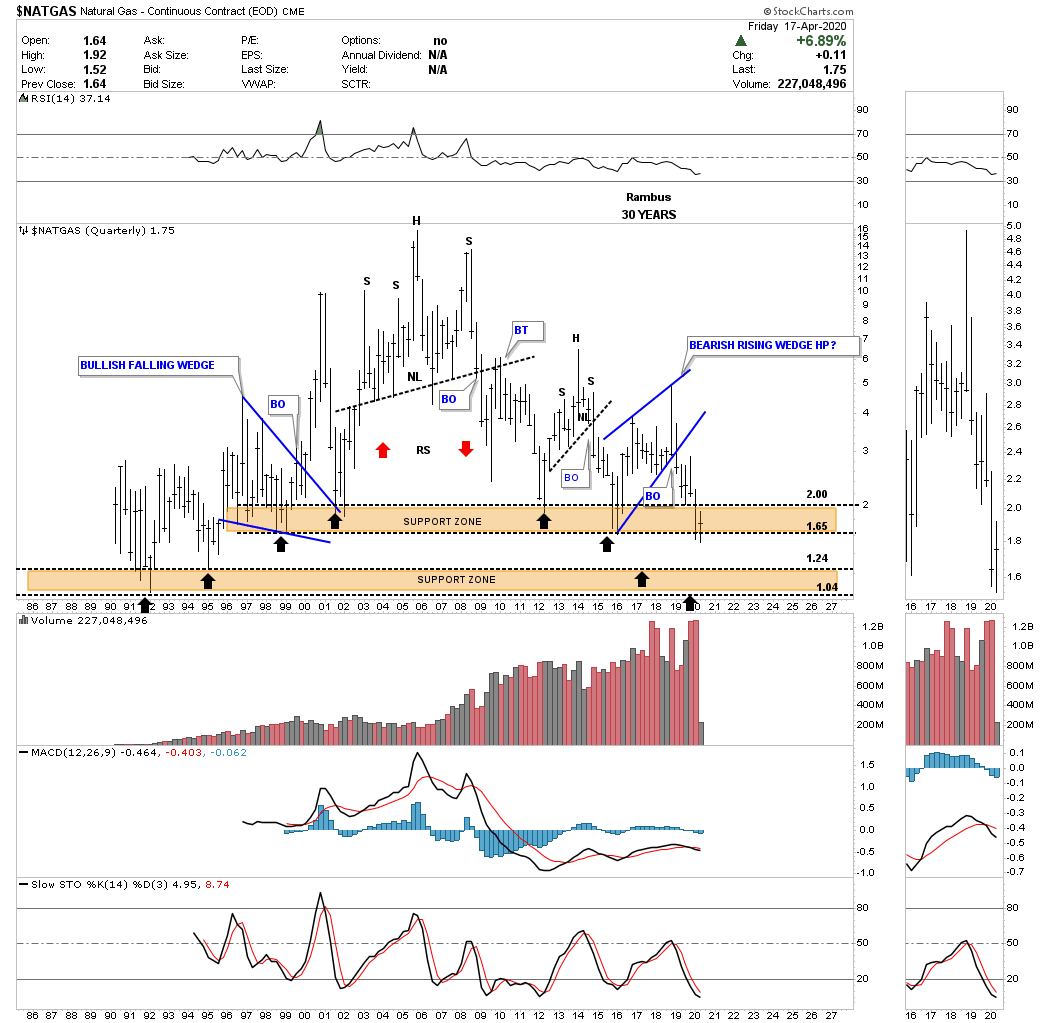
This 30 year monthly chart for $NATGAS shows it has been in a bear market since July of 2008 when it completed the  head of its massive H&S top. Currently the price action is sitting on the massive support and resistance line that goes all the way back to September  of 1995 as shown by the black arrows.

Back in 2014 when I originally built out this quarterly chart I had 2 possible price objectives  based on the 2 brown shaded S&R zones. As you can see natural gas finally found support at the bottom of the upper brown shaded S&R zone at 1.65 where it has been consolidating that impulse move. The absolute low for this natural gas index came in 1992 at the 1.04 area which would not surprise me if we see that low hit again during our current selloff.

Next lets look at some charts for the USO, oil fund, which we were able to get positioned Short with DWT. This daily chart shows a perfect one year triangle consolidation pattern with a breakout and a perfect backtest to the bottom rail.

At the beginning of this report we looked at the weekly chart for the UNG which showed its 2016 flat top expanding triangle which gave me a very big clue, when it broke below the bottom rail, that it was going to lead the energy sector lower. Below is the weekly chart for the USO which broke below the bottom rail of its 2016 bearish expanding rising wedge 2 weeks ago. There was also a ping pong move between the bottom rail of the 2019 blue triangle and the bottom rail of the 2016 expanding rising wedge. Early last week USO backtested the bottom rail of the 2016 bearish rising wedge which has now cleared the way for the impulse move to take hold. The bottom line is that we have a very clean line in the sand at the 10.20 area.

Similar to the long term monthly chart we looked at for the UNG, USO has formed a similar  halfway pattern. The impulse move down from the 5 year triangle took almost 18 months to complete starting at the breakout point. The blue circle shows a halfway pattern that formed which was actually an expanding triangle.

Lets take a look at a weekly chart for the $WTIC, light crude oil, which is showing it has formed a 2016 H&S top with the neckline being broken to the downside last week.

Below is a long term 20 year monthly chart which puts the 2016 H&S top in perspective. I won’t be surprised if the WTIC reaches the bottom rail of the 2008 falling wedge.

I originally built out this 35 year quarterly chart at the same time I built the long term quarterly chart for UNG. Back in the middle of 2014 UNG was beginning to breakdown from its 5 year H&S top just like many other commodities. Since the move up was so vertical after the 2008 crash I was looking for some reverse symmetry to the downside over the same area on the way up as shown by the blue arrows. The brown shaded support and resistance zone is formed from the previous highs made between 1985 and 2004 when oil finally broke out above that massive resistance zone and ran straight to 147. Note how the current price action has formed a classic H&S top with the left shoulder and head forming inside of the blue rising wedge and the right shoulder high forming towards the backtest point.

The $XOI, oil index, I follow which is breaking down from 2 important trendlines, the bottom rail of the 1985 uptrend channel and the bottom rail of the 5 point triangle reversal pattern.

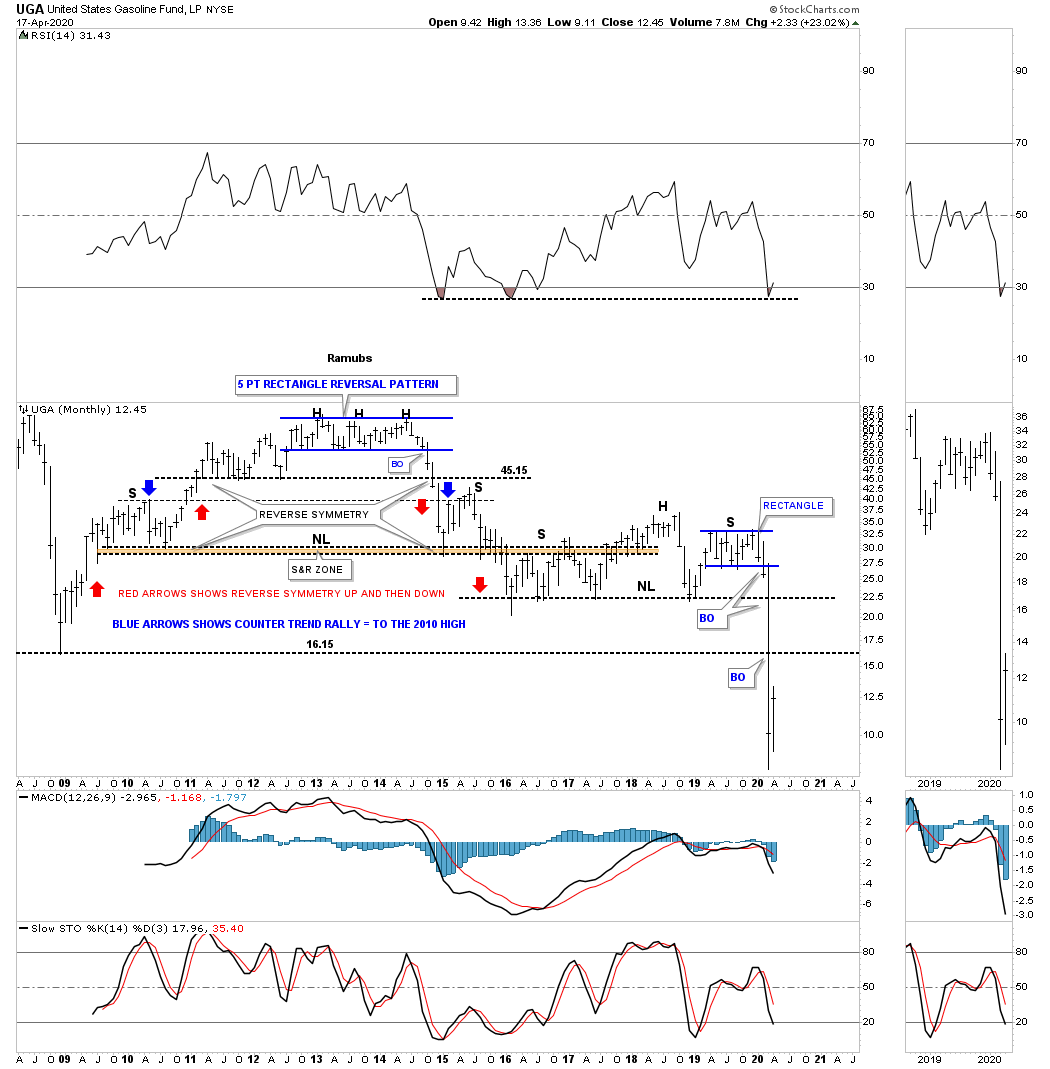
This last chart for tonight is a long term monthly chart for the UGA, US gasoline fund, which is beginning to breakdown from a 5 point blue rectangle that is forming toward the apex of its 2016 triangle. The blue rectangle is strongly suggesting the bottom rail of the 2016 triangle is going to give way.

The last time we had a deflationary event was form the middle of 2014 to March of 2015 when many of these long term charts were made. I’m still amazed how these long term chart patterns could see way back then that deflation would be the issue and not inflation.

Time to get this posted. All the best…Rambus
PS:

I don’t know if I’ve ever showed you this combo chart for some of the smaller cap energy stocks. You can see how bearish many of these stocks look as they are breaking down from bearish falling wedges and bearish rising flags and wedges which show up in strong impulse moves.


Special Report- Plunger’s Post Bubble Contraction Finally Arrives

I would like to put out a quick special report to update you on the big picture in light of all of the market turmoil and provide some of the concepts which may suggest where we are going from here.

First off I you were reading these reports in the late summer of 2018 I put out a 3-part series on the Post Bubble Contraction (PBC).  Well the PBC has now arrived.  Of course it was virtually impossible to predict when it would finally get triggered since it was the FED fueling the bubble for as long as they could.  But it appears the bubble has finally been pricked by a black swan from left field.

The below concepts you have all heard from me before, but now we see them actually unfold, so let’s review them again.

The Stock Market Top is in…But the Bear Market actually began on December 14th 2018.

December 14th, 2018, according to Dow Theory Methodology, was the date that a bear market sell signal was triggered, announcing that we were now in a bear market.  This valid signal only occurs in Phase III of a bull market.  Since then, despite the wild blow off top to new Dow highs the sell signal was never reversed and remained valid.  To reverse the signal would require the transports going to new highs along with the Dow. Since this never occurred the signal remained in affect.

This has been a topping process where the FED again intervened aggressively into the market with their monetary bazooka after the Dow sell signal.  The effect was to levitate the markets for over an additional year, but were not able to reverse the DT Sell signal.

A tenant of DT is that once a valid DT sell signal is triggered the bear market goes to completion.  What that means is that the bear market progresses until the price level has fully discounted all of the ills in the economy.  This is what is now occurring.

This entire process of the past 15-17 months reminds me of the call by Richard Russell back in 1966 that a bear had begun. The market then underwent 3 cyclical upswings (call them cyclical bull markets) before the final washout came in November 1974.  He was doubted and ridiculed during the whole time, but ultimately his stance proved to be the correct call and saved his subscribers.  Dear Investors, the market has been in a bear market since December 14th 2018, but FED intervention masked what was really going on under the surface, but Dow Theory ferreted it out.

Mr Charles Dow has spoken so where to now?

I challenge you to find a bull market where volume shrinks throughout the entire uptrend in price.  I have only found two.  The bull market of the past 11 years and the bull market from 1932-1937.  Back in the 1930’s it was believed that the government was “spending us out of the depression”.  Does this sound familiar to you?  Yes, it’s what the FED and government have been doing now for 12 years.  In other words it has been an artificially engineered bull market where  artificially low rates allowed borrowing to fund stock buybacks.  This boosted the market and lowered the share count, leading to lower volume.

With less liquidity in the market due to lower volume price gaps open up due to the vacuum that exists once the market begins to fall. We are now beginning to see this.

Note below the trend towards lower volume:

The throwover top in late 2017  recorded the highest RSI reading in 120 years of stock market history, (by far , by the way) Note the divergence which occurred with the recent price peak.

Now let’s look at that 1937 bull market and see how it compares and how it resolved itself:

The volume is much more erratic, but the trend was down over time. The next chart zooms in on the bear market which followed:

This was a relentless 50% decline in 12 months… let that sink in for a while.

As a matter of interest here is what the 1920’s looked like and the initial sell off in 1929.  Could we be in for something like this?

I am now going to post some highlights from my PBC series from the summer of 2018. You can go back and review these as they were posted beginning in August 26, 2018.

I referred to the piece written by Dan Oliver

Oliver claims the contraction has now begun and it will be different than the WFC we saw in 2008.  My view is it will appear like a mix of the 1997 Asian crisis, the 2000 dot-com bubble and the 2008 credit crisis all rolled into one.  Yes, it will prove to be much worse than the 2008 WFC.  Although the central banks of the world successfully reinflated the bubble, it will now be time to pay for it and the bill will be larger than 2008.   Why will it be worse?  Because the excesses are much larger and there is no longer a fire department to call since central bank tools are now exhausted.

A Contraction of Credit

We are now set-up for a classic world wide credit contraction.  The bubble expansion of the past 10 years has been driven by the intervention of central banks injecting credit into the world.  Recall that credit spending entails pulling future demand into the present.  If the free cash flows from that capital investment are not positive then when the future arrives that debt cannot be serviced.  That’s where the world sits right now.  Once the crisis gets rolling I believe the core of it lies in China.  For years they have been building ghost cities enabled by credit conjured from thin air.  I will offer only one chart representing the growth which is the increase of domestic credit.  Chartologists should quickly see that this is a parabola and we all know how parabolas resolve themselves.  This chart should put one on high alert.

The chart was the Aussie Dollar which since then has gone straight down.

Regarding what we now see occurring in commodities:

Over a 40 year period we see the secular bear in commodities from 1980-2001, then we see the effects of the China build out from 2001-2011.   Since then commodities have been deflating.  In 2015 the currency broke a 15 year up-trend line and has been backtesting it until recently. These are slow glacial moves but It now appears to have begun an impulse wave down.  It is resuming its downtrend in what may prove to be a half-way pattern.  Conclusion: a contraction in commodities lies ahead.

Regarding the USD this was posted back in the time where it was popular to trash talk the USD

The USD

In a  PBC money flows from the peripheral economies of the world back to the world’s financial centers.  It principally flows towards the senior currency which of course is the USD.  This is because it not only seeks safety and liquidity but it must service the debts originated in the financial center. These debts are denominated in US dollars so require the purchase of dollars for repayment. This is how foreign debts act as a synthetic short of the dollar.  So when the USD declined for the entire year of 2017 it seemed a conundrum.  The catcalls were heard daily that the USD was “toast” whenever the case was made for a stronger USD.  It appears now that the 2017 decline was likely just a correction of its upside move during 2011-2016.   The USD bull market, reflecting money flows towards it, now seems to have resumed.

The Long Bond as the best trade:

The Trade- Long the TLT

All of these market moves can be expressed in one single trade… go long the TLT.  We are not futures traders, so this is the most simple vehicle to use to align ourselves with the PBC at this time.  Later down the road other positions will present themselves, but for now the TLT is the #1 set-up.

Again the narrative is that rates are set to go higher which explains why there is a record short interest in the US 10 year bond which is betting rates are going higher.  These trades are based off a lack of understanding of the PBC and how money will flow towards the US Government bond.  Yes, I understand that cogent arguments can be made for a weaker bond due to the US governments massive financing needs.  This is a reality, but world wide money flows will dwarf this argument once the ball gets rolling.  Let’s take a look at what Mr. Market is signaling:

The below chart is a picture of the accepted Wall Street narrative.  Interest rates are set to go higher or said differently the TLT is about ready to break down.  We see the H&S building out right before our eyes.  But as Joe Granville used to say “what is obvious is obviously wrong!”

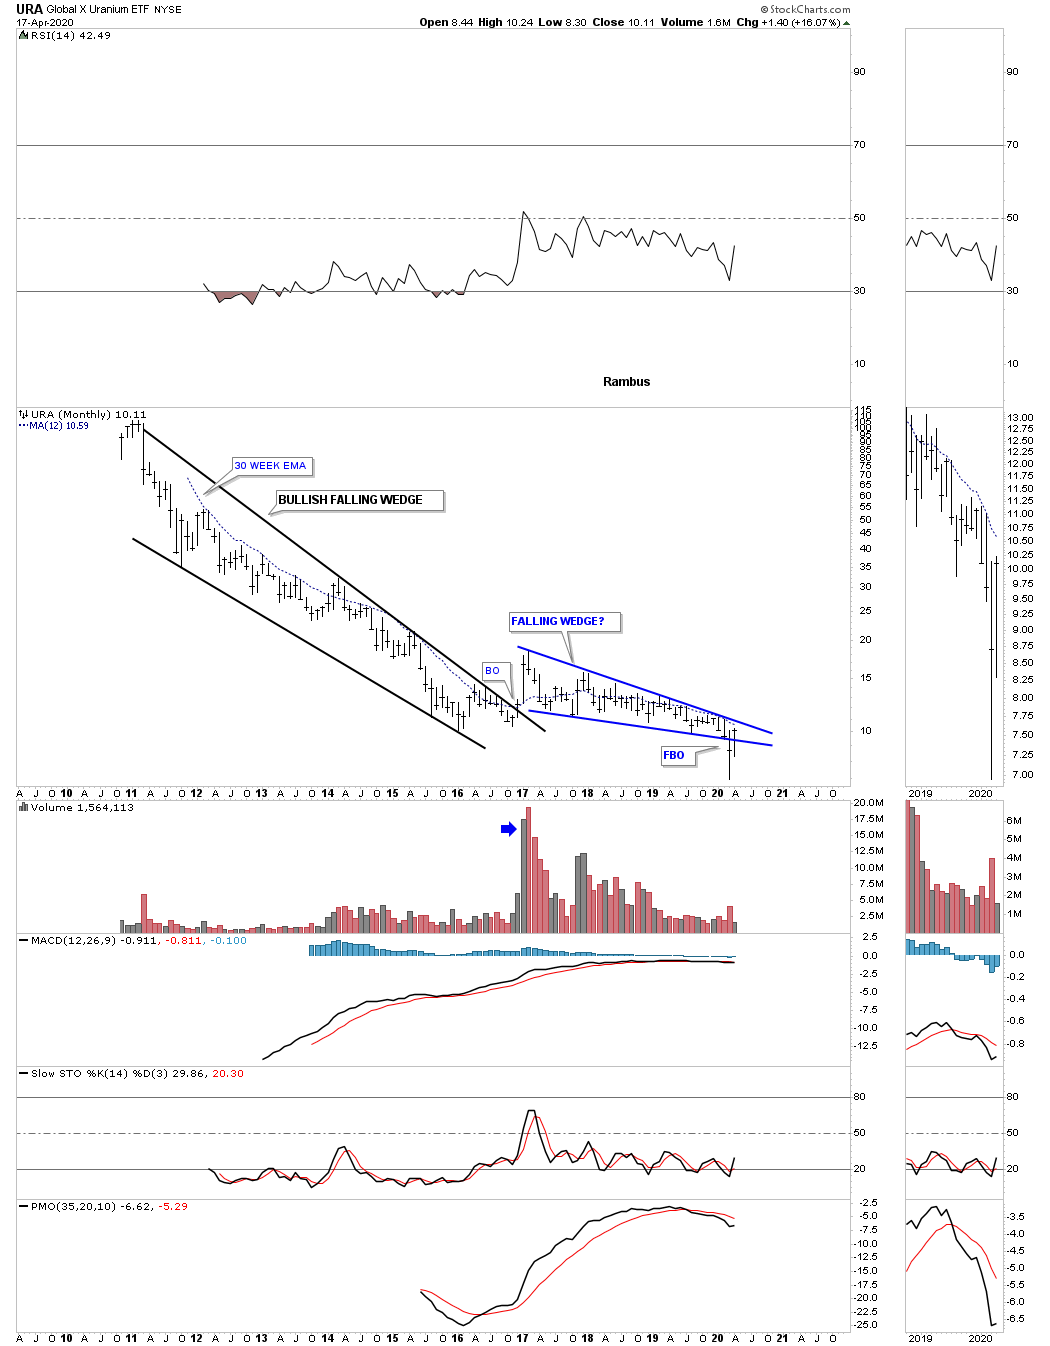
These passages are just some of the highlights from this series which I posted.  It outlined what was coming and gave actionable strategies that have correctly addressed how to position oneself for the upcoming PBC.  Oh I didn’t get everything right such as positioning into uranium, but as you know investing is hard.

If one had just bought the long bond and waited for the PBC to begin he would be miles ahead of everyone and be in the drivers seat.

So where to now?

We are now in a liquidity event.  I think everything goes down except maybe government bonds. Gold and silver stocks probably get hit further from here. Expect the stock market to go to shockingly lower levels in this first leg down…Perhaps S&P 2,000.  But once this first leg down in the market is over the gold stocks resume their bull uptrend and the PBC dynamic begins to kick in.

Below we see the Gold to Oil ratio.  Oil is at least 30% of the input costs to mining extraction.  So with costs going down and gold eventually going up the profits flow to the bottom line and fuel the bull market.

GDX the immediate horizon:

As mentioned, the gold stocks are caught in the market collapse and they are stocks after all so lower levels are likely.   So here is my forecast:

In the next leg down the GDX is likely to fill its tan colored open gap above 24.  We can use the recent downside gap in the chart at the 200 EMA as a mid range point in the current down move.  This measures to about where the unfilled gap is at the 24 level. Once this gap is filled around 24 that’s the all clear to pile back into the market and the positive part of the PBC begins.

Meanwhile stay out of the general stock market as Mr Bear is in town.

Good Luck

Plunger.


Editor’s Notes

1…Plungers Epic One of a Kind Analysis on the post Bubble Contraction is preserved on the sidebar ( scroll down) for those new members interested and for those who would like to review it.)

2…Plunger hangs out at the chartology forum and is holding court there if you have any questions

3…Who is Plunger ?

https://goldtadise.com/?p=435881

Yen / PM Combo Chart Update…A Most Surprising Outcome

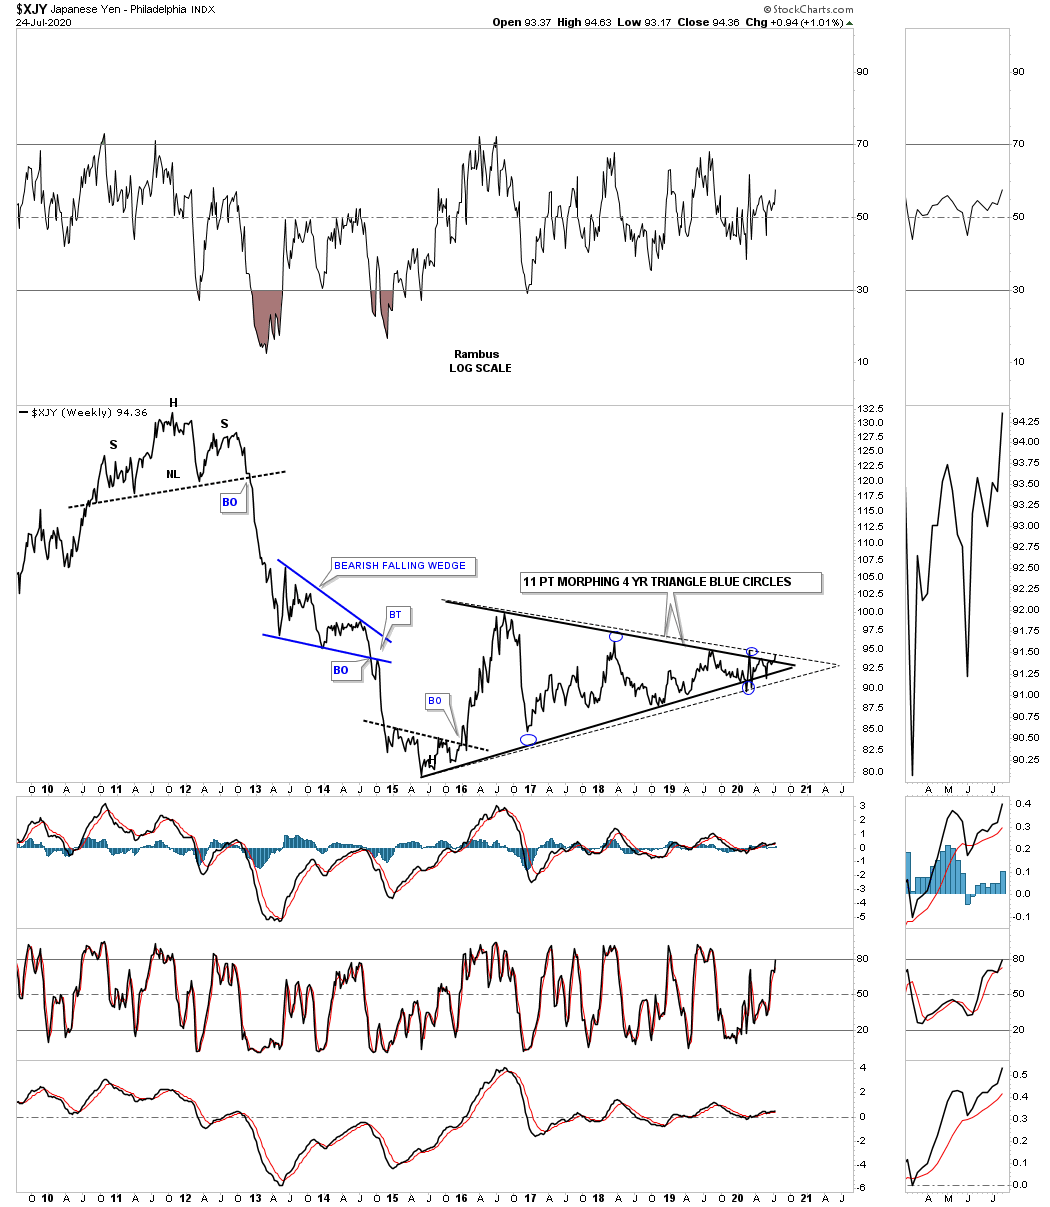
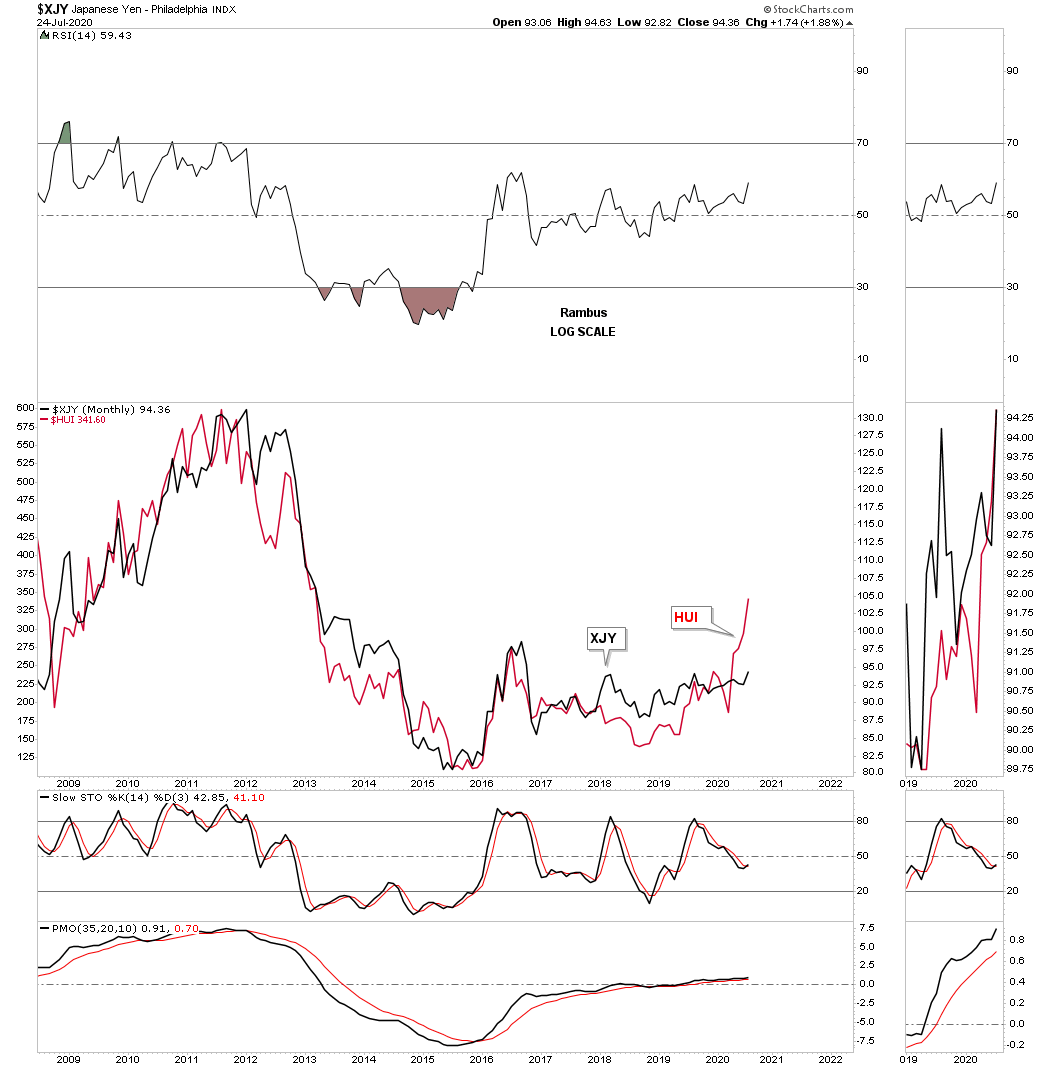
Just a quick update on the Yen / PM combo we’ve been following. Today the yen is moving lower in its new impulse move to the downside doing away with the positive correlation it used to have with the PM complex. While the yen is moving lower more PM stock indexes are breaking out to the upside. I just wanted to post this combo chart early so you can follow the breaking out and the backtesting process in real time.

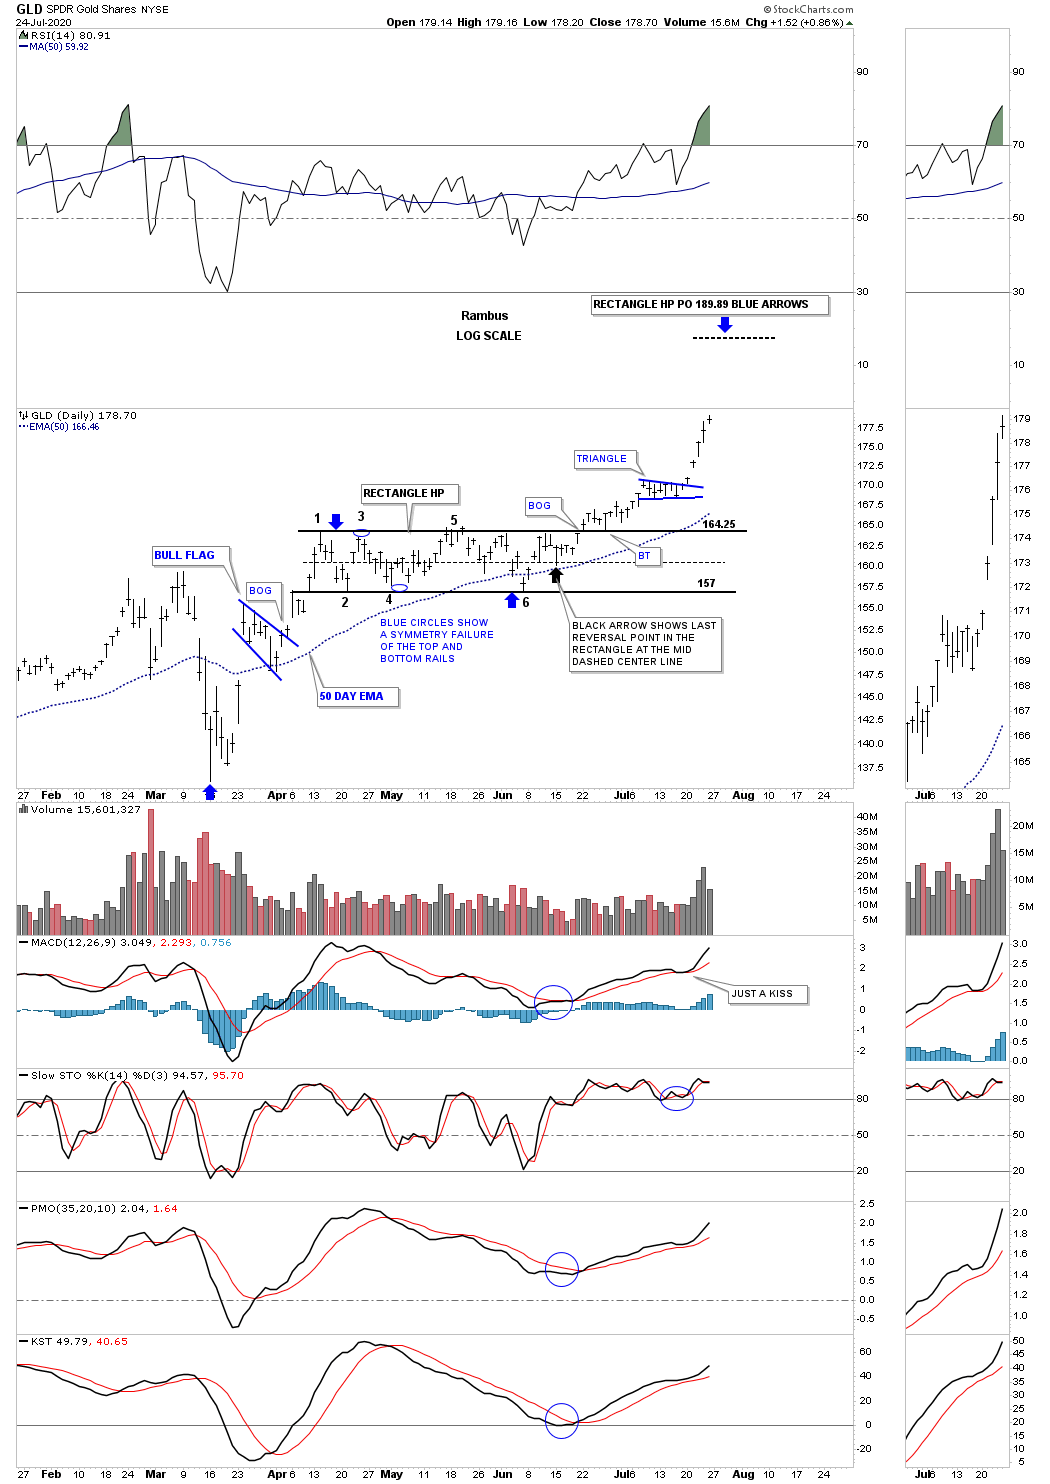
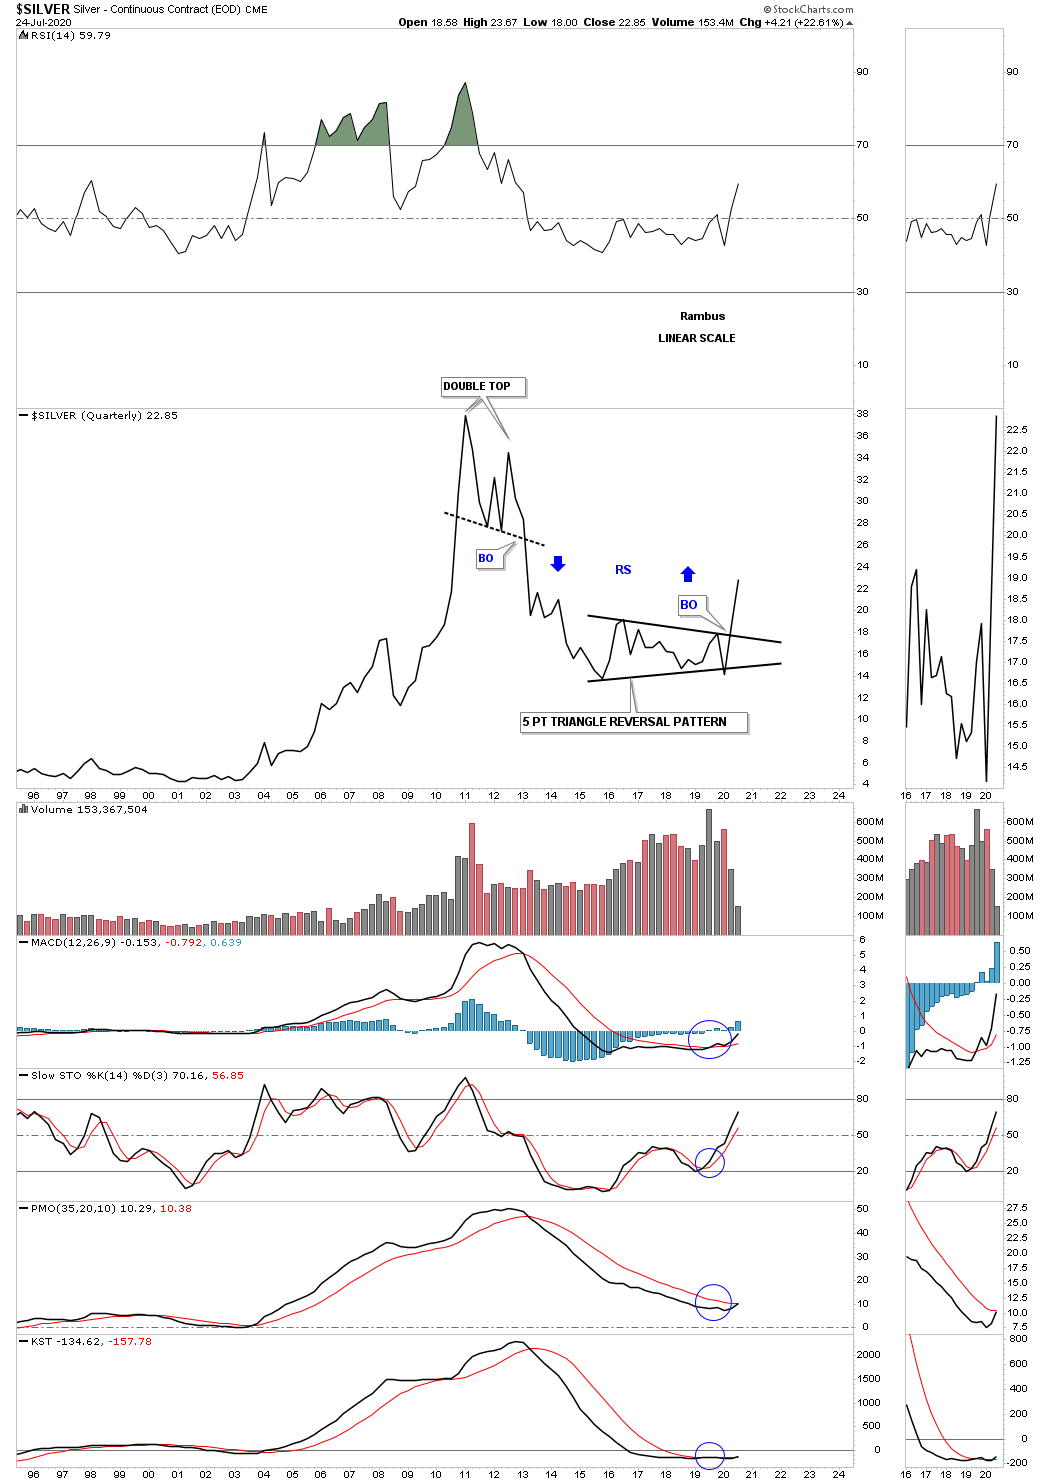
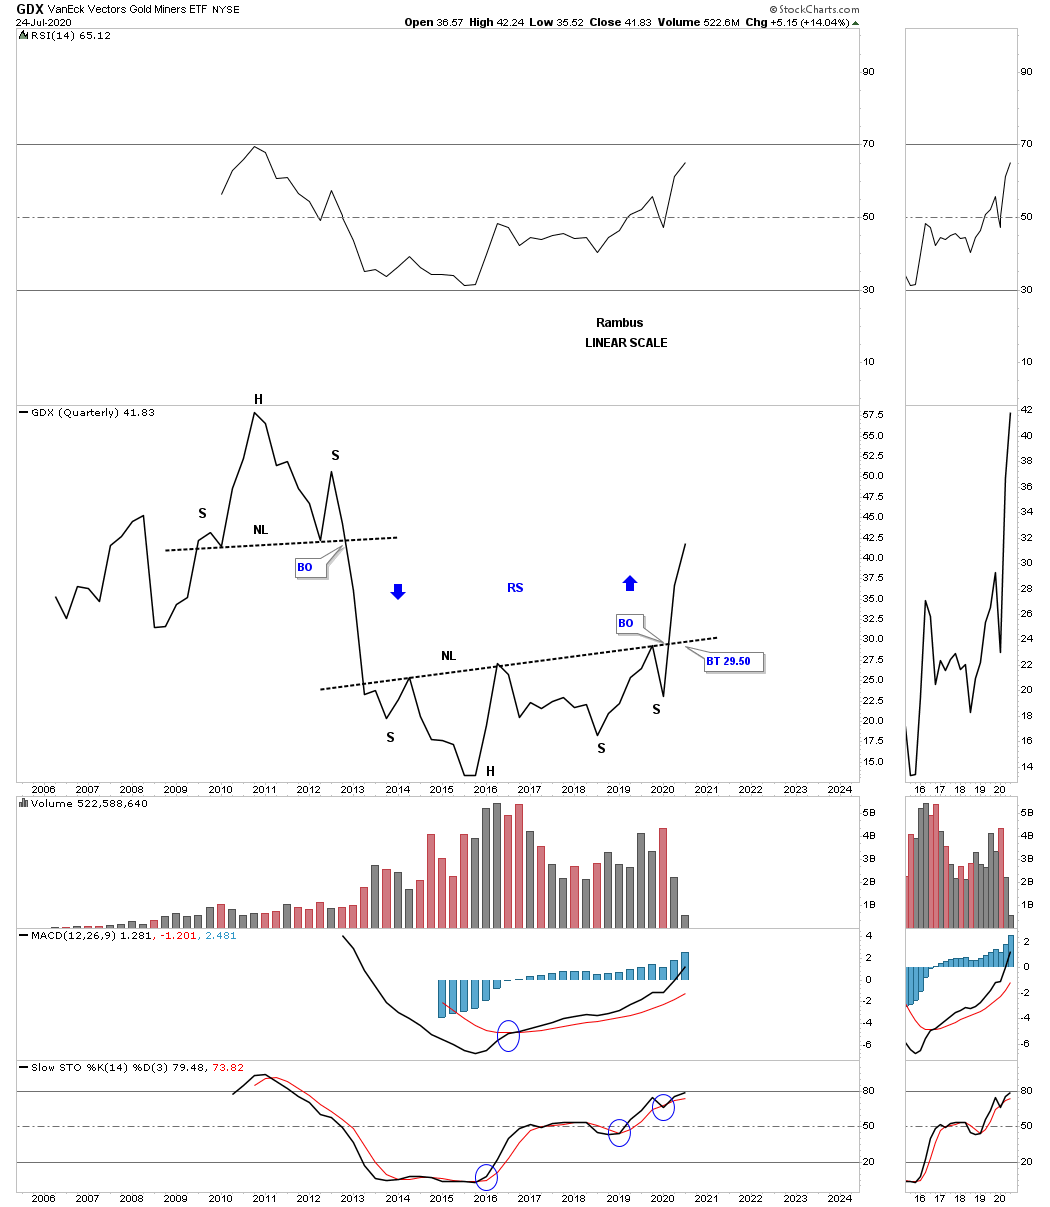
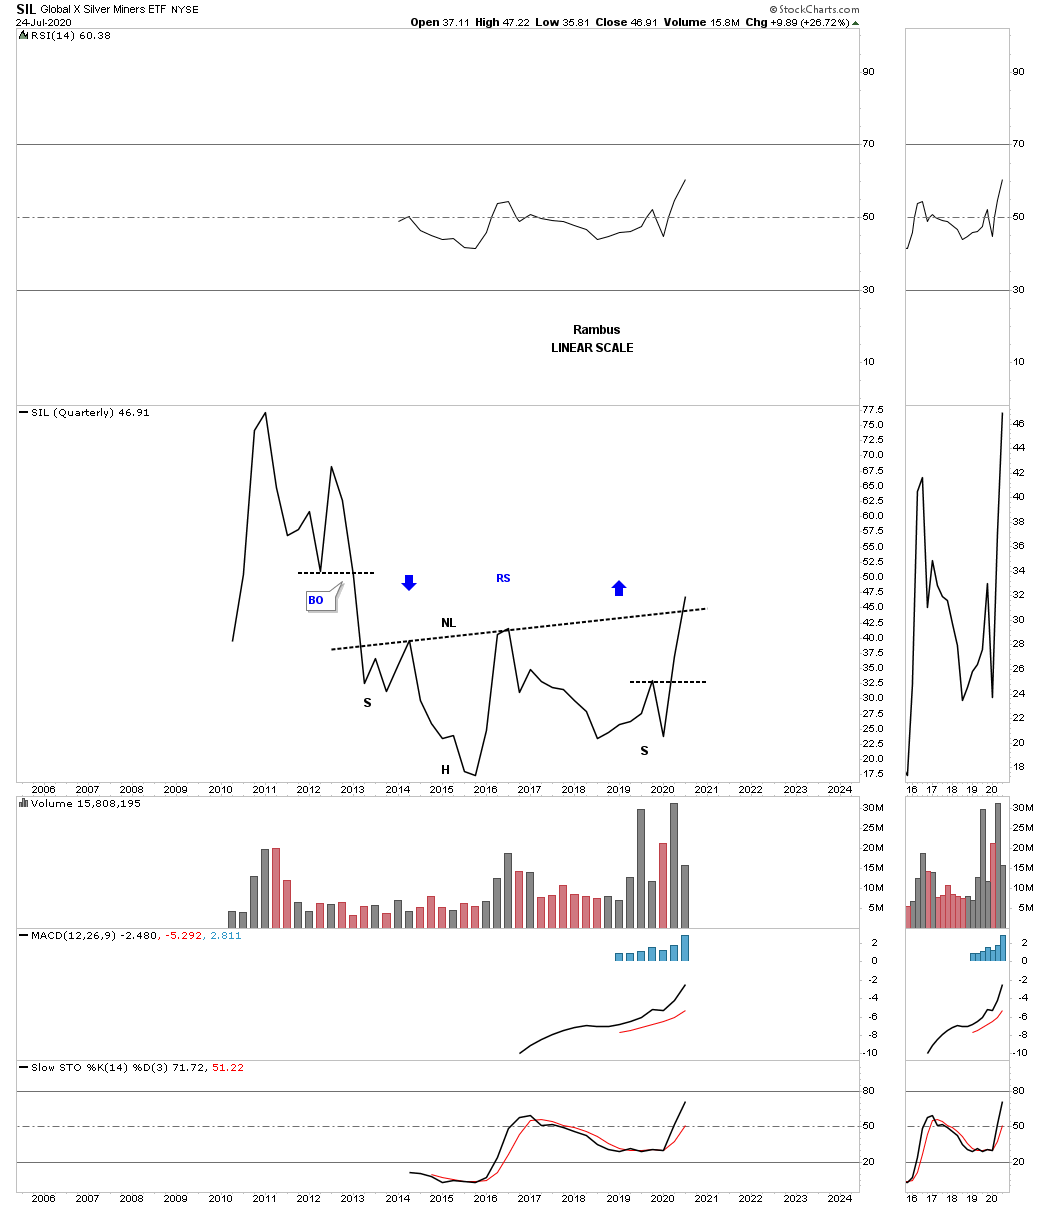
Note SLV which hit its neckline today and is backing off a bit. This tells us the neckline is properly placed. With the other PM stock indexes breaking out above their 6 month H&S consolidation pattern it is now just a matter of time before SLV will join the party. After 6 months of consolidation we are finally seeing the results with most of the PM stock indexes building out a H&S consolidation pattern with a few bullish rising wedges. Today the XAU and the HUI are touching the top rail of their blue bullish rising wedge while GLD has already broken out of its bullish rising wedge. I had just enough annotations left to add XGD.TO to the combo chart for our Canadian friends which has already broken out of its H&S consolidation pattern and is hitting new highs today.

Markets Update…Positive Action in the Gold Complex

Over the last few weeks or so I’ve been writing a lot on the critical inflection point the PM complex was showing us. Today’s price action is an important step in confirming the potential bullish outcome. There is still more work to be done from a longer term perspective but its one step at a time until total confirmation is attained.

Lets start with the daily line combo chart we’ve been following very closely which shows many of the smaller blue trading ranges that are breaking out today. As you know I’ve been looking for one more decline back toward the bottom of the August 2019 trading range to complete a possible 4th reversal point. You can use the HUI as a proxy for the rest of the PM stock indexes which shows where the possible 4th reversal point would be.

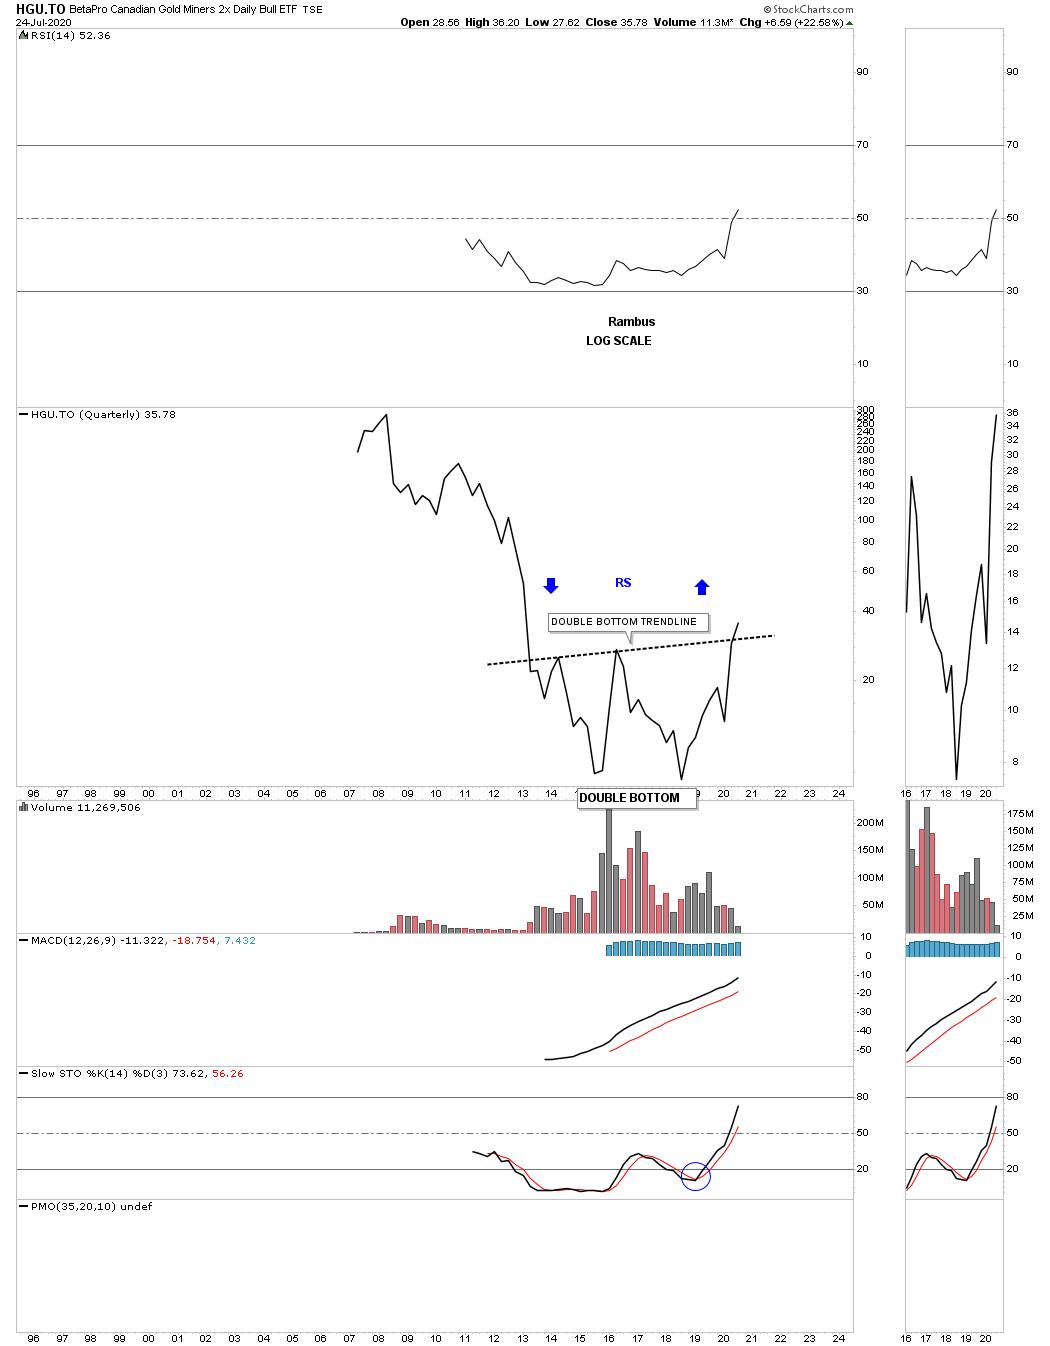
If we don’t get that 4th reversal point and the PM complex rallies strongly above its August 2019 high then the trading range will have to be either a H&S consolidation pattern or a cup & handle. Note the CDNX which looks like it is trying to put the finishing touches to its 2019 H&S. The GLD is still the strongest area within the PM complex as it is hitting new highs for this rally phase. The 2 Canadian etf’s have been building out a nearly 5 month parallel rising channel. Those types of patterns can breakout in either direction but todays price is suggesting that the HGU.TO is likely to breakout to the upside as it’s cracking the top rail today.

This next chart is the weekly combo chart for the PM complex I’ve been posting at the end of the week which shows the potential H&S consolidation patterns that have been forming. So far none of the possible H&S consolidation patterns have given way yet. It looks like the GDXJ may be one of the first PM indexes to takeout its neckline which would be bullish for the rest of the PM complex.

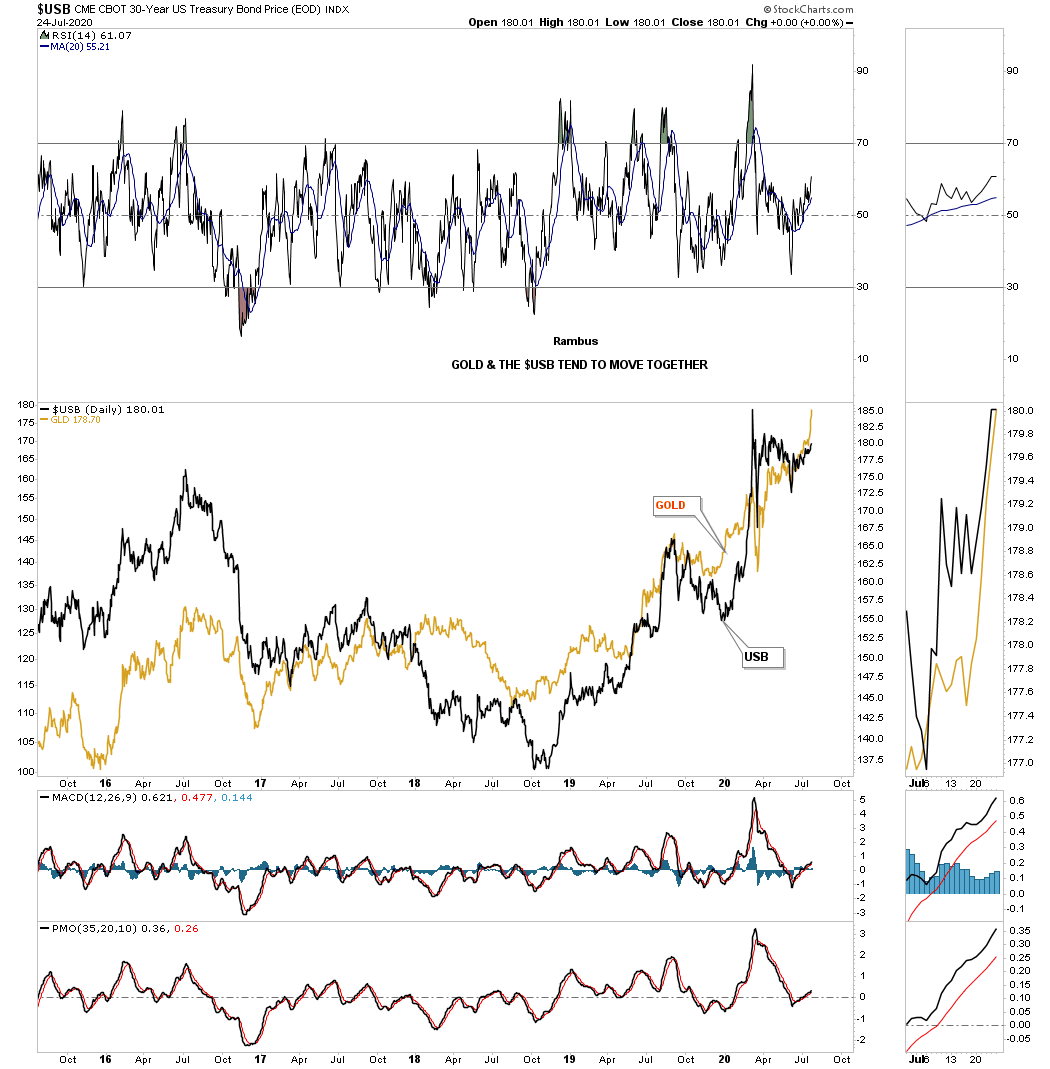
This last chart is the UUP / HUI combo chart we’ve been following for most of the rising channel on the UUP. This chart shows you a good example of how negative divergences can fail just when you think they will workout. You can see the big breakout move out of the blue bullish falling wedge on the UUP while the HUI has only traded sideway chopping out the blue triangle.

A Blast From The Past

While Rambus is out of the Office I though I would post a couple of his greatest hits.

Here is his work on the Oil Trade back in 2014

The title of the post is “Black Friday in the Energy Markets”

There is a link to all the posts in this series as we watched in real time this incredible trade unfold

https://rambus1.com/2014/11/29/friday-night-charts-21/

Could there be something similar brewing now ?

………………………..

Here is one incredible chart from March 2013 “Dollar Bears Prepare to Hibernate.”

The repercussions of this chart are still playing out here and now .

Here is the infamous post.
https://rambus1.com/2013/03/10/dollar-bears-about-to-go-into-hibernation/

Good trading to all members
Onward !

Fullgoldcrown