This content is for Yearly and Monthly members only.
Subscribe
Subscribe
Already a member? Log in here
A couple of weeks ago I wrote an essay on why I thought the stock markets were on the verge of breaking out. Today’s action is now showing us a breakout to the topside is in progress. We looked at alot of long term charts to get rid of some of the noise from the short term look. Sometimes you have to step out of the forest to see the trees. I also said that the rally for the stock markets would be good for the precious metals stocks and bad for the dollar. So if you were looking for all the stock markets to crash and the world to end as we know it you may need to rethink what inflation is going to do to just about everything you can think of including the stock markets going up when emotionally thinking says just the opposite. Anyway today’s action is very positive IMHO.
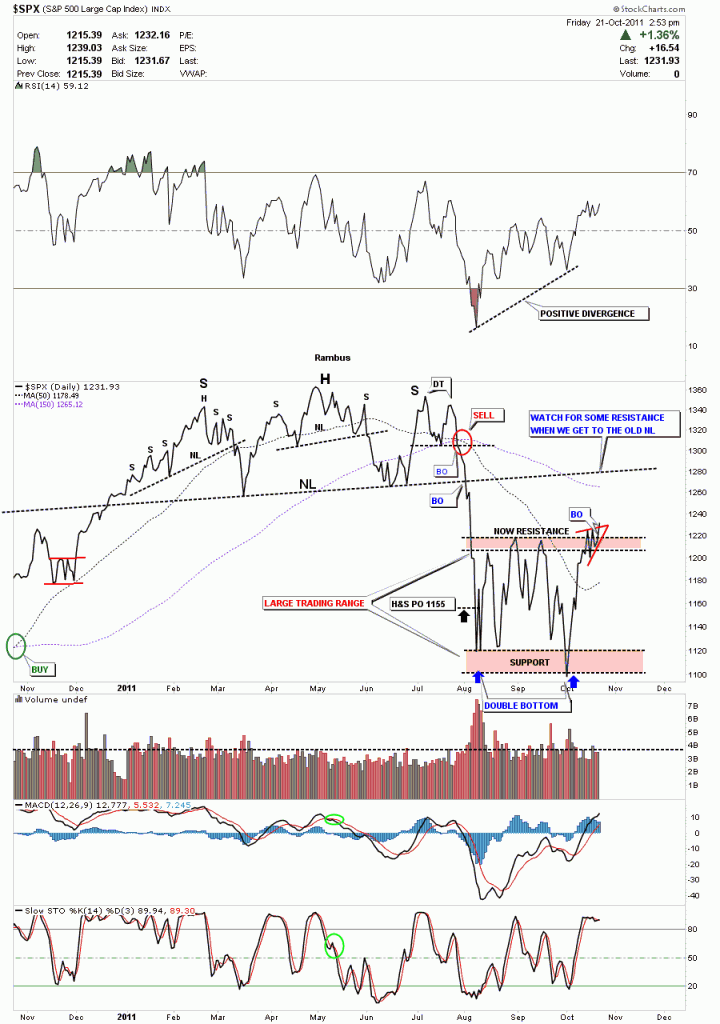
Below is a daily line chart of the SPX showing the volatile trading range we have been in since we broke the neckline back in August. Note that we did hit the H&S price objective on the first leg down at 1155. Sometimes using a line chart helps takeout alot of the noise that a bar chart can show especially when there are inter day breaks of support and resistance zones. I’m going to classify our trading range as a double bottom at this time. To measure a double bottom or double top you just measure the distance from the bottom to the top of the range and add that distance to the top of the range to get your price objective for the double bottom in this instance. We should get some resistance at the old neckline where we might form some kind of small consolidation pattern. Note the positive divergence on the RSI above the chart.
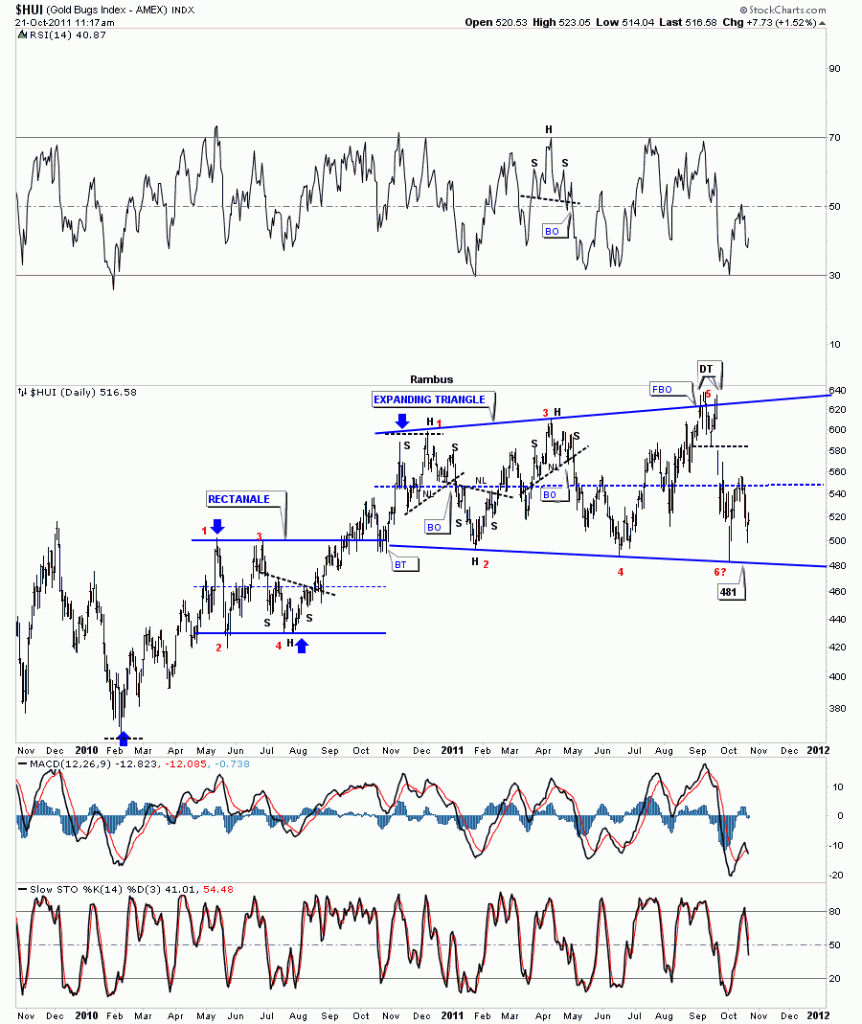
Below is a chart of our ever expanding triangle that has been forming for a year now. These type of patterns give you alot of false buy and sell signals by breaking out above the previous high only to reverse back inside the pattern with the same thing happening at the bottom of the trading range. Whipsaw city. What we do know is the expanding triangle is complete after it hit the top rail at point #5. You can see the double top at point 5 that led to our last leg down that finished at the bottom rail with a slightly lower low than the previous low back in June.. Our latest bounce off the bottom rail took us to the center of the consolidation pattern, dashed blue rail, where the rally petered out. In a big trading range like we are in you can see how most reversals within the expanding triangle were accompanied by some kind of reversal pattern, such as a H&S or double top or bottom. This is one reason I would like to see us touch the bottom rail one more time to complete a rather large double bottom that would call for a move all the way back to the top of the pattern. What we want and what we get can be two different things. Bottom line is we know the boundaries of the trading range and can act accordingly.
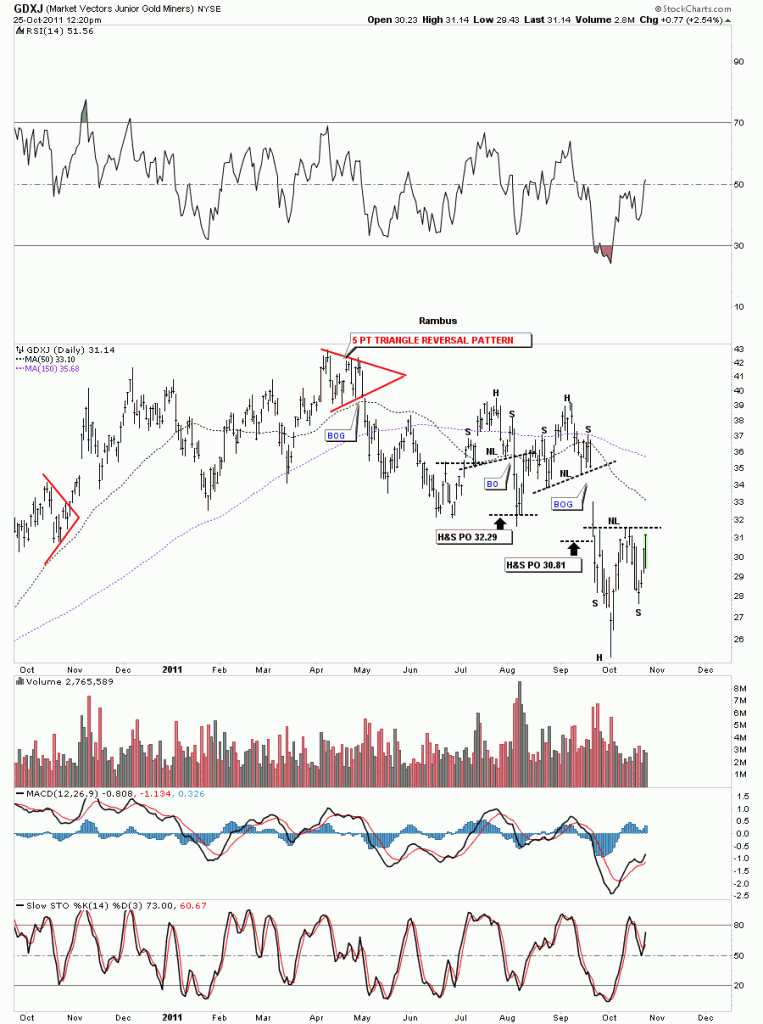
HUI daily look.
Yesterday we came within .14 of the all important bottom rail of our triangle that has yet to tell us what kind of pattern it is yet. This mornings bounce came at the right time and place to keep the triangle reversal pattern , to the upside, in play. So the chopping continues within the boundaries of the triangle. By hitting the bottom rail yesterday the triangle was completed as we now have 4 confirmed reversal points. The big question remains, is this triangle a consolidation pattern or a reversal pattern to the upside. Stay tuned.
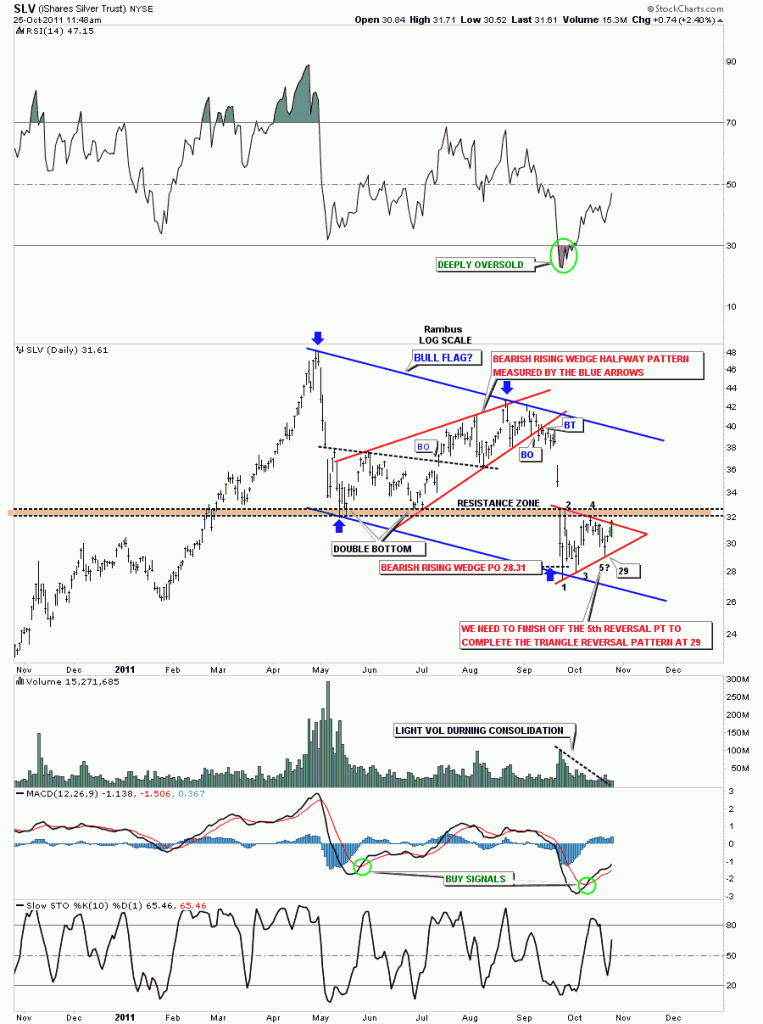
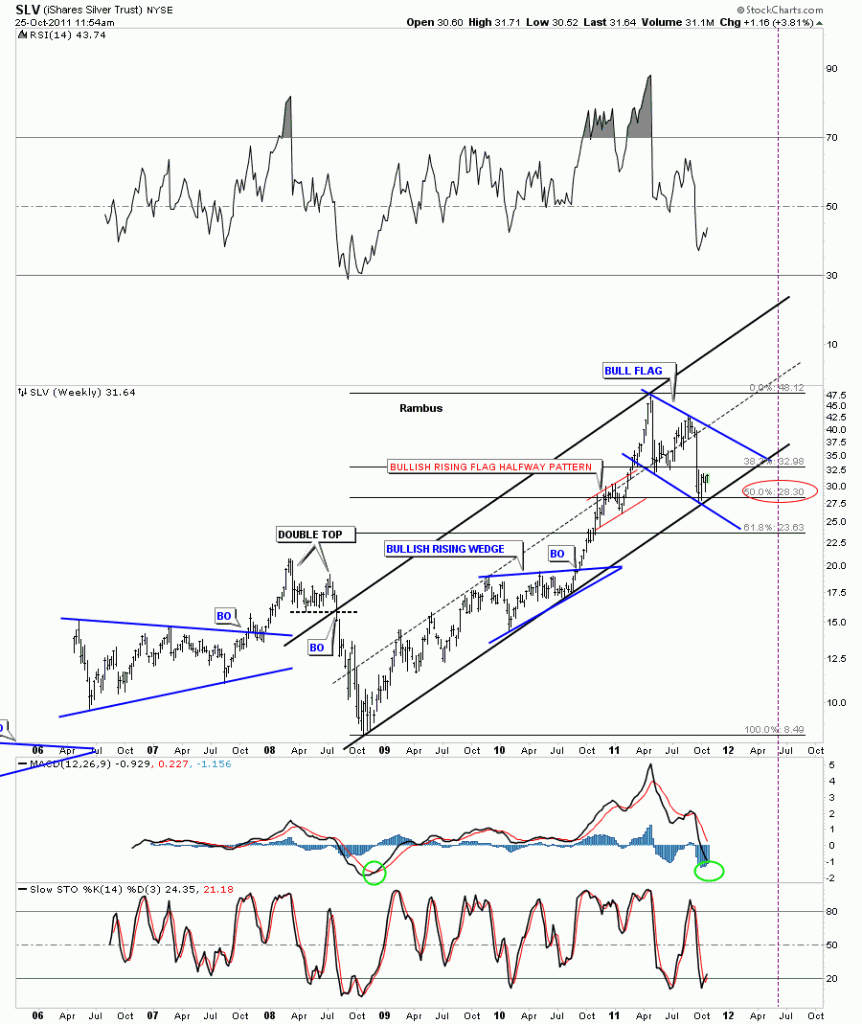
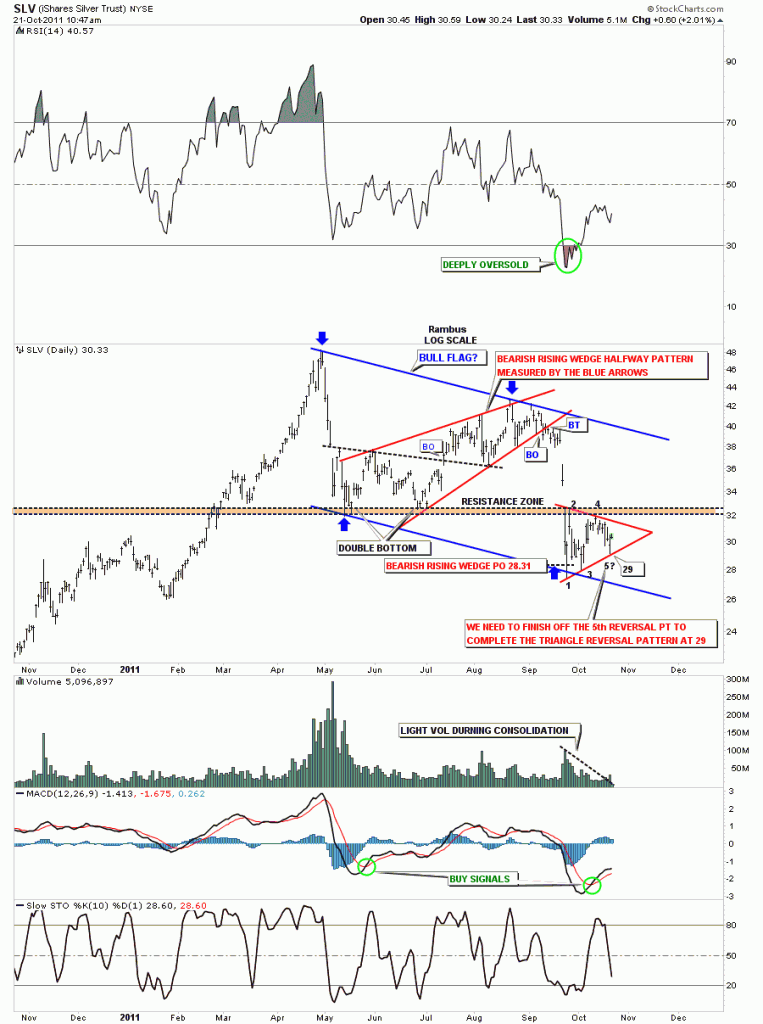
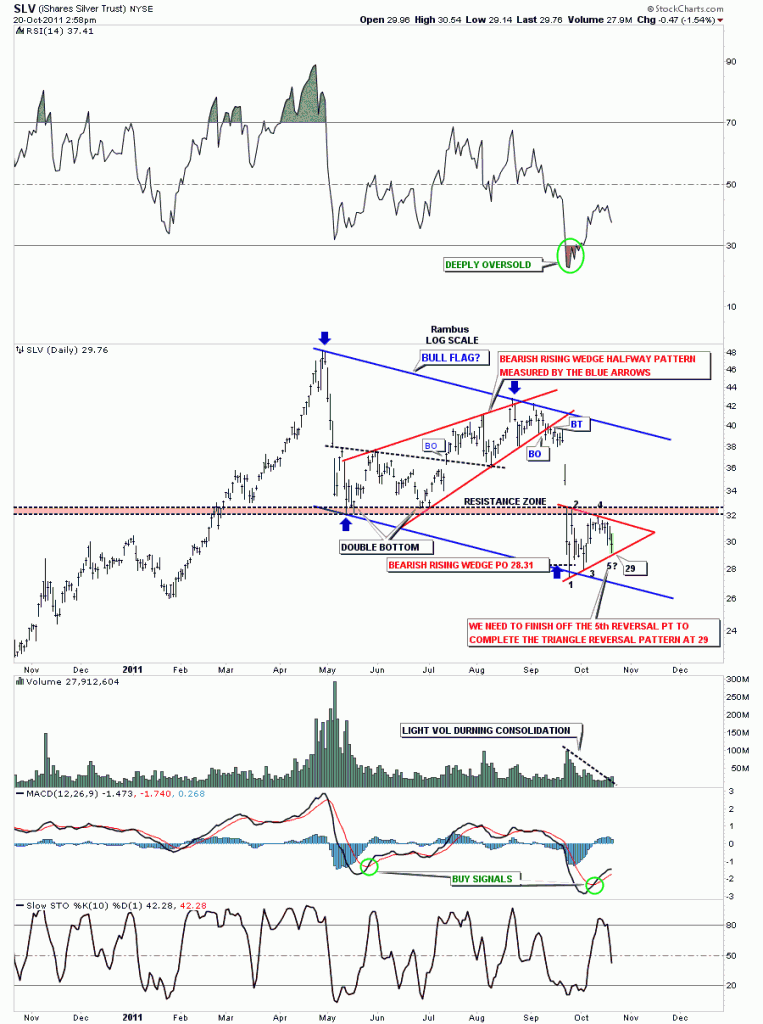
The daily chart for SLV shows our triangle consolidation pattern forming. A few days ago I mentioned I would like to see the 29 area hit which was the bottom rail of the triangle. Today we hit 29.14 and we are getting a bounce. I can’t emphasize how important this bottom rail is for SLV and the rest of the PM complex. If the bottom rail can hold and we rally up thru the top rail at some point in the near future this triangle pattern will be a reversal pattern. Right at this very moment it is still classified as a consolidation pattern. Patience is a hard rule to follow sometimes.
SLV daily look.
Fully here is an update of the15 minute chart of GLD I posted earlier this morning. We have broken below the bottom trendline and the backtest is now in progress. What we want to see now is for the backtest to fail and the decline to begin in earnest. If GLD gets back into the triangle then its back to neutral.
GLD 15 minute look.