Wednesday Report…Long Term Gold …A Very Unpopular View.

Since roughly the middle of January of this year we’ve seen some big changes in character taking place in many different areas of the markets. After nearly two years of low volatility, which is much easier to take, volatility has come back with a vengeance and doesn’t seem to be slowing down much. Its been most obvious in the stock markets, but now the US dollar’s volatility has spiked which may be suggesting something is in the wind. What that something is can be anyone’s guess, but something changed in mid January of this year.

Tonight I would like to show you some old long term charts I built out four years or so ago after the top in the PM complex was established. Some of the longer term subscribers will remember them as they had a long term bearish tone to them if they played out. It’s been a long time since I posted some of these charts because for the last several years nothing much has changed which maybe coming to an end.

I am very aware that many / most of our members are very interested in the gold market from a bullish bias. I know many of you will find these charts and what they are strongly suggesting ,  disturbing. I only ask that you read the following with an open mind. If this scenario unfolds , It could very well save your financial future. Also please take special note of the lines in the sand where the bullish outcome would become probable. Personally I would like nothing better than to have another opportunity to chart and participate in another gold bull as the last one was extremely rewarding.

Before we look at some of those old long term charts for gold and silver I would like to update some of the US dollar charts as there has been some big changes taking place since we last looked at them, especially the shorter term daily chart.

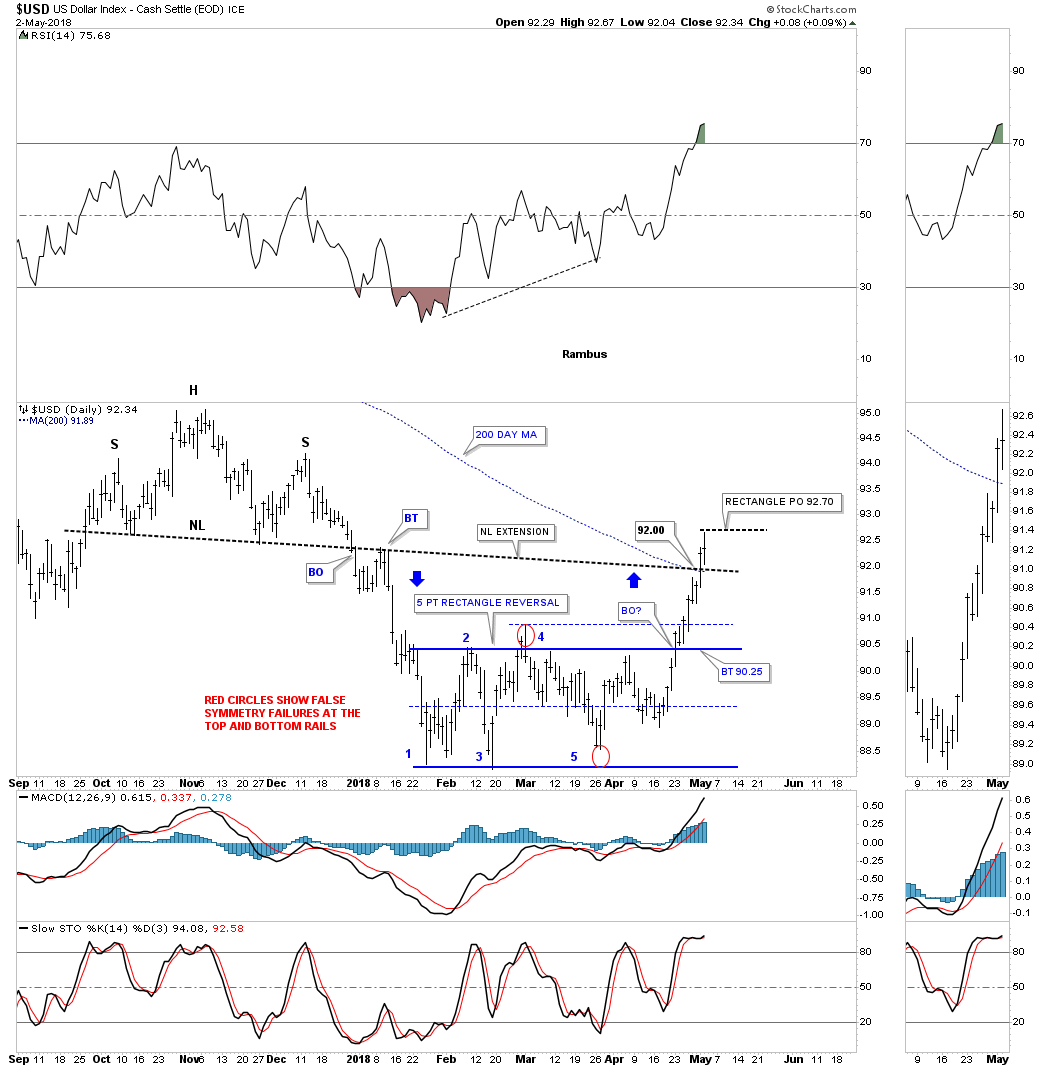
About two weeks ago we looked at this daily chart for the US dollar which was just in the process of breaking out from the 5 point rectangle reversal pattern. I showed two areas of possible resistance which was the 200 day moving average and the price objective of that 5 point rectangle reversal pattern, which came in at 92.70 which was hit. I also showed how the blue arrows suggested we could see some reverse symmetry to the upside vs how the US dollar came down over that same area.
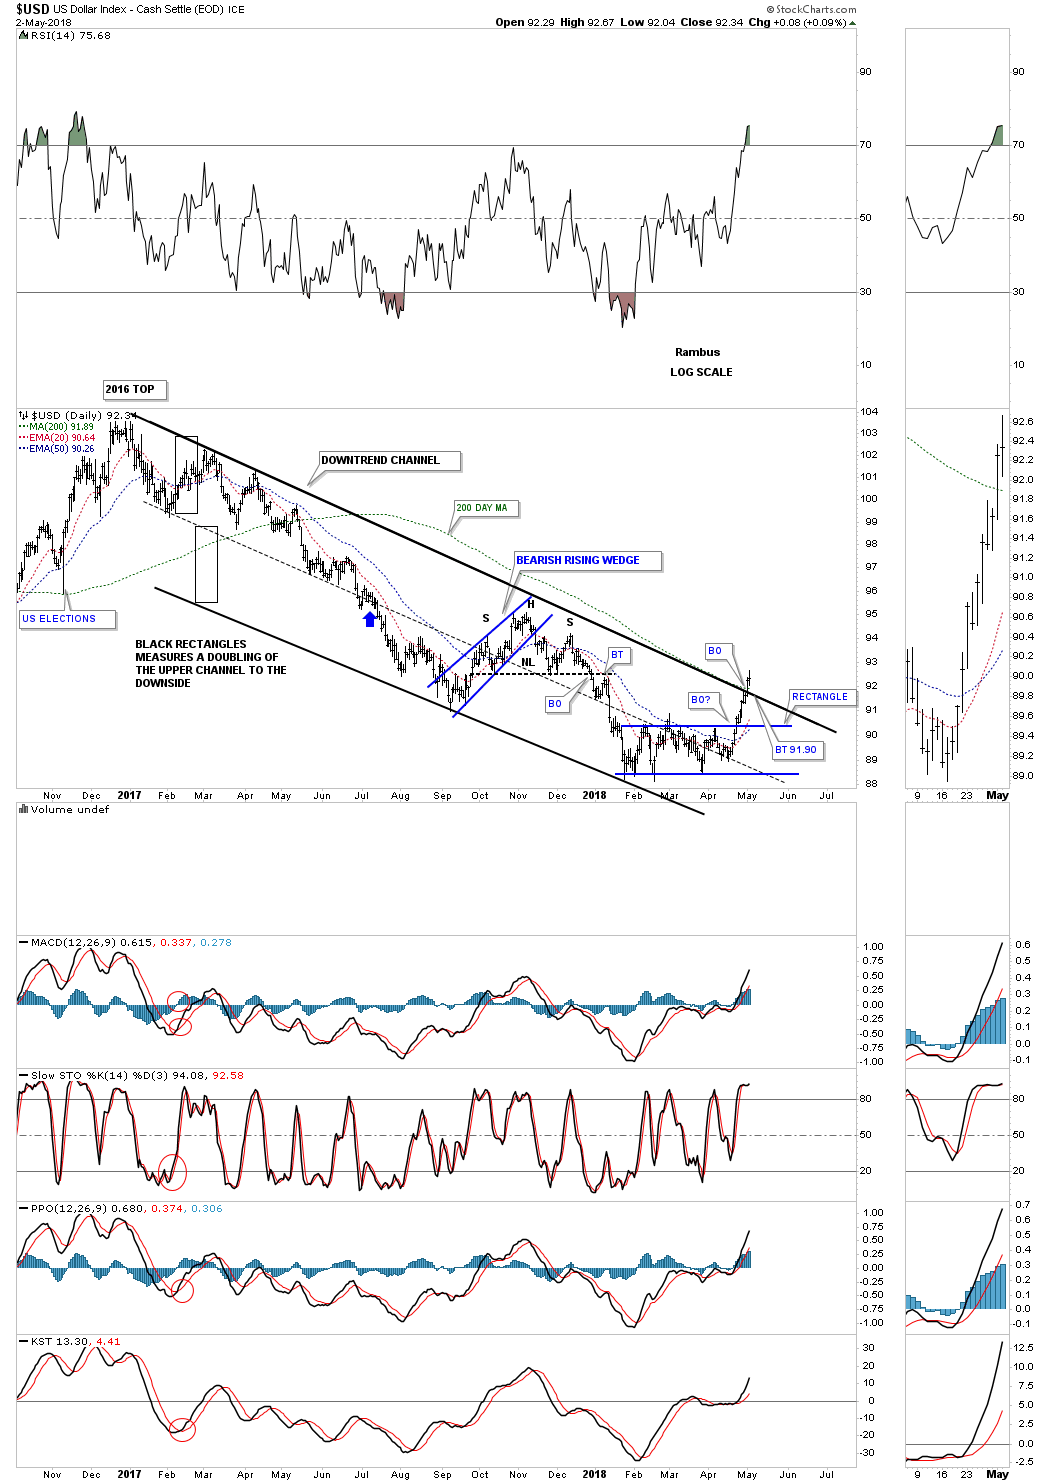
Below is a long term daily chart which shows its parallel downtrend channel with the breakout above the top rail yesterday. A backtest to the top rail would come in around the 91.90 area.
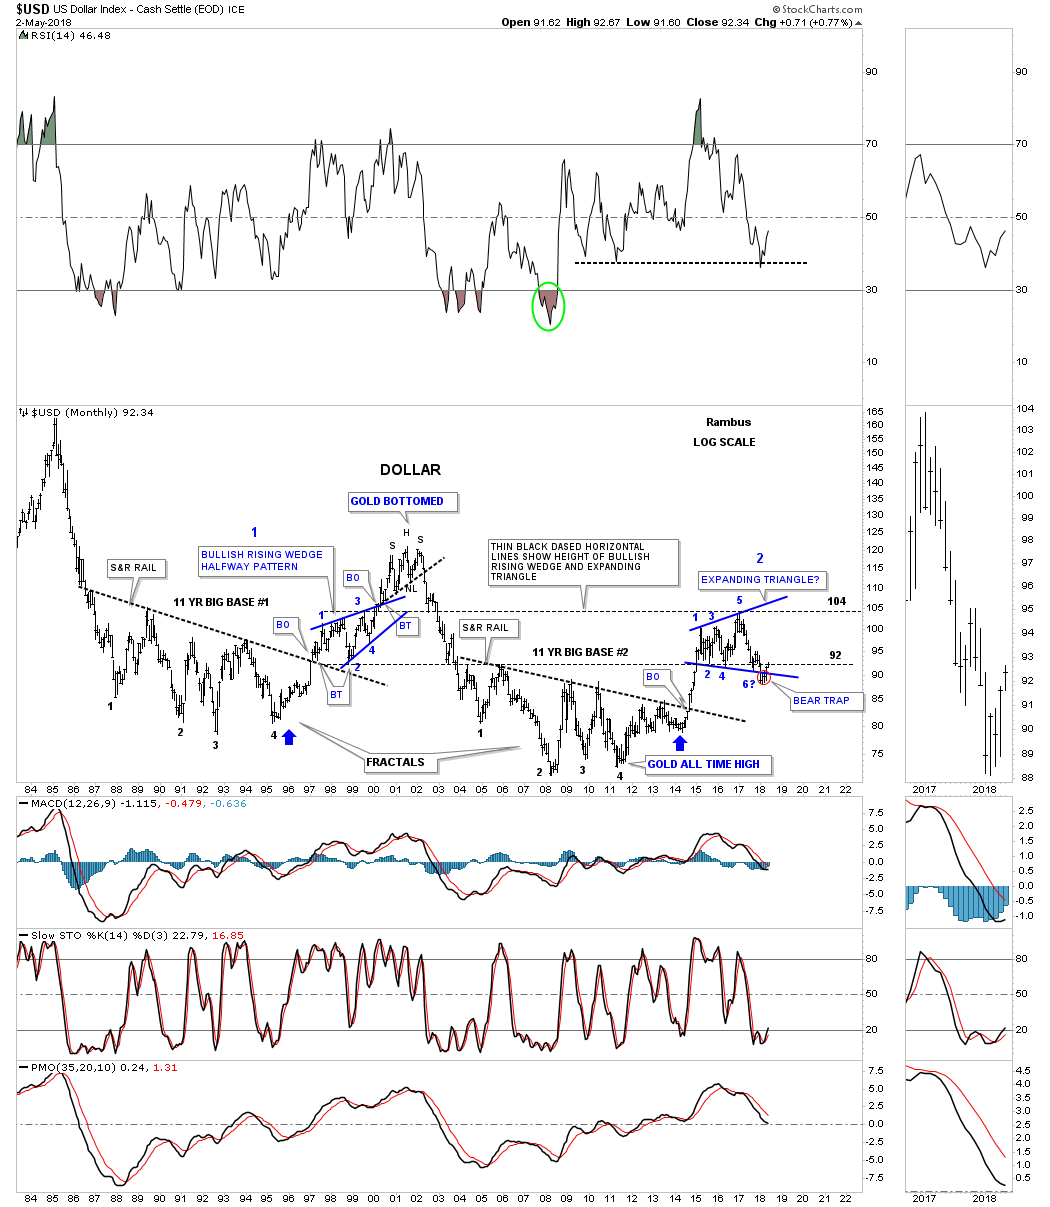
This next chart is the long term monthly fractal chart we’ve been following for many years which now shows the false breakout below the bottom rail of the blue expanding triangle that I had previously labeled as a possible bear trap, red circle. This is important because when you get a false move like that you can often times get a big move in the opposite direction in this case up. Even though the two blue consolidation patterns are different in this fractal chart the two thin black dashed horizontal lines shows the low and high for each pattern on the same area on the chart.
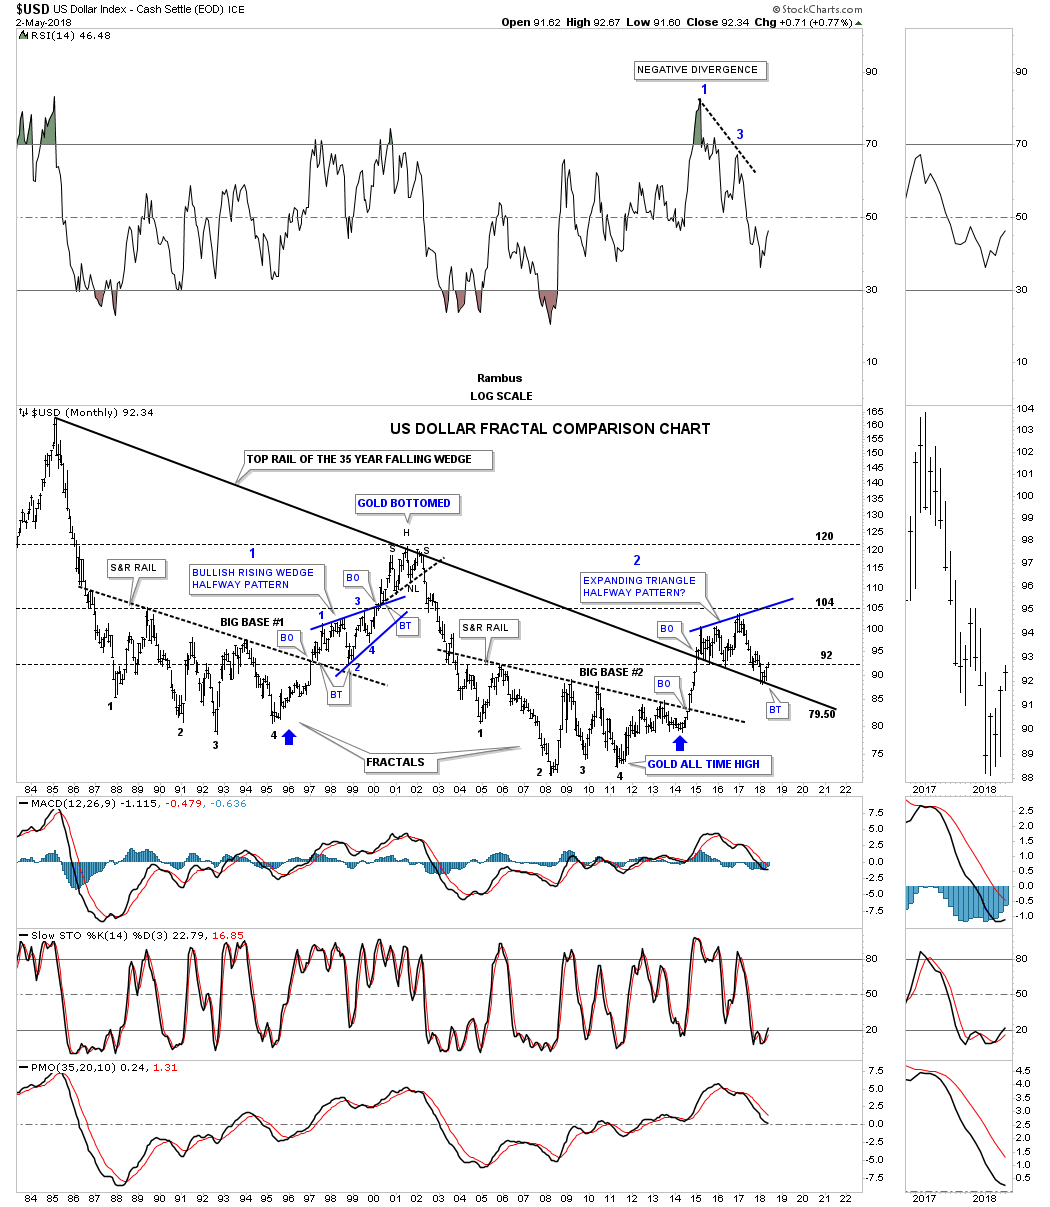
This 35 year monthly chart has always been an important chart to keep track of because we didn’t know if the top rail would hold support after such a long time of holding resistance. So far it has done its job.
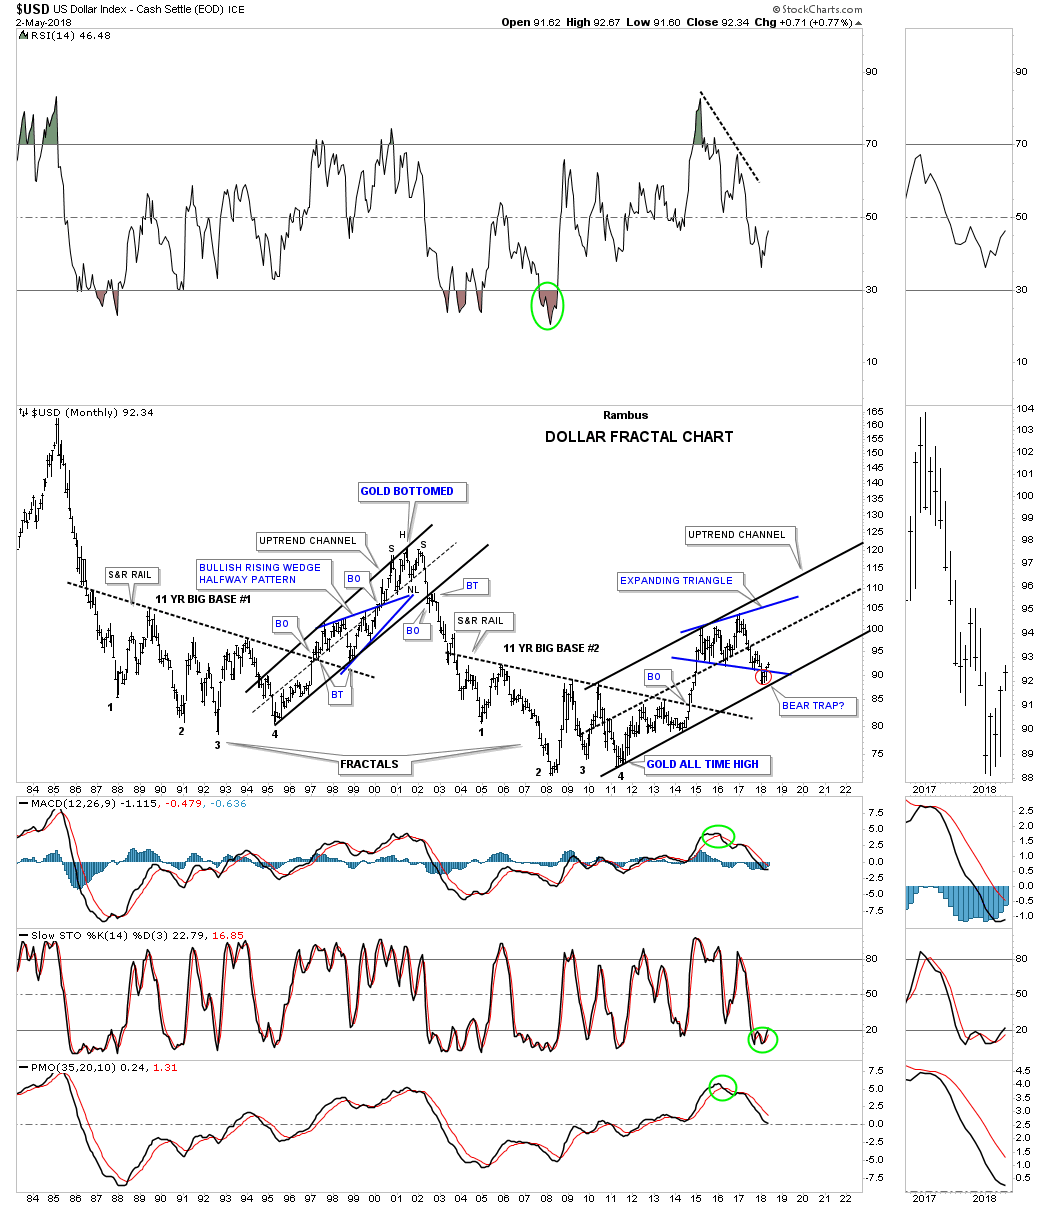
Below is the same chart which shows the US dollar’s 2011 bull market uptrend channel.
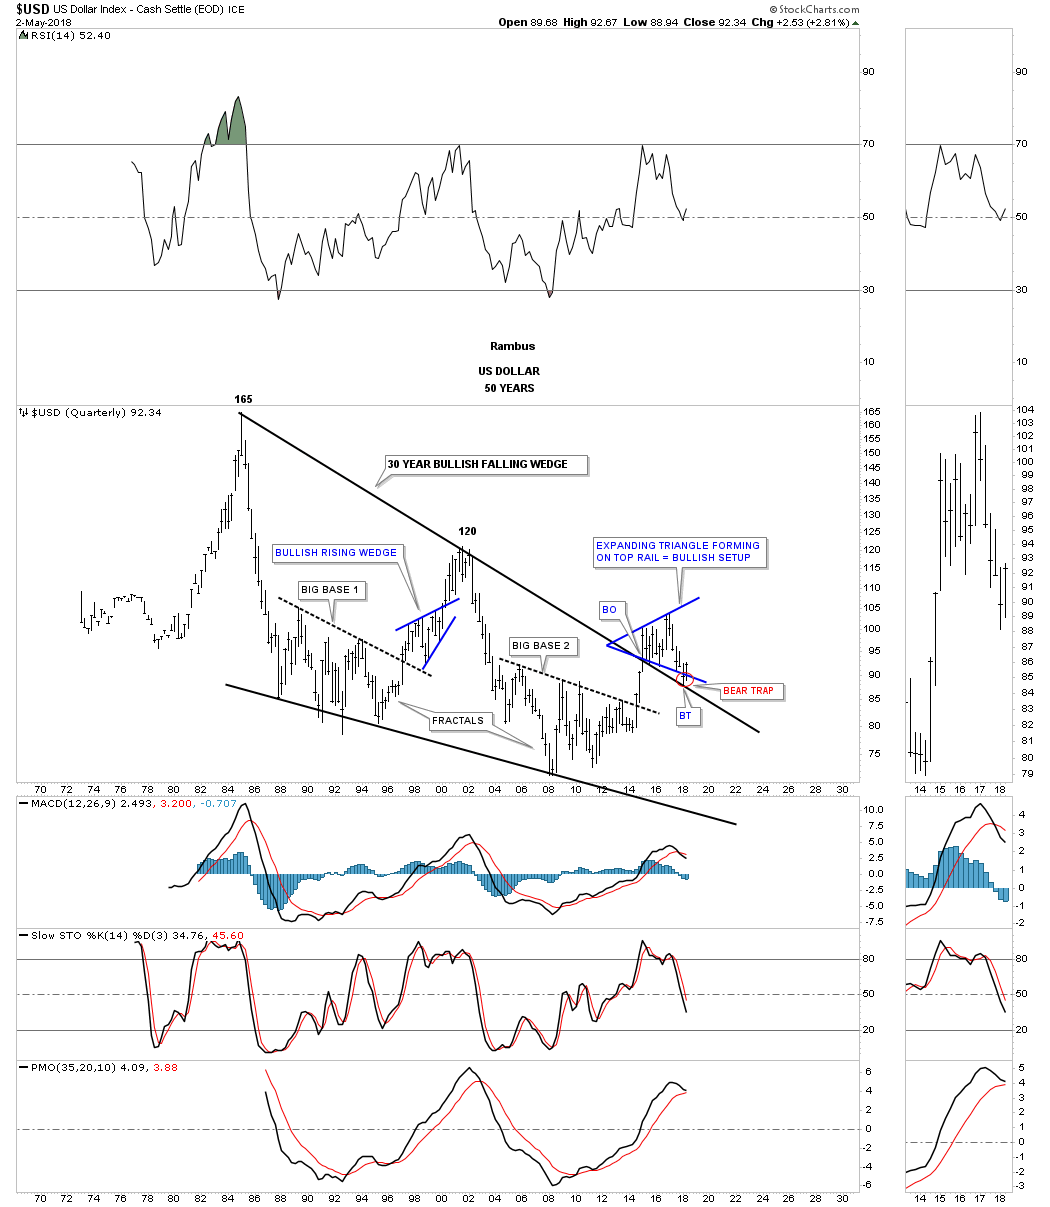
The 50 year quarterly chart shows the 35 year bullish falling wedge with the bear trap that formed between the bottom rail of the blue expanding triangle and the top rail of the 35 year falling wedge. All we would need to see to negate this bullish setup is for the US dollar to trade below the top rail of the 35 year bullish falling wedge and it would be game over for the US dollar bulls, but until that happens the Chartology is strongly suggesting the next leg of the bull market is now getting underway whether we like it or not.
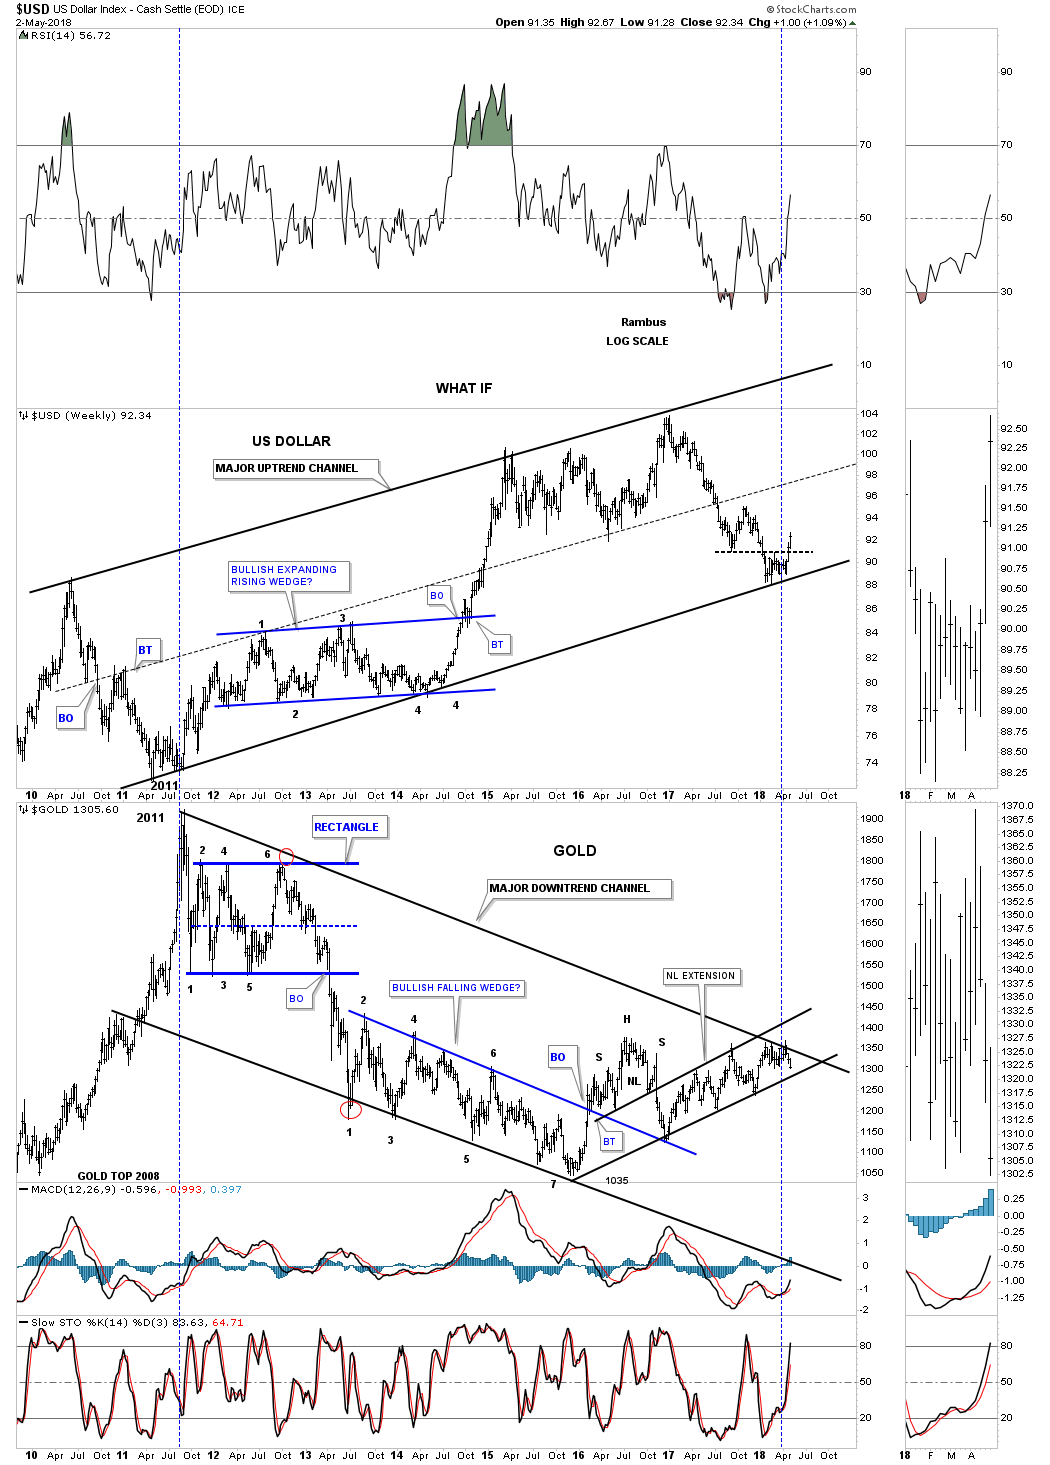
This next chart is a combo chart which has the US dollar on top and gold on the bottom I’ve labeled it as a, WHAT IF, chart. What if the US dollar has just put in its long term low on the bottom rail of its major uptrend channel. And then, WHAT IF, gold is putting in its major high at the top rail of its downtrend channel? This would be the very last thing most PM investors could possibly conceive of right now. Again, all we have to see to change this possible scenario is to see the US dollar break below the bottom rail of its bull market uptrend channel and for gold to take out the top rail of its downtrend channel.
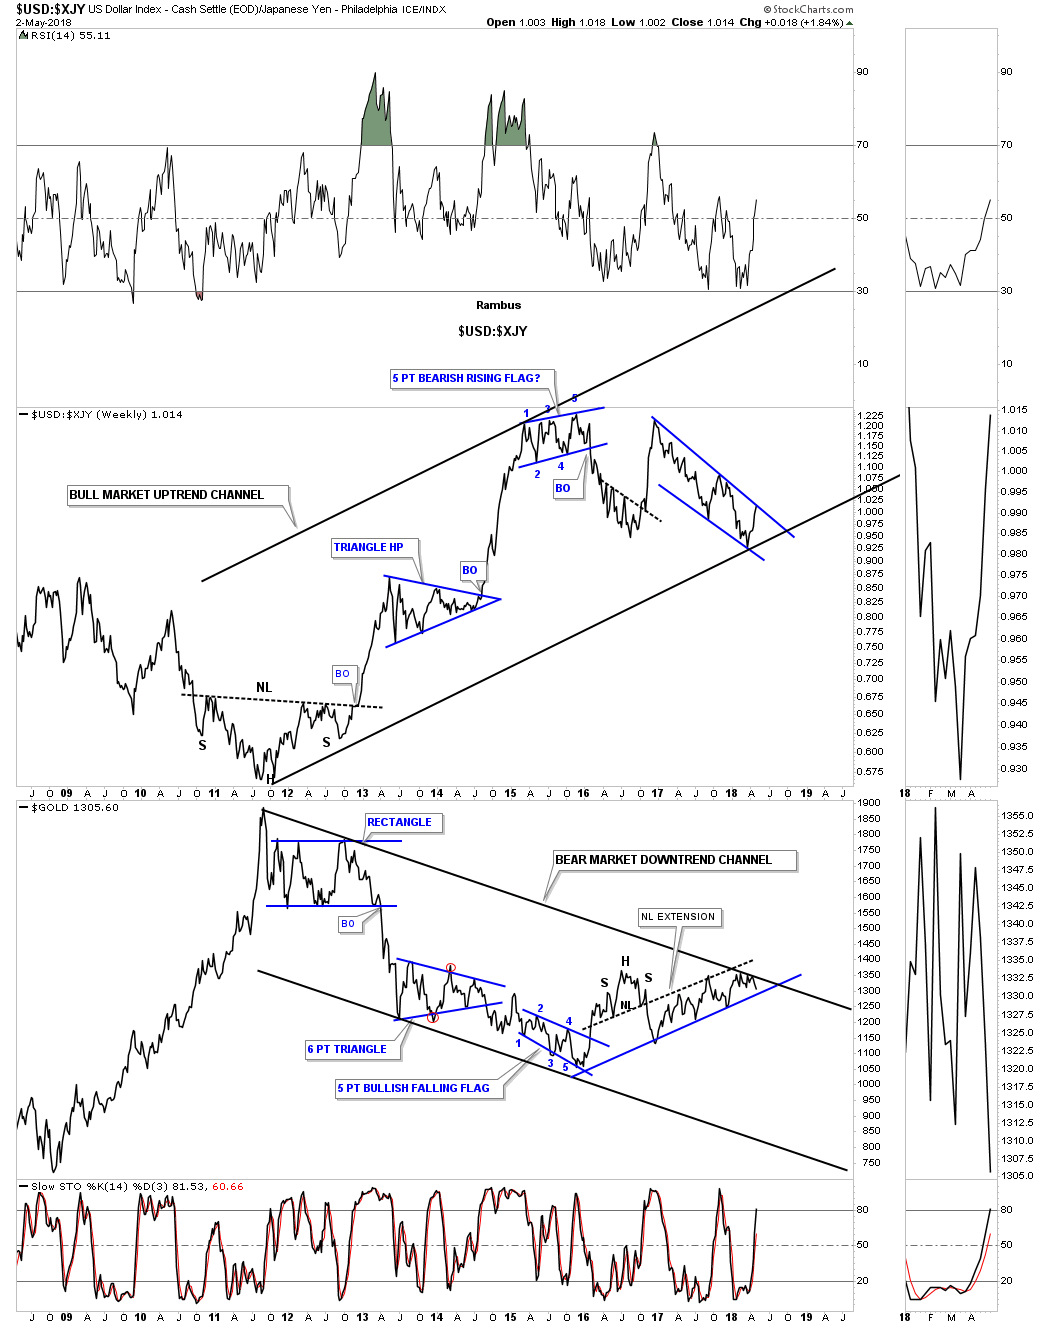
Below is another combo chart which has the USD:XJY ratio chart on top and gold on the bottom. As long as the bottom rail holds support for the ratio chart on top and the top rail for gold holds resistance then it is what it is regardless of all the reasons it can’t be.
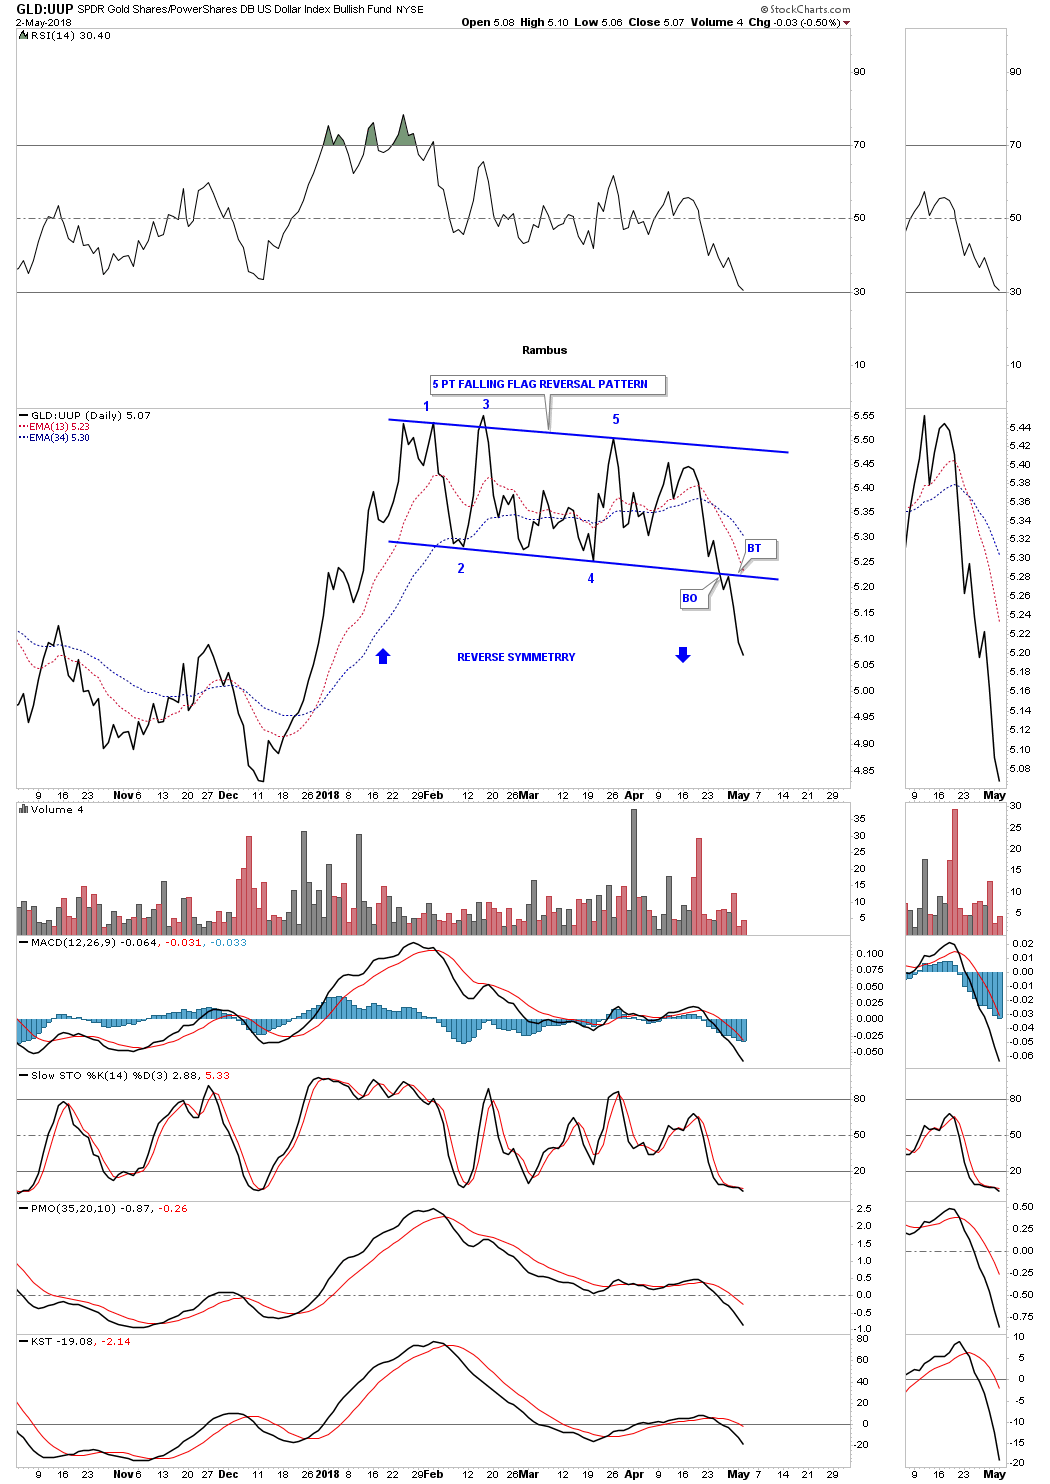
Next I would like to show you some close up looks at the US dollar to gold ratio charts so you can get a better understanding of what is taking place right here and now. This first chart is a daily line chart which compares GLD:US dollar. As you can see this ratio began topping out during the middle of January and is now in an impulse leg down. The blue arrows show how it may reverse symmetry to the downside vs the same area on the upside.
Lets step back a little further in time and look at a four year weekly chart for the GLD:UUP ratio. The three month pattern on the daily line chart above is showing up at the 4th reversal point in this 2 1/2 year rising flag formation. Remember many times we’ll see a 5 point reversal pattern at the reversal points within a much bigger trading range.
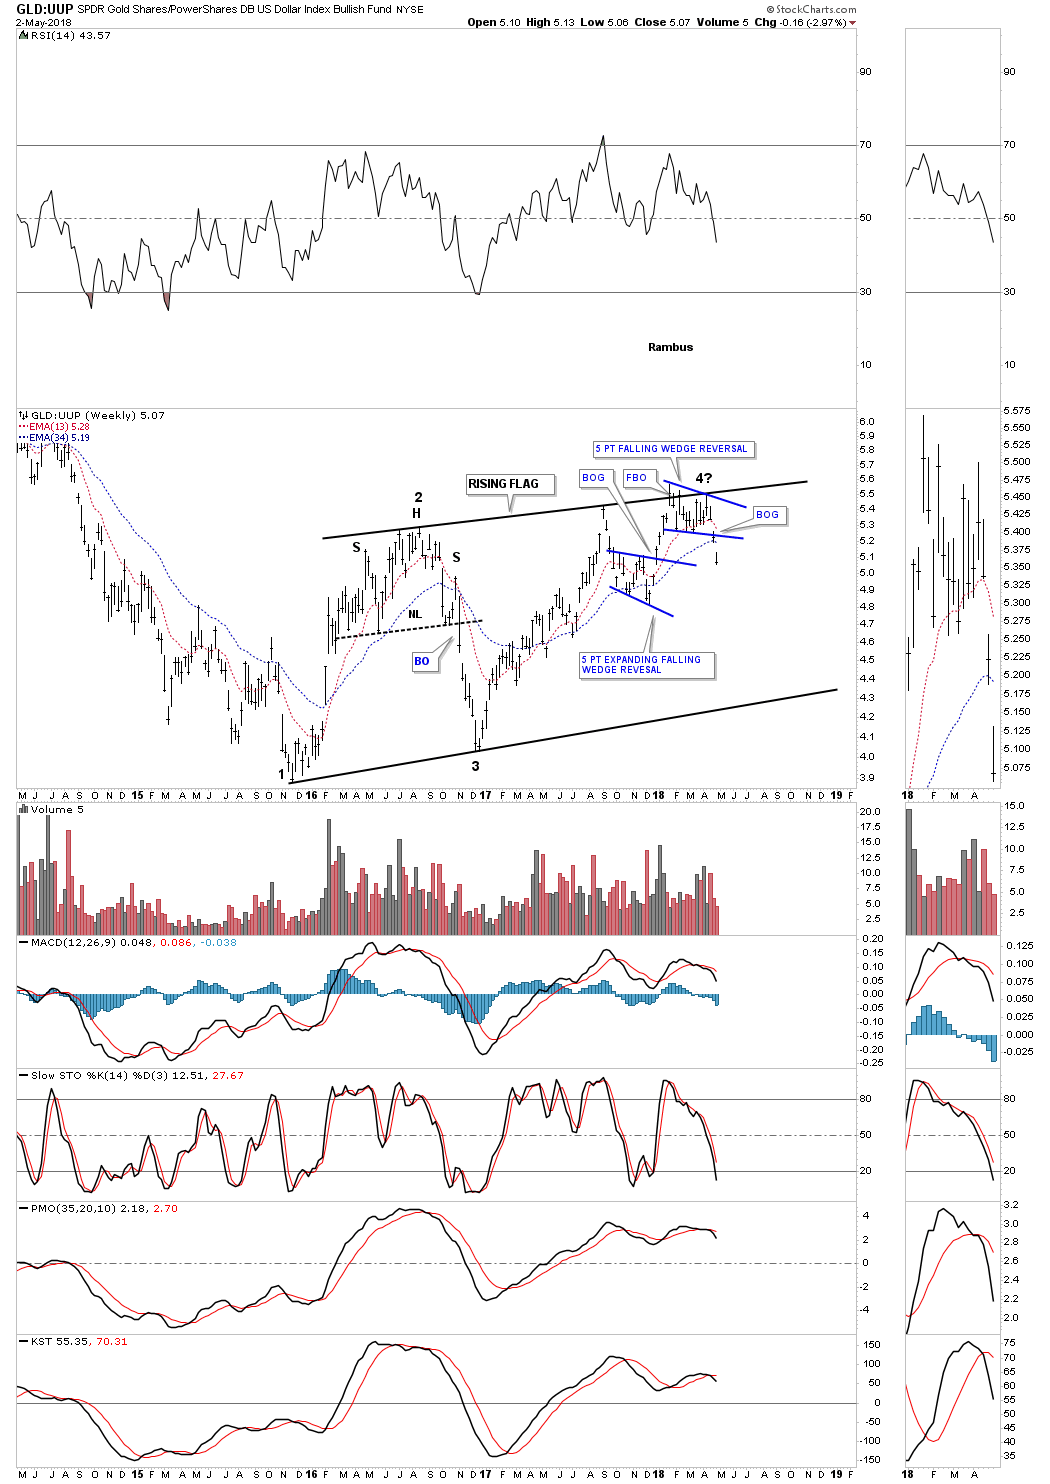
Since gold’s bull market ended in September of 2011 the GOLD:USD ratio chart had been in a perfect parallel downtrend channel until the summer of last year when the ratio broke out above the top rail. That could have been the point where gold could have really taken off to the upside, but it had a hard time rallying against the US dollar. Here you can see how the 2 1/2 year rising channel fits into the bigger picture. All gold has to do to negate this bearish setup is to rally above the top rail of the 2 1/2 year rising flag.
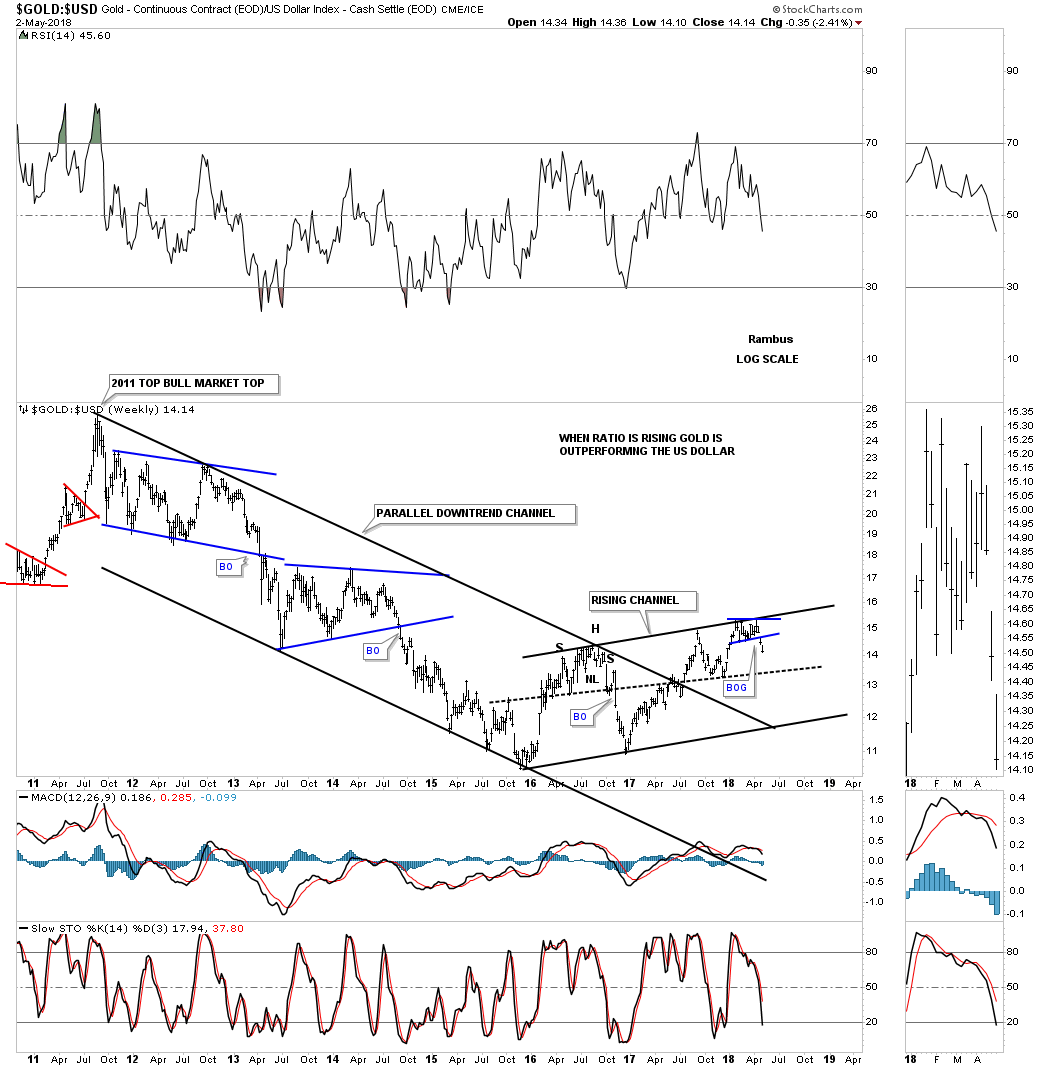
During gold’s massive ten year bull market the GOLD:USD ratio chart built out a perfect parallel uptrend channel with one consolidation pattern forming on top of the next. I left the downtrend channel off of this 18 year monthly chart so as not to put any boundaries on the bear market that began in 2011.

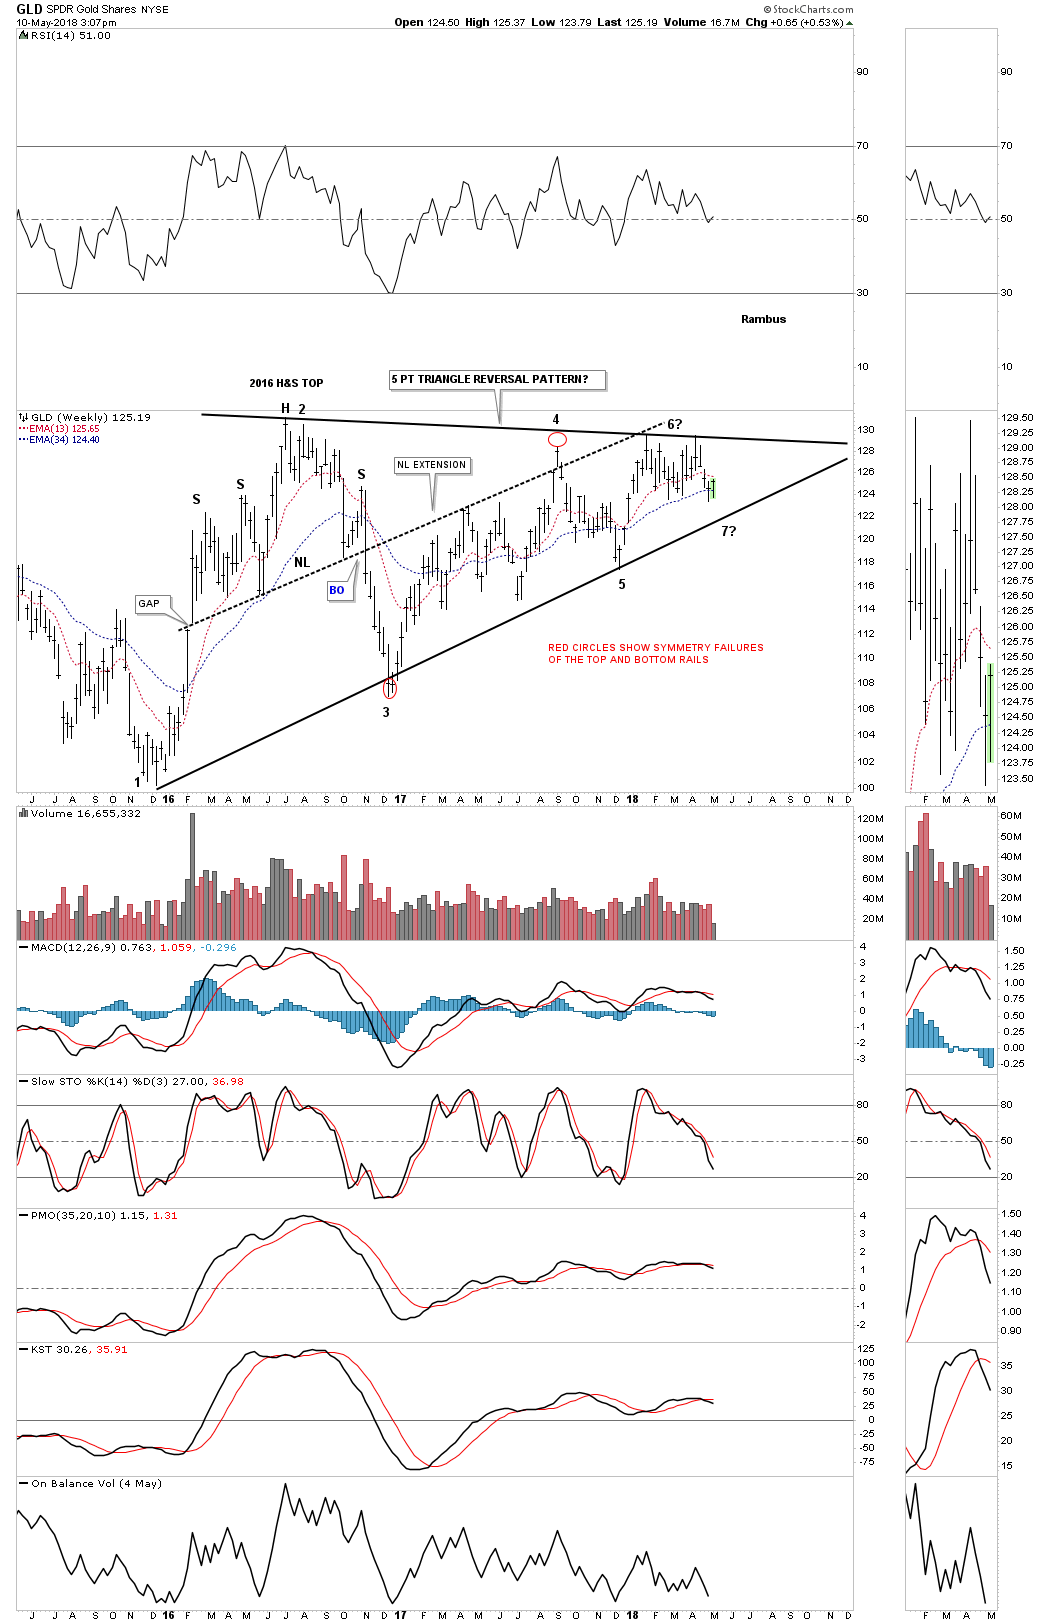
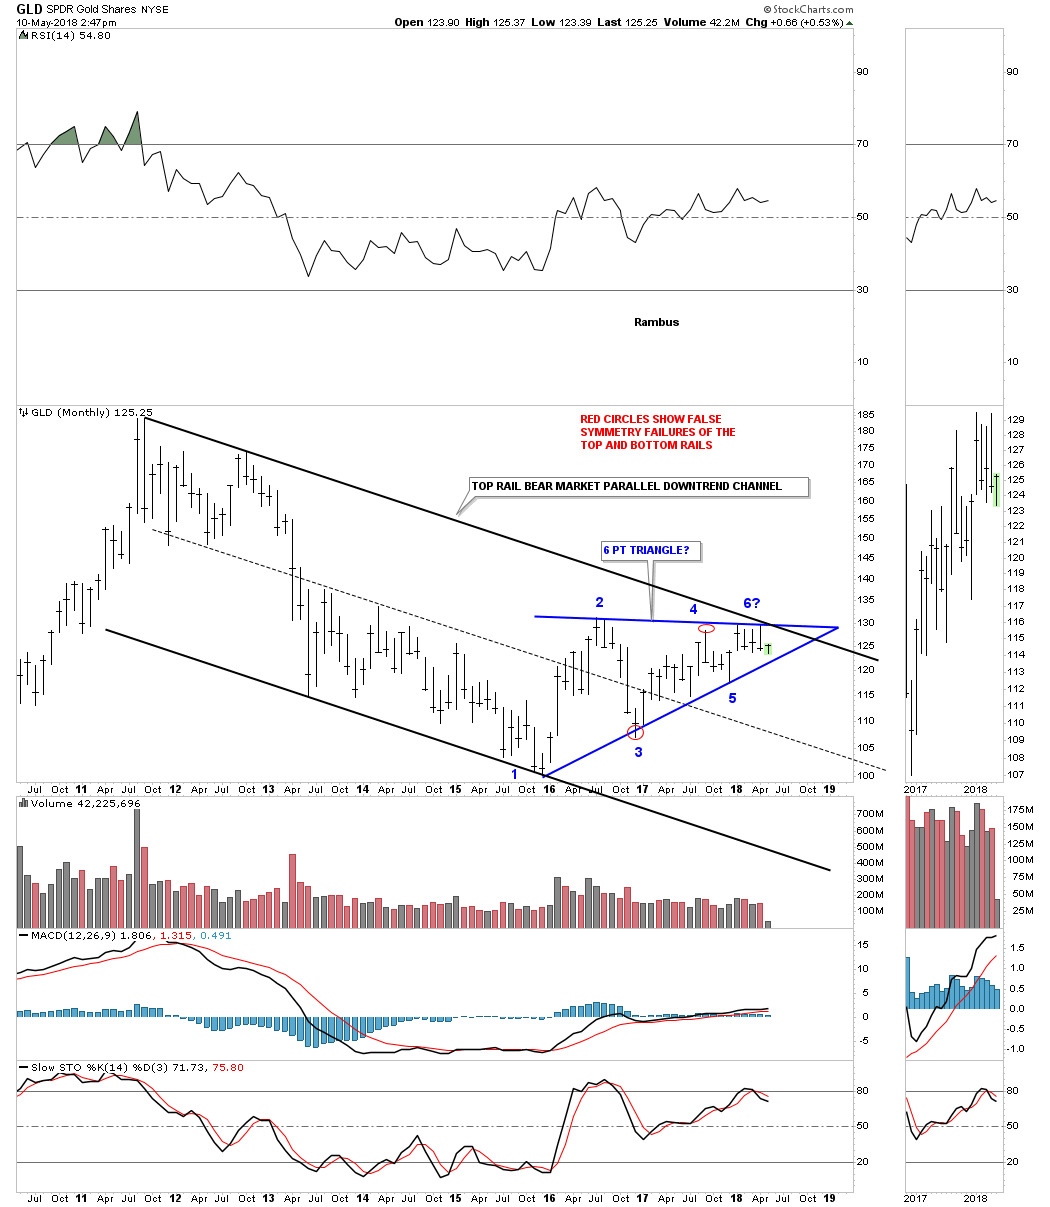
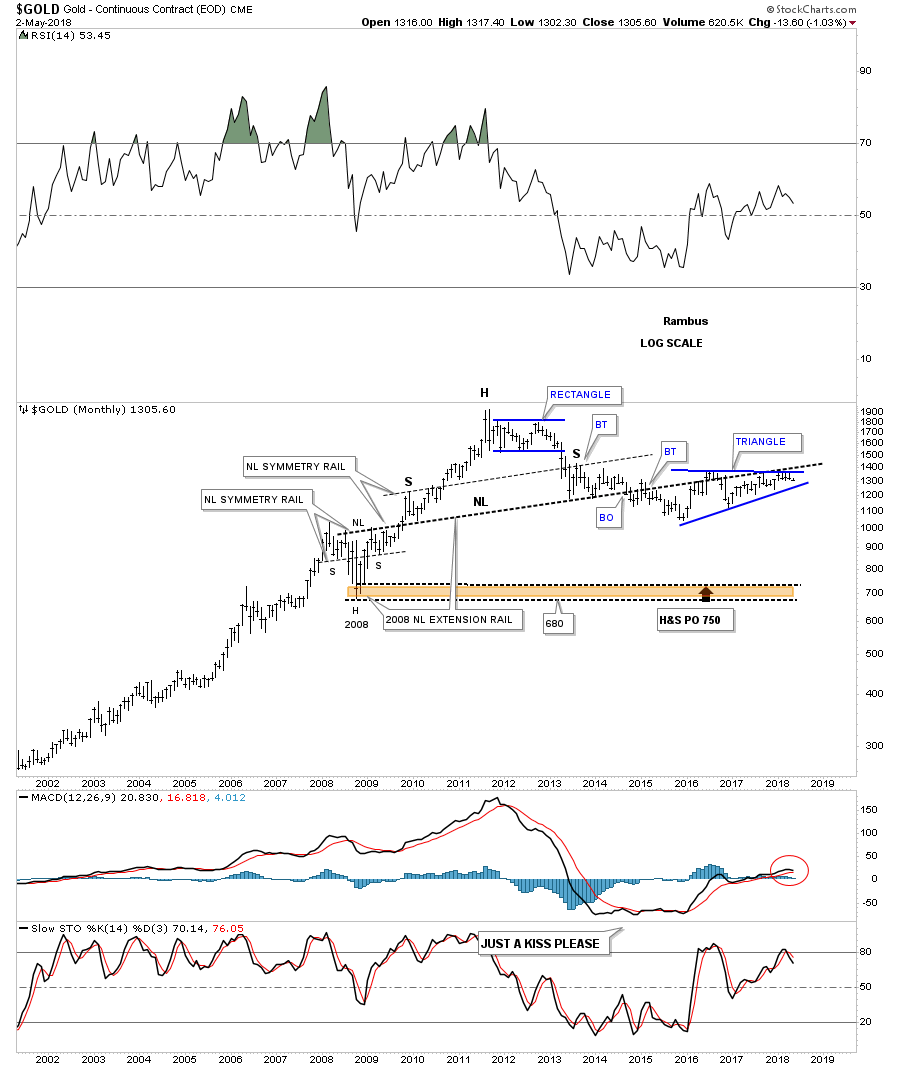
The reason I’ve been showing you so many charts on the US dollar is that it can have a profound affect on gold as you well know. The bigger the pattern the bigger the move. I built out this next long term chart for gold back in 2014. Note the H&S consolidation pattern that formed during the 2008 crash low. After gold started to bounce around after the 2013 decline I extended the 2008 H&S neckline all the way to the right side of the chart to see if I could find any support. As you can see gold found support on that 2008 neckline extension line from 2013 to just a couple of months ago. That blue triangle is the same one we’ve been following on the shorter term gold charts. If gold breaks down from that 2 1/2 year blue triangle the most logical place to find support would be at the 2008 crash low between 680 and 750.
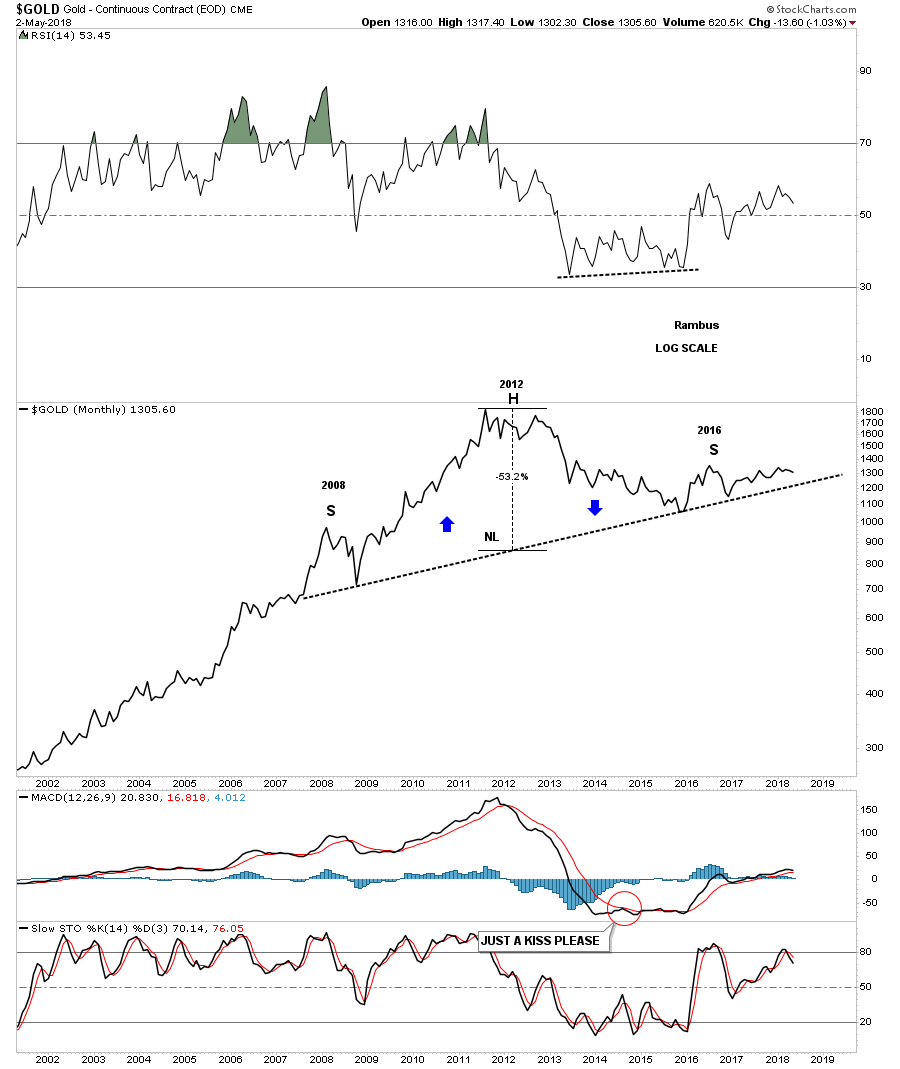
Below is a monthly line chart that spans the same amount of time as the bar chart above and gives you a clear picture of the possible H&S top. Keep in mind the neckline has to be broken to the downside before we can call the possible H&S a top.
This long term monthly chart for gold shows its parabolic bull market with its possible H&S top building out. The key is going to be what the blue triangle does.
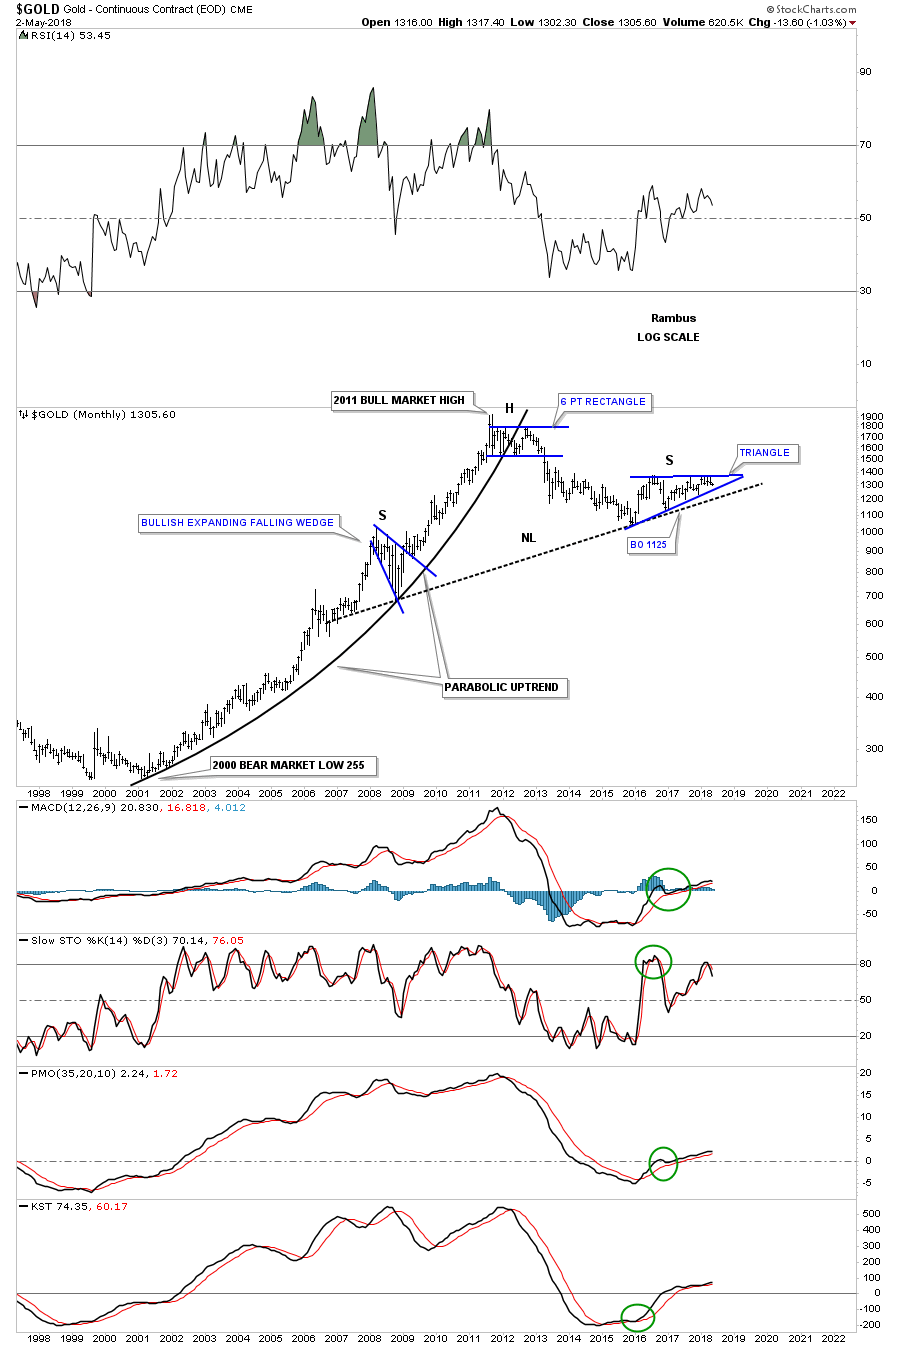
This last chart for gold is a 50 year monthly look which shows its 1970’s bull market and then the long 20 year sideways trading range. If that massive H&S top plays out you will be some of the first investors to know the bull market is officially over and a massive decline will ensue that will take years to complete.

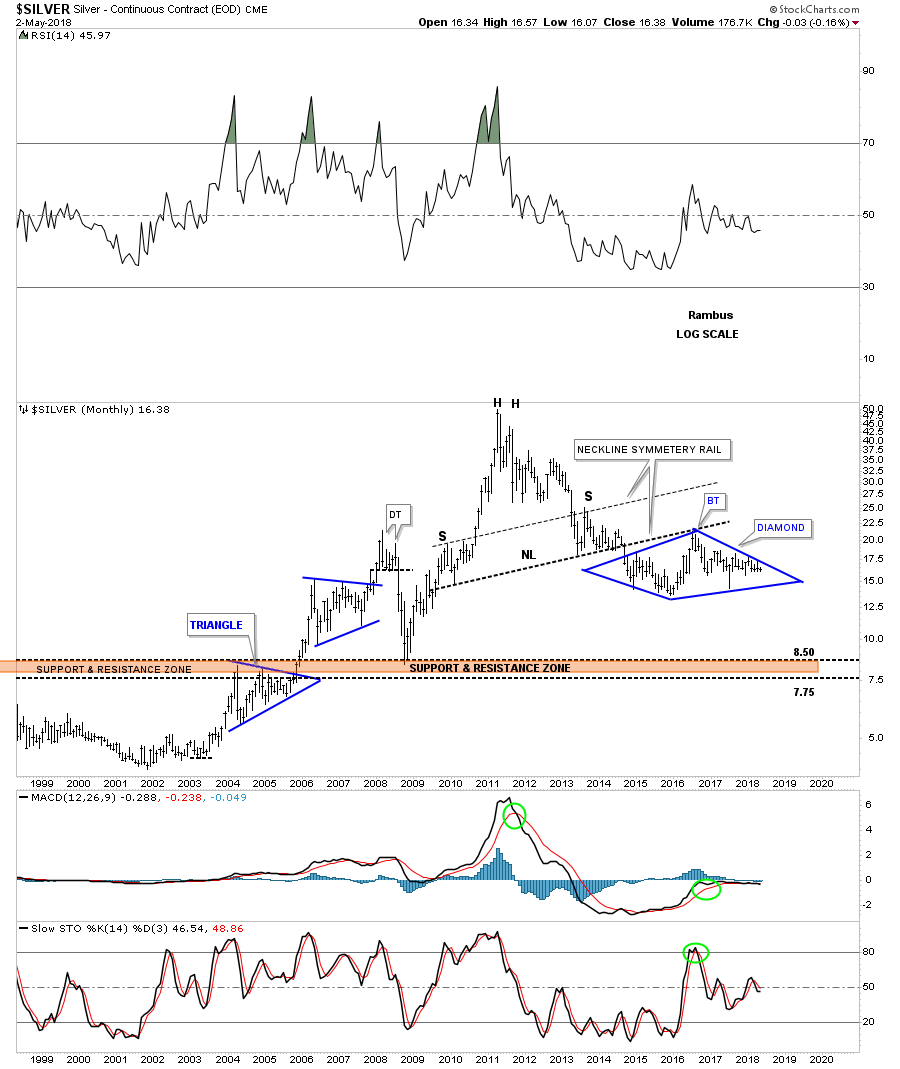
About the same time I did the long term H&S top for gold I also did one for silver as it too was producing some very nice symmetry. This 50 year chart for silver shows its massive H&S bottom which launched its bull market. Note how the 2008 crash low found support on that massive neckline confirming it was hot. Silver also built out a very symmetrical H&S top as shown by the neckline symmetry line that shows the high for both the left and right shoulders of the 2011 H&S top. That blue diamond might look familiar to you as we’ve been following it on the on the shorter term weekly and monthly charts. Is it a coincidence that it’s forming just below the major neckline?
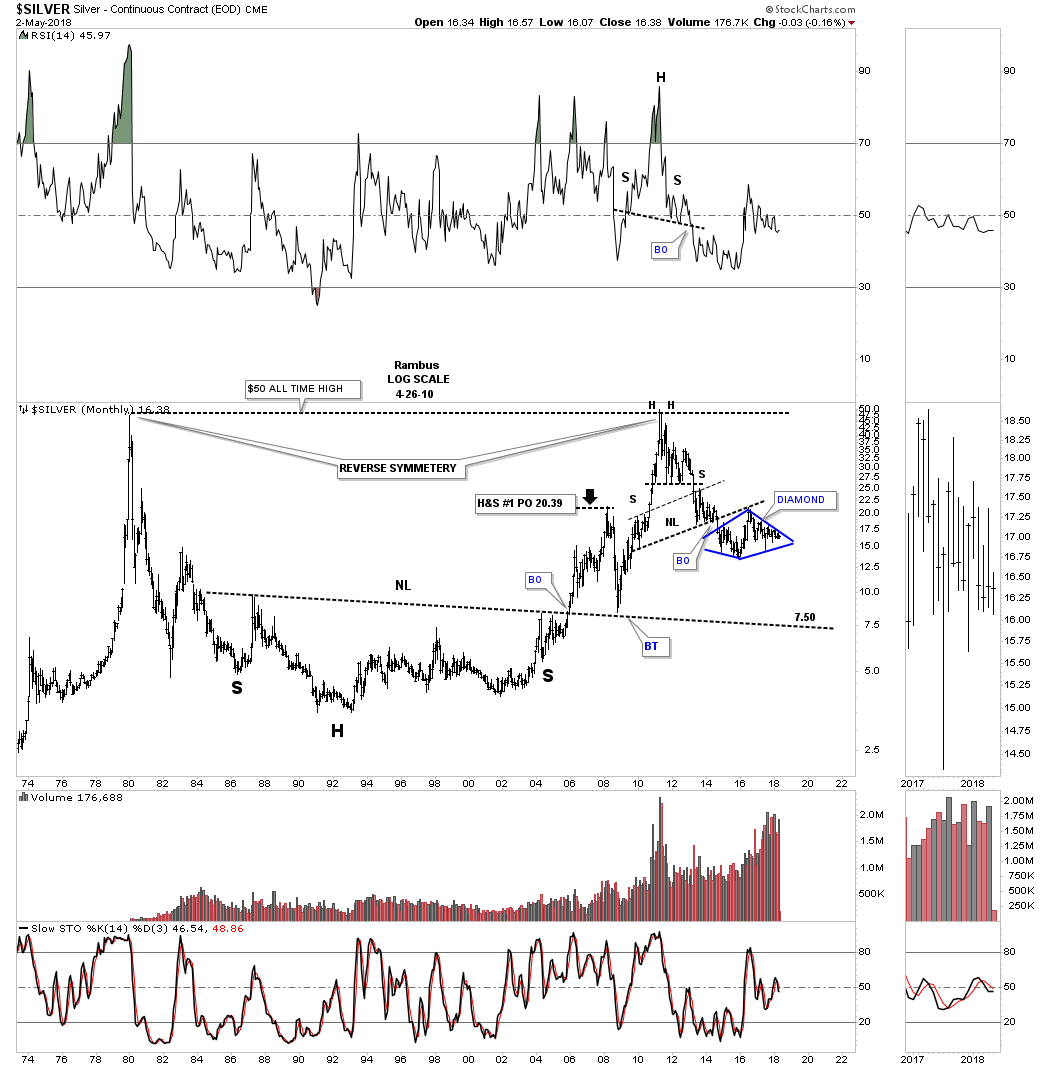
This last chart for tonight shows the H&S top in more detail with the blue diamond forming as the backtest to the neckline.

I want to apologize for being late tonight, but I had to dig through 100’s old charts I knew I had, but had to find them. The US dollar is going to be the key factor in what takes place with the PM complex. At this point all I can say is big patterns lead to big moves and if these big patterns play out then we are going to see exactly that.

Everyone is focused in on the potential five year H&S bottom on gold which could still be a possibility. These charts tonight give you a different perspective that you won’t find anywhere else. If they come to pass we’ll be the first to know what is actually happening. All the best…Rambus
 

Wednesday Report…SPX and GOLD Combo Chart : The Best of Both Worlds

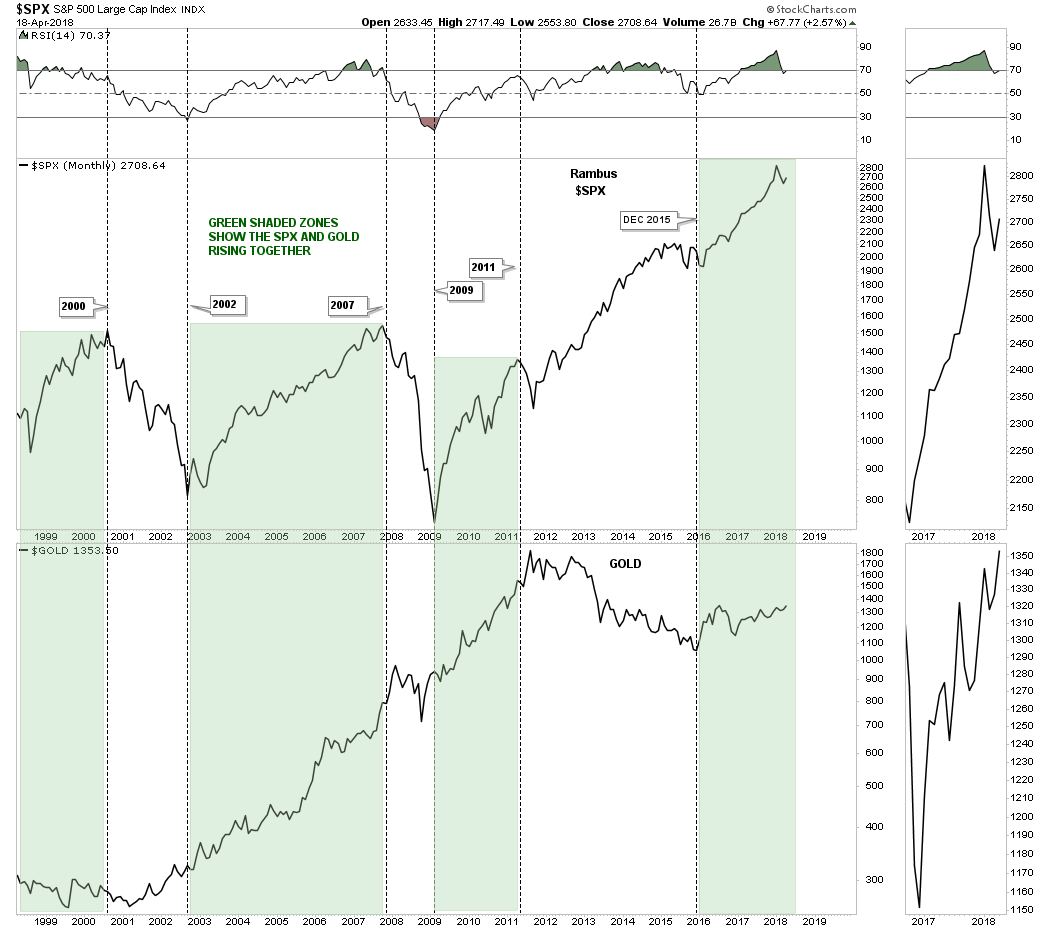
There is a misconception out there that in order for gold to have a bull market the stock markets have to crash and burn. Gold investor literally pray for the stock markets to crash so they can get their bull market in the PM complex. Once an idea like that gets embedded into the minds of gold investors it becomes hard for them to see the truth. A simple combo chart can show you the truth about why the stock markets don’t have to crash in order for gold to enjoy a bull market.

Below is a 20 year monthly combo line chart which has the SPX on top and gold on the bottom. The green shaded areas show when the SPX and GOLD both rallied at the same time. I used the rally phases in the SPX to draw in the green shaded areas to see what gold looked like.

Starting at the end of the secular bull market in 2000 for the SPX gold basically traded sideways to slightly up during the SPX’s bear market into its 2002 bear market low. From 2002 until the SPX topped out in its bull market run into the 2007 top , gold rallied right along side of the SPX. How can that be? Gold isn’t supposed to have a bull market when the SPX is having one.

The SPX did top out slightly ahead of gold and had a much bigger correction than gold into 2009 crash low, but they both declined without gold producing a new bull market relative to the SPX. You can also see gold actually bottomed just ahead of SPX in late 2008 , while the SPX bottomed out in March of 2009. For the next two years the SPX and GOLD both enjoyed a strong bull market move into the 2011 high.

Again gold topped out just after the SPX in 2011, but this time gold began its cyclical bear market while the SPX continued higher with its bull market. Gold finally bottomed in December of 2015 and from that point both the SPX and GOLD have been rising together. How long will they move up together is anybodies guess, but this combo chart suggests that we don’t have to see the stock markets crash in order for gold to have a bull market. Maybe we’ll see the best of both worlds which would be good for everyone. All the best…Rambus

Transportation Average…

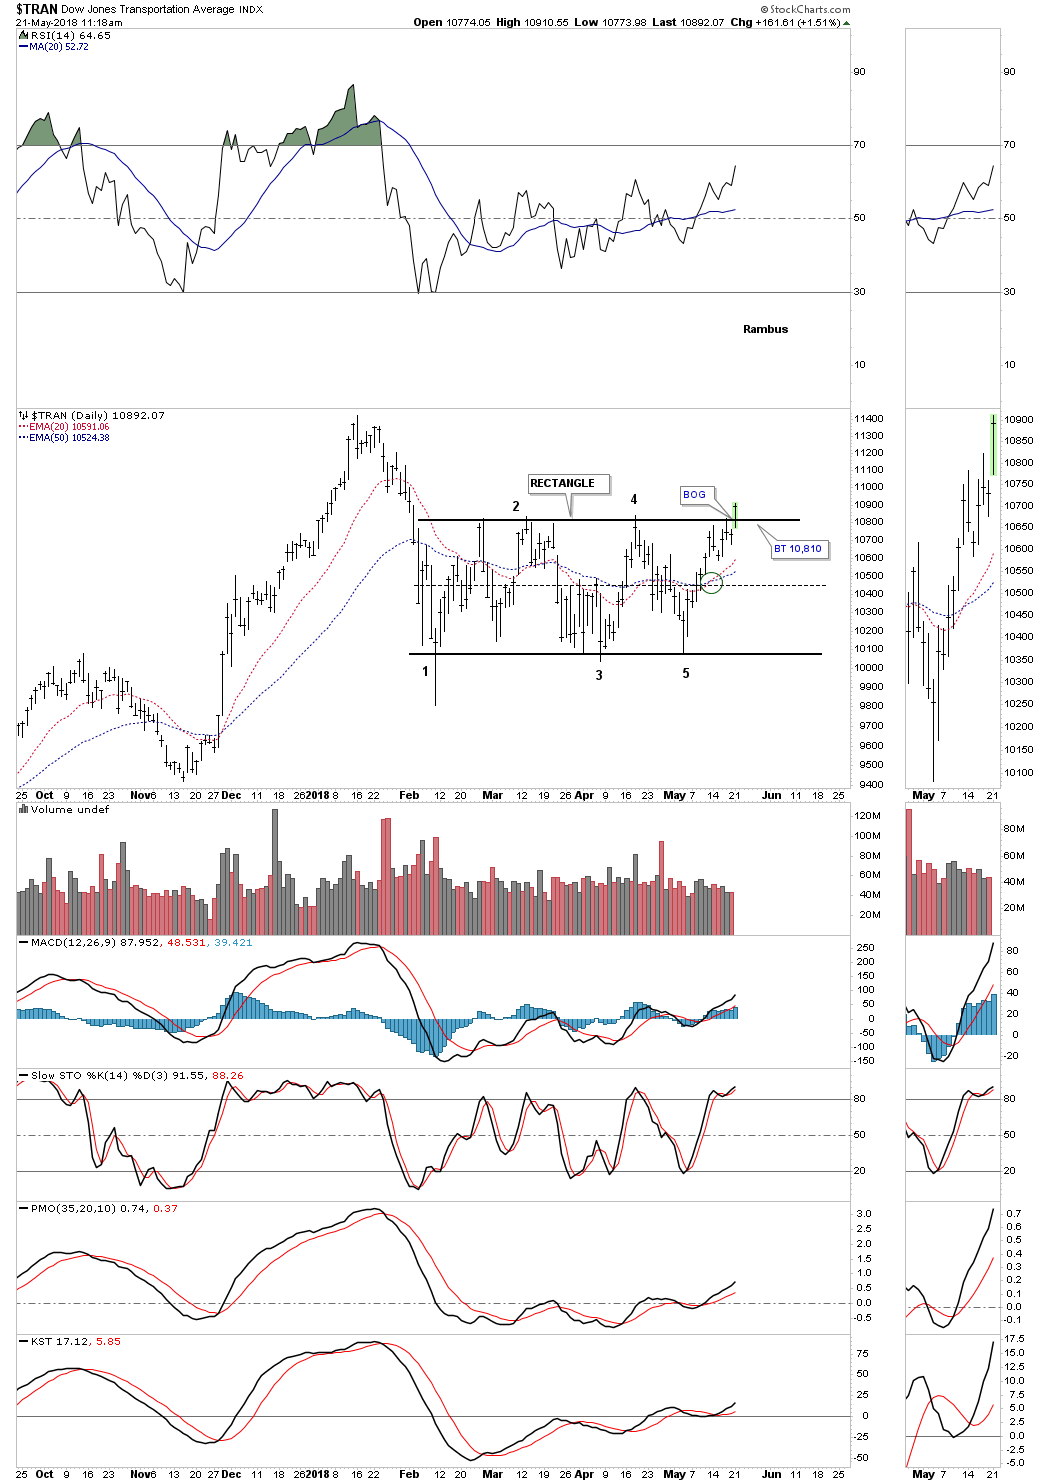
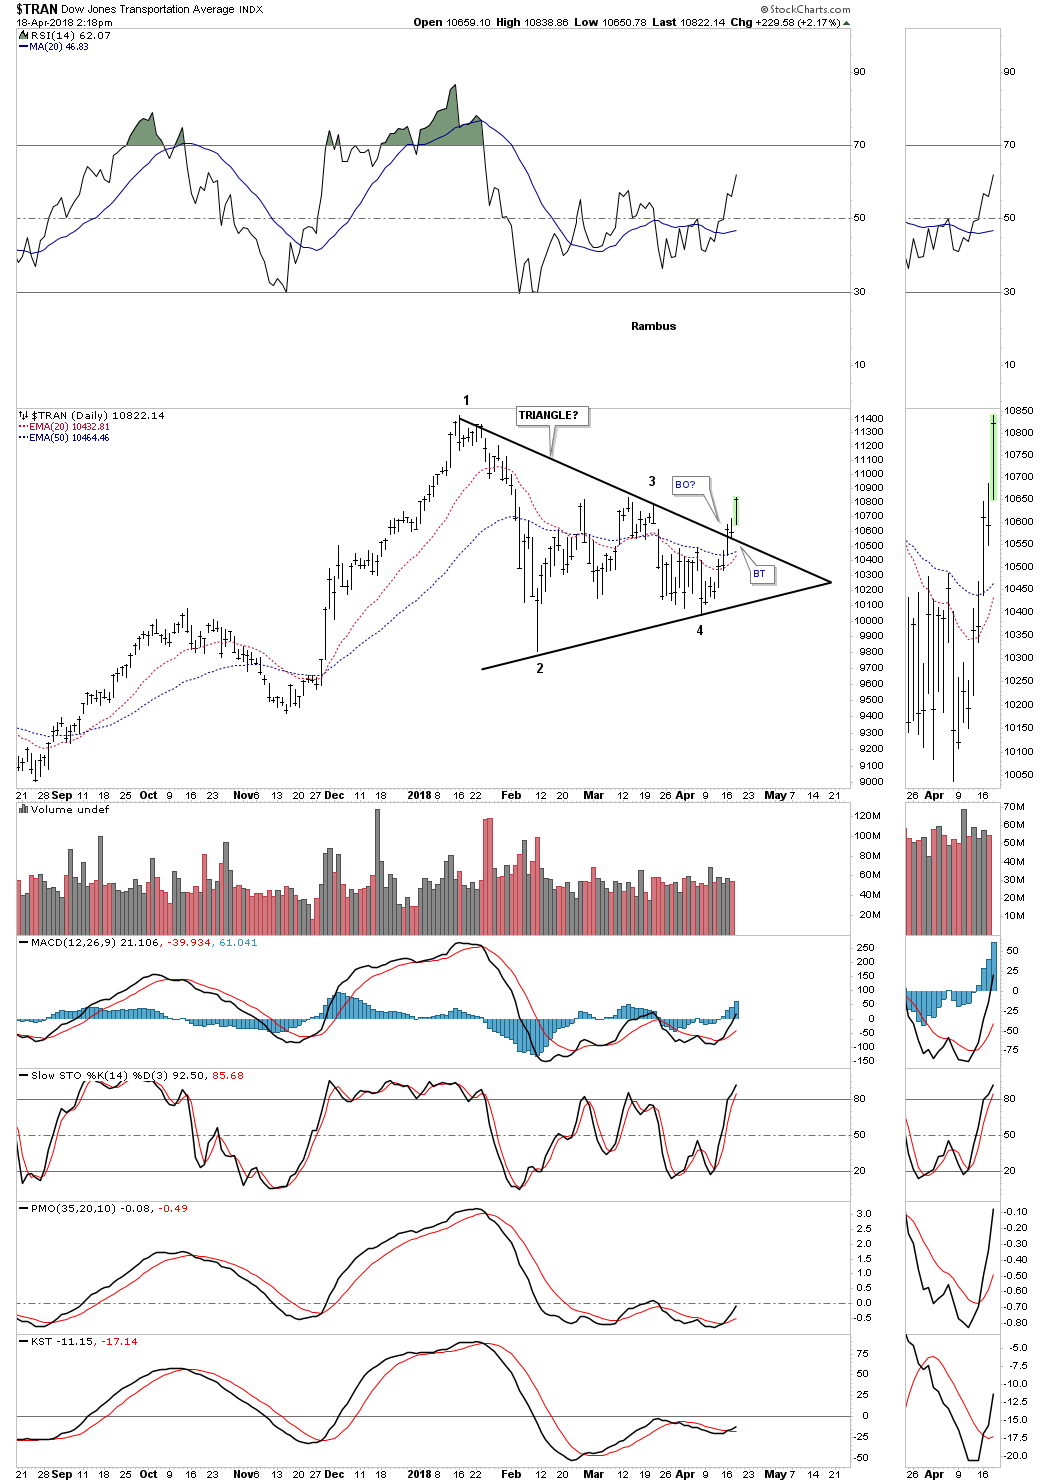
If the US is going to have a strong economy it’s important that the Transportation Average confirms that by showing strength. Below is a daily chart which shows a breakout and backtest to the top rail of its triangle consolidation pattern yesterday. This triangle looks a lot like many of the other triangles we’ve been following on some of the US stock markets.

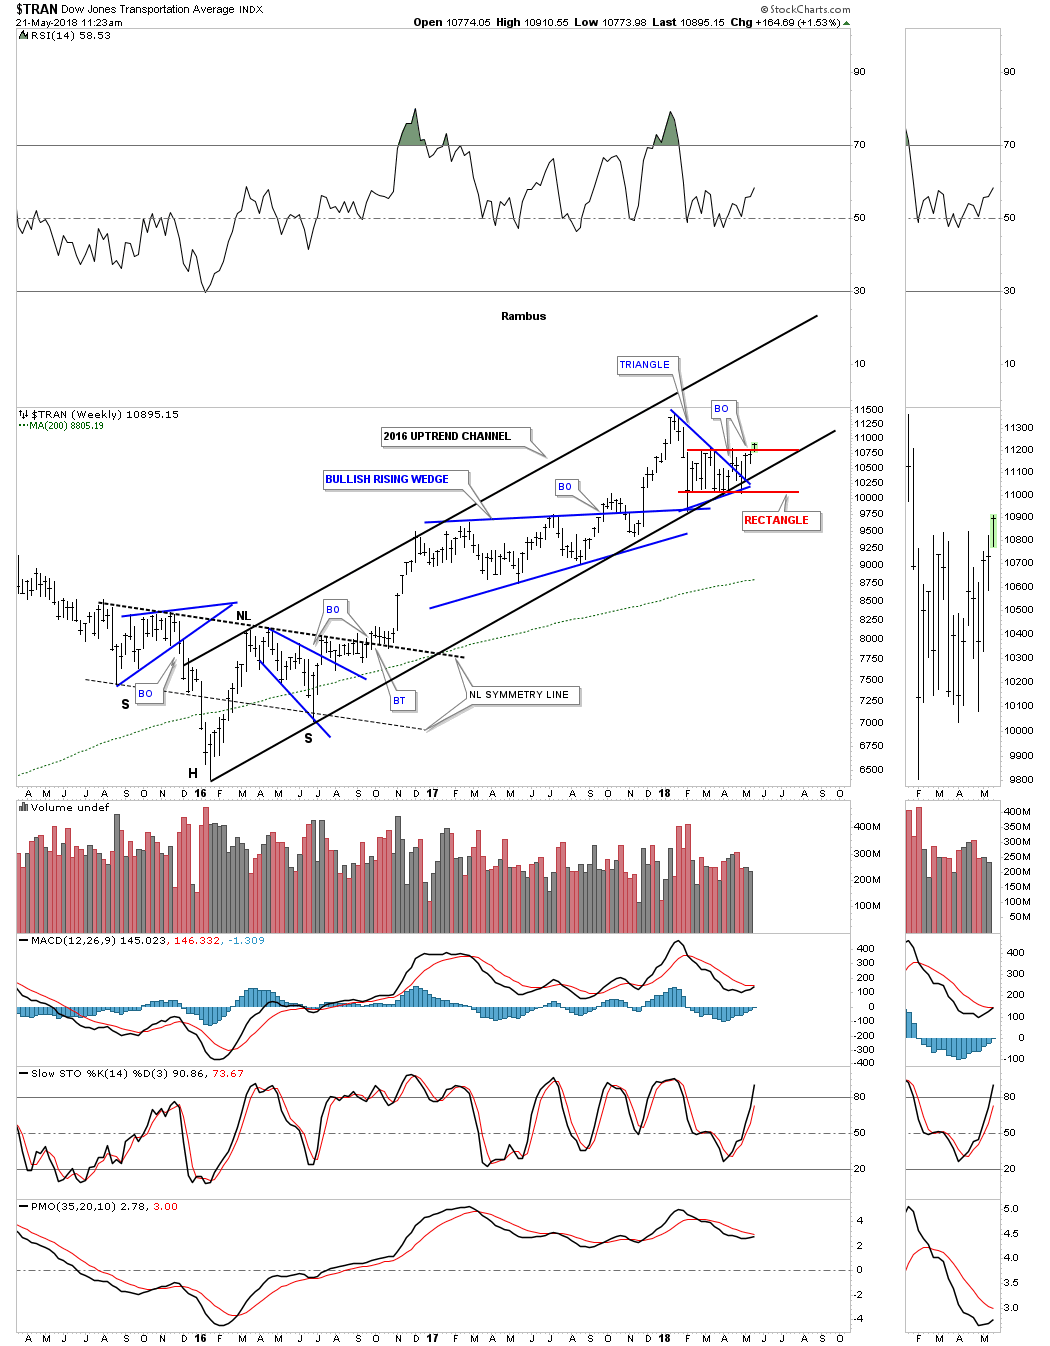
Just like most of the US stock markets we’ve been following the Transportation Average is building a triangle consolidation pattern on the bottom rail of its 2016 bull market uptrend channel.

Late Friday Night Charts…Time for the Gold Bulls to Show their Mettle .

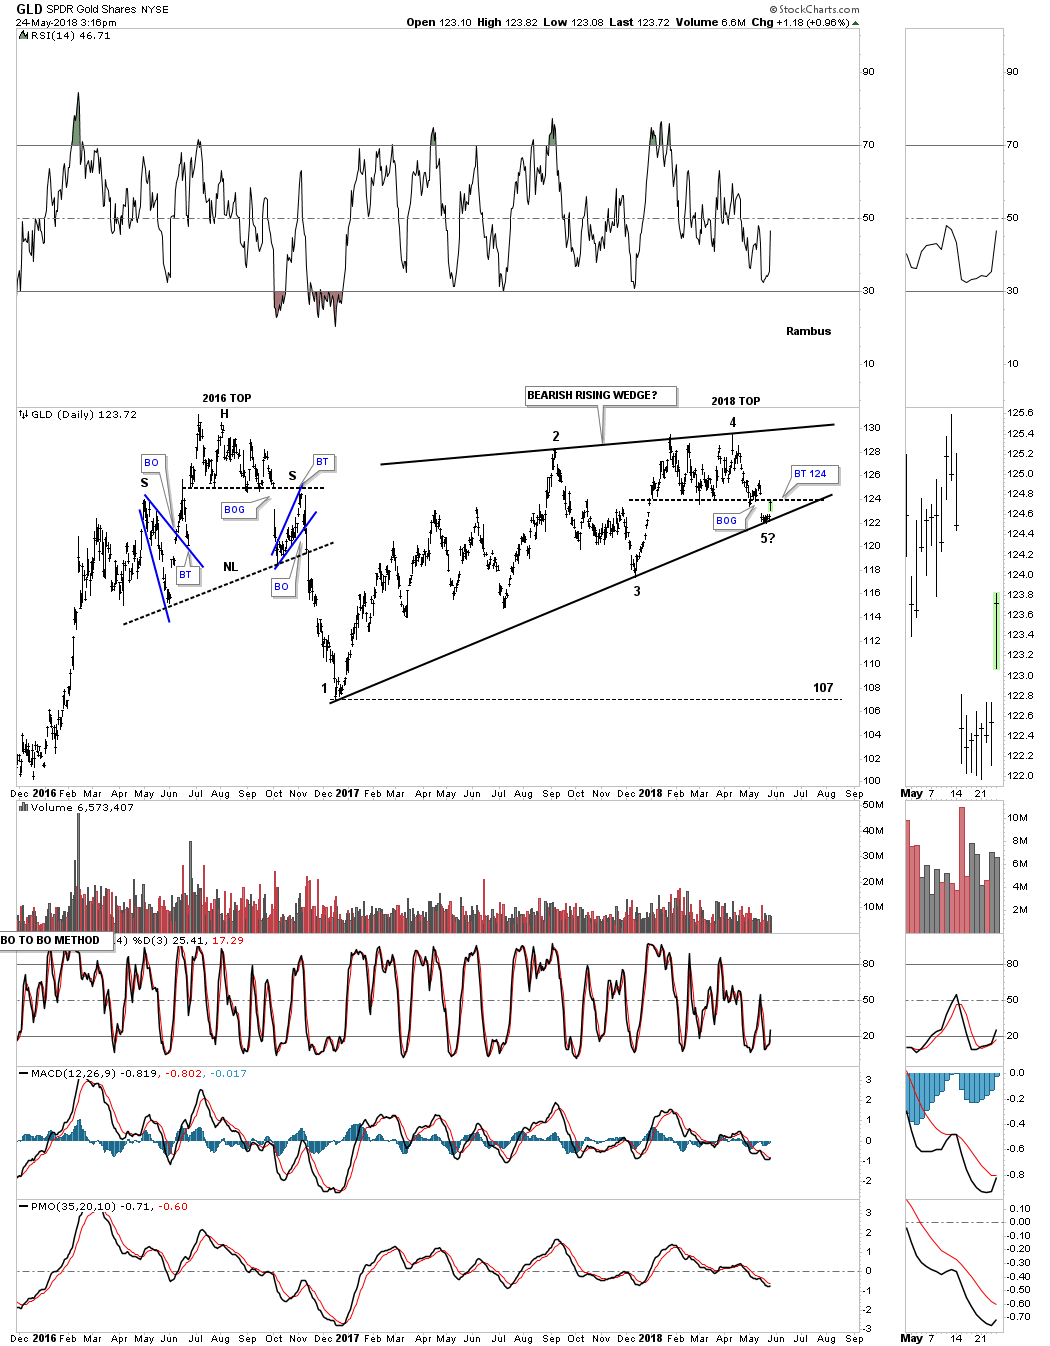
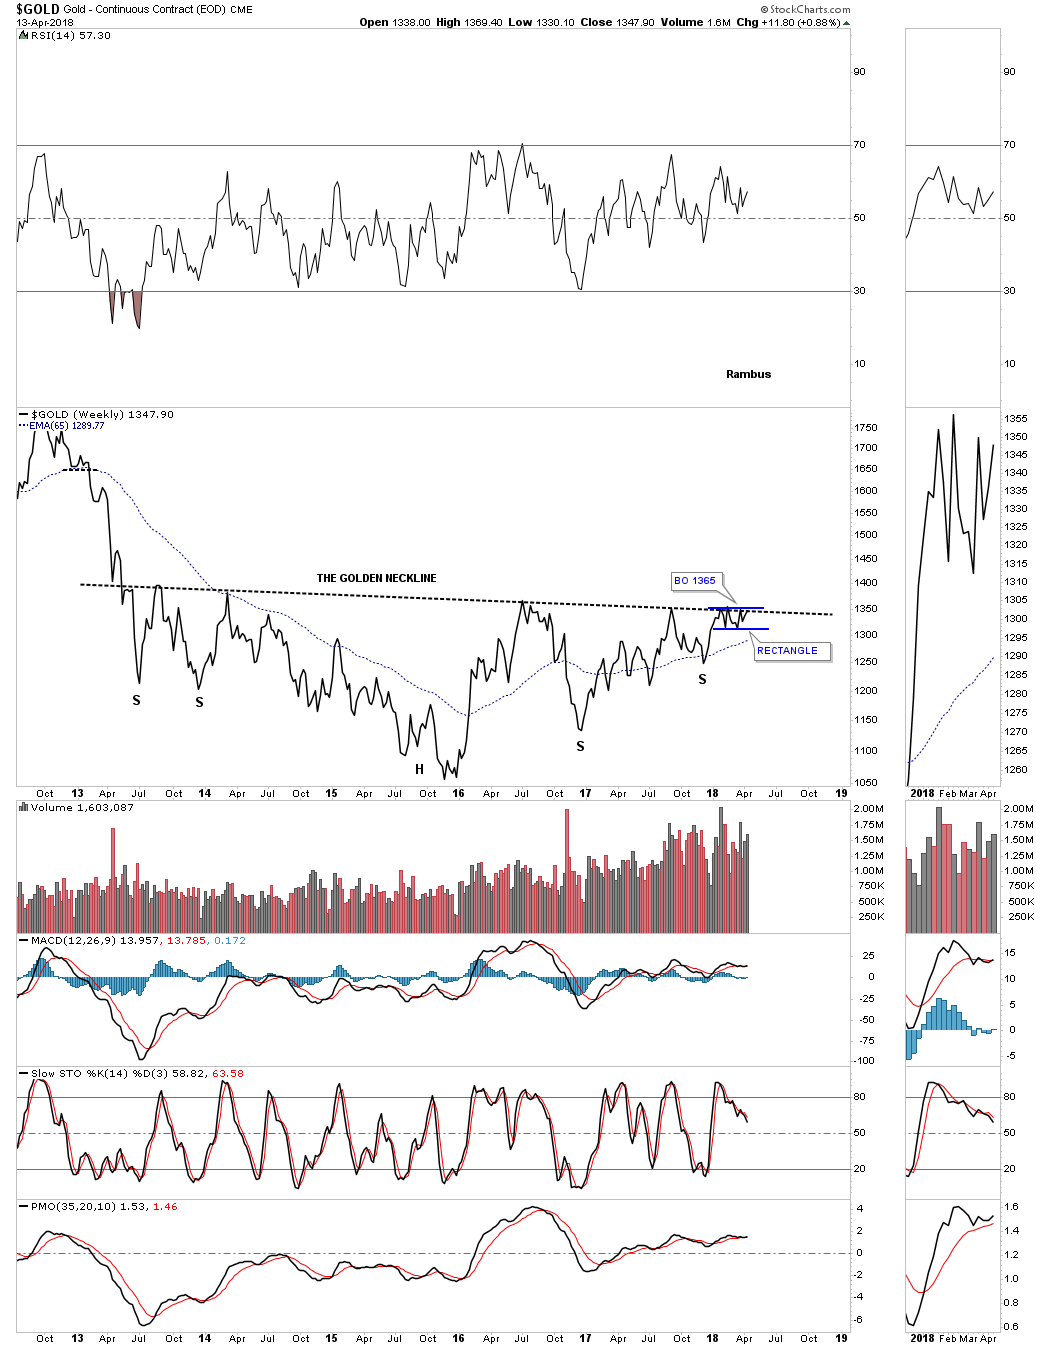
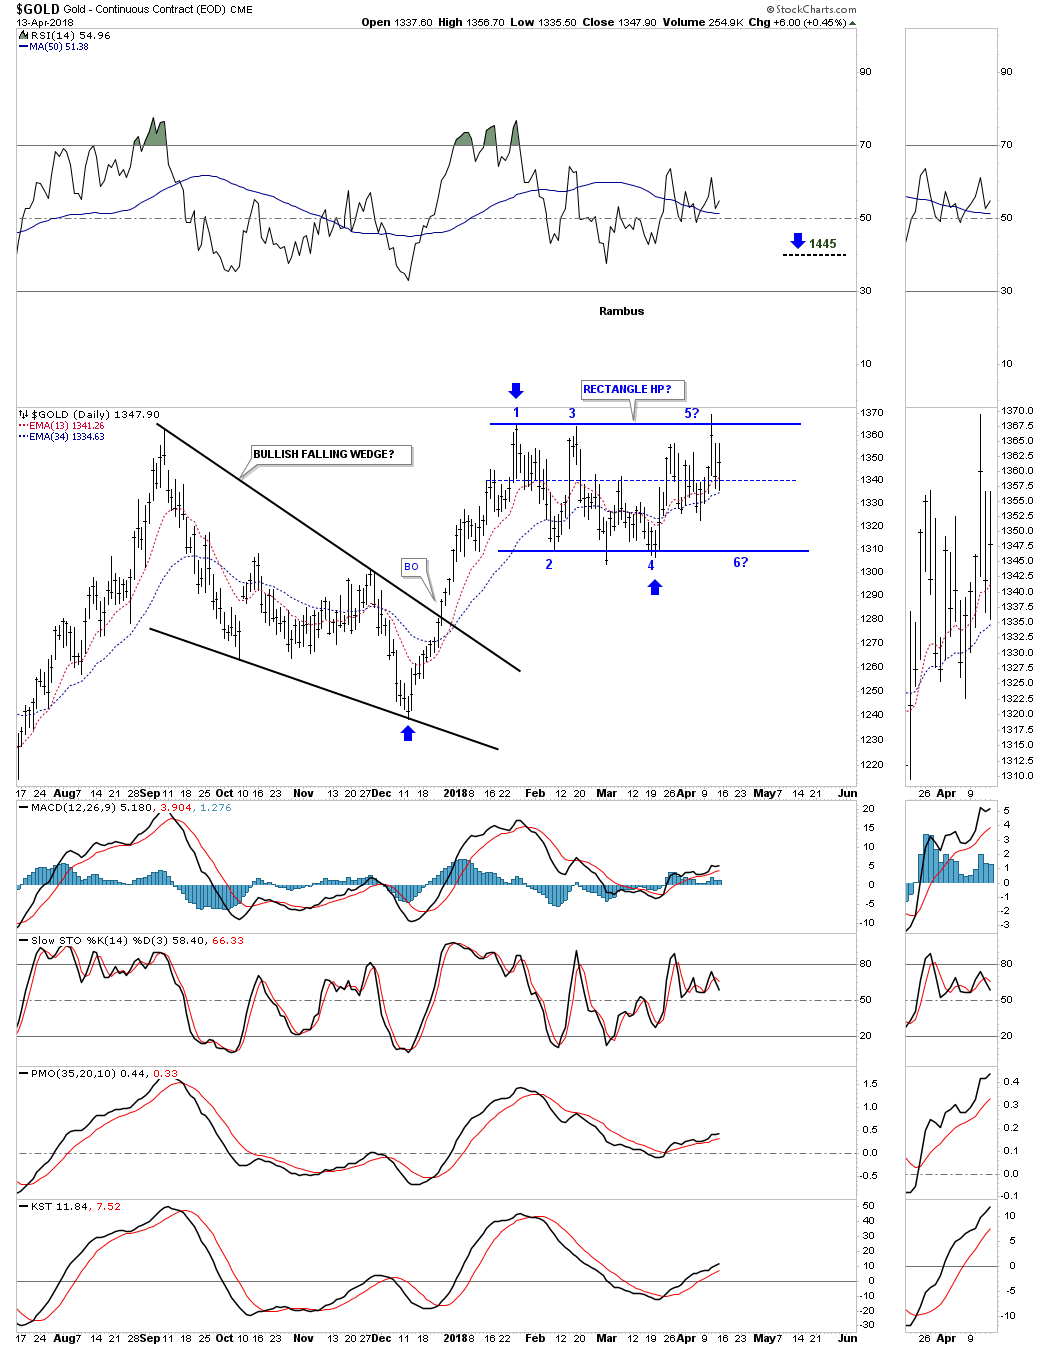
For the last three months gold had been chopping out a rectangle trading range which has completed four reversal points so far. Wednesday of this week it looked like gold may breakout above the top rail but the bears stopped the advance just when it looked like the bulls were finally going to win.

Many times before a rectangle is finished building out there can be one last move back down to the center of the rectangle where support is found. If the bulls are truly in charge they could take this oppurtunity to rally gold up and through the top rail to complete the rectangle as a halfway pattern. If the bulls can muster up enough energy to take out the top rail the rectangle would have a price objective up to the 1445 area as shown by the blue arrows. At this point there is no way to know if we’ll see another reversal all the way back down to the bottom of the rectangle which would complete the 5th reversal point. It’s still a consolidation pattern at this time.

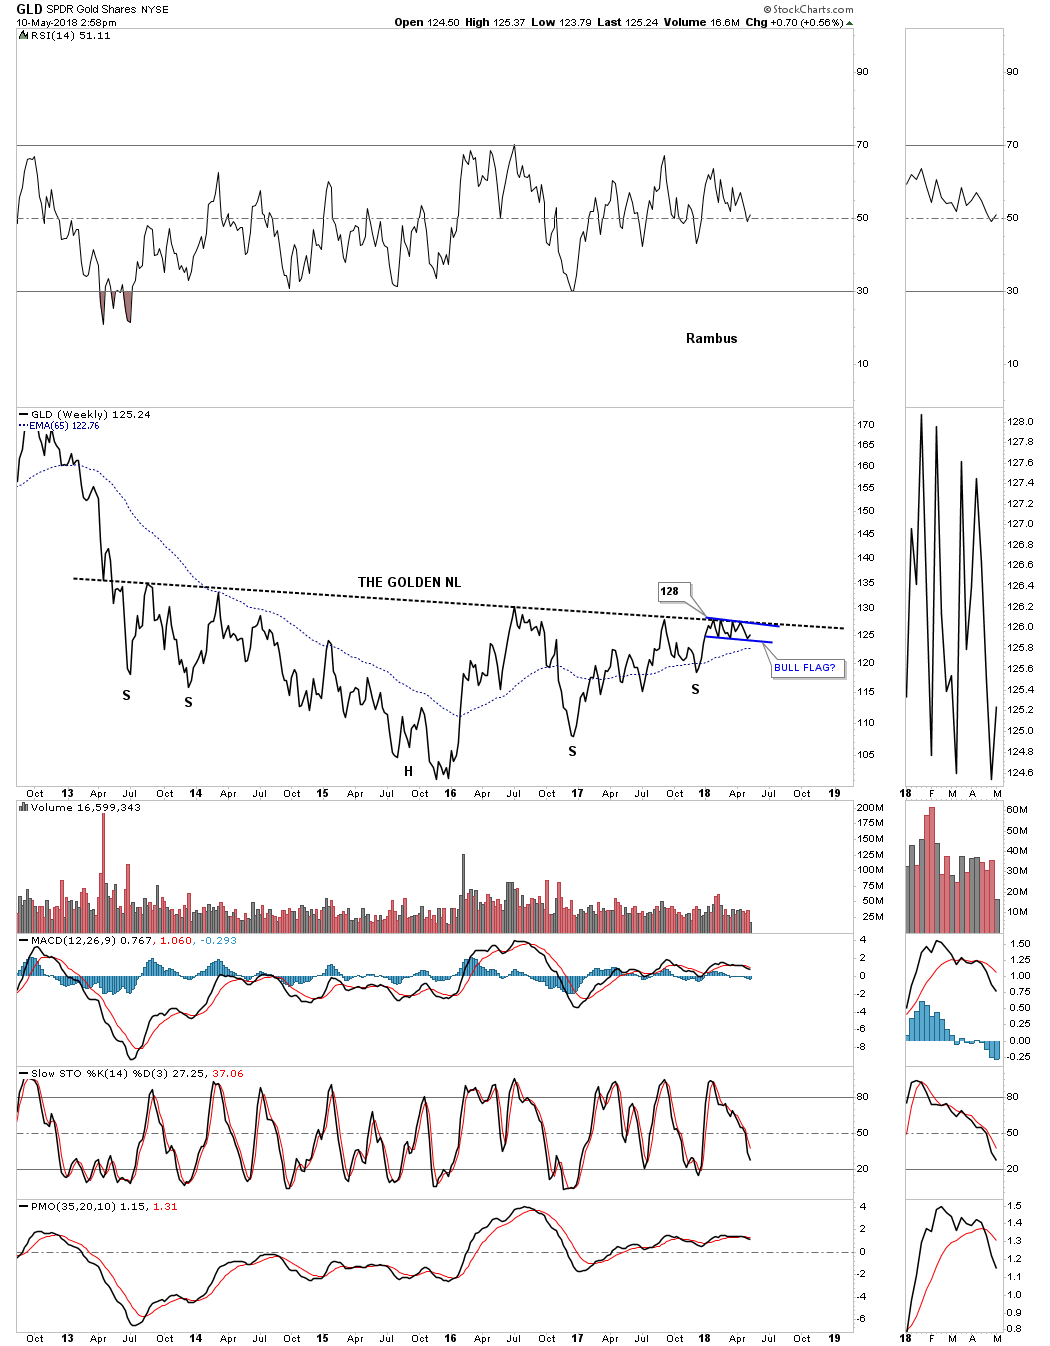
Below is a weekly line chart which shows the possible five year H&S base building out. The three month rectangle we just looked at on the daily chart above is building out just below the neckline. We’ve discussed many times in the past that it can be a bullish situation when we see a small pattern form just below an important trendline, in this case the neckline. These smaller patterns can give the energy a stock needs to finally takeout that important trendline. Gold tested the neckline again this week pushing slightly above the neckline, but the bulls were unable to hold on.

We know that neckline is very hot by the many touches it has had in the last five years. If gold is finally ready to breakout it will be interesting to see how it does it. Since there is such a well defined line in the sand we could see a big breakout gap as all the bears that have been defending that neckline are finally exhausted with none left to put up a fight. The line in the sand comes in at 1365.

Below is the exact same chart as the line chart above, but this chart is a bar chart which shows how the blue rectangle has formed just below the neckline. If there was ever a time for the gold bulls to show they mean business this is their golden opportunity.

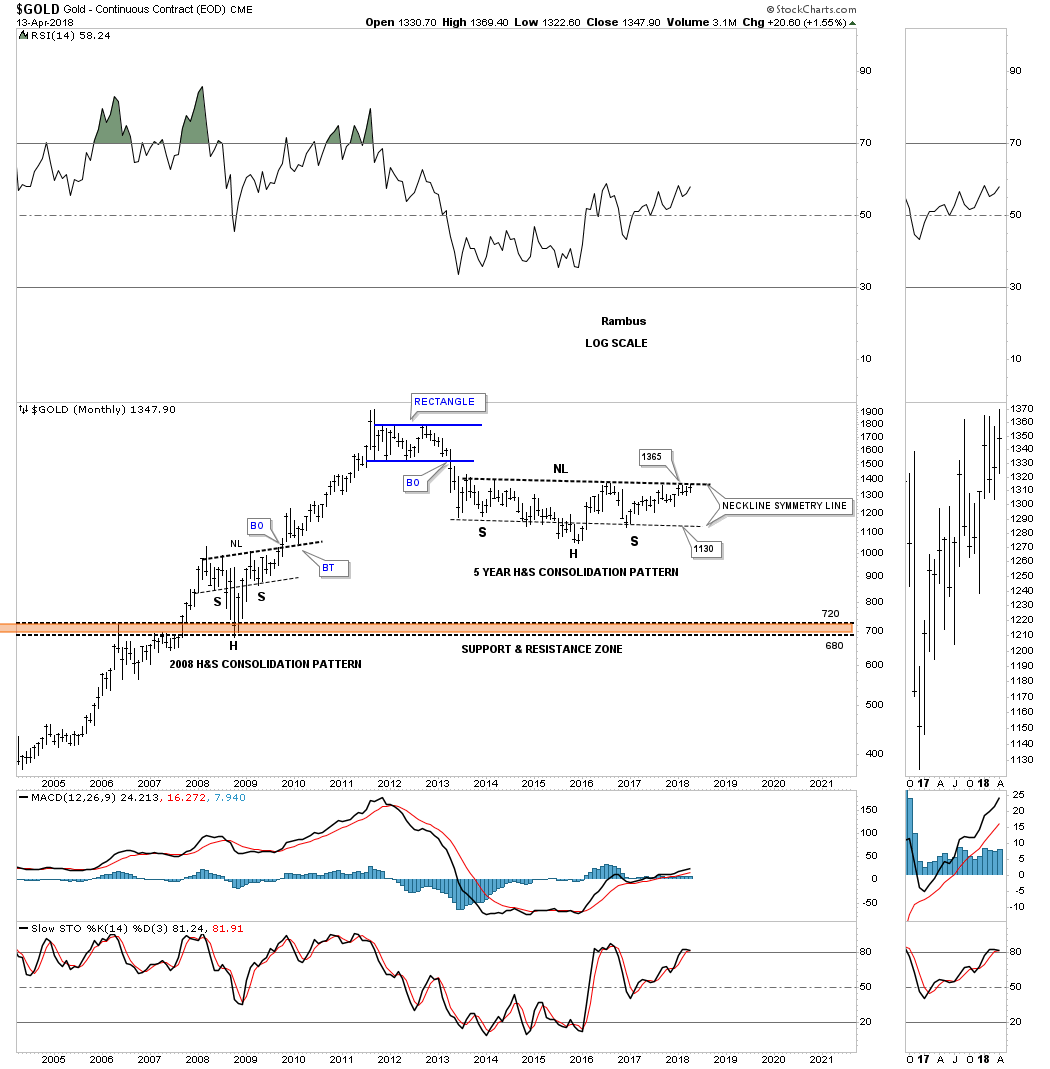
During the 2008 crash gold built out a very symmetrical H&S consolidation pattern which led to the final rally phase into the 2011 high. As you can see it took roughly four months for the breaking out and backtesting to the neckline to finally complete the pattern. It will be interesting to see what this chart looks like in six months.

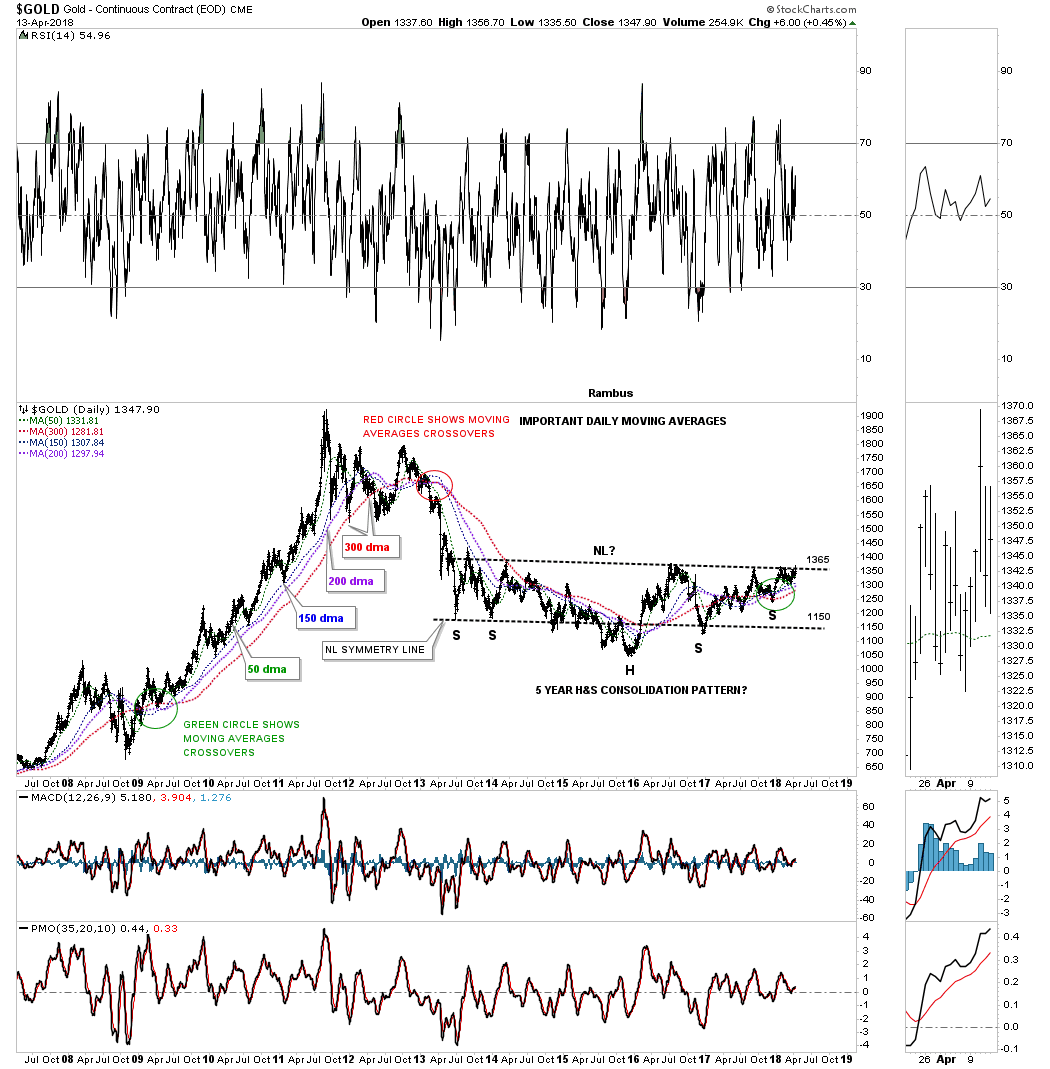
It’s been a long time since we last looked at this long term daily chart which shows what I consider to be the most important daily moving averages for gold. Whenever the next rally phase gets going in earnest these four moving averages, when they become properly aligned, will show us where to look for short to long term support. The 150 day ma did a good job of showing us intermediate term support while the 300 day ma showed strong long term support. With the formation of the second right shoulder you can see the moving averages are pointing higher which is what we want to see.

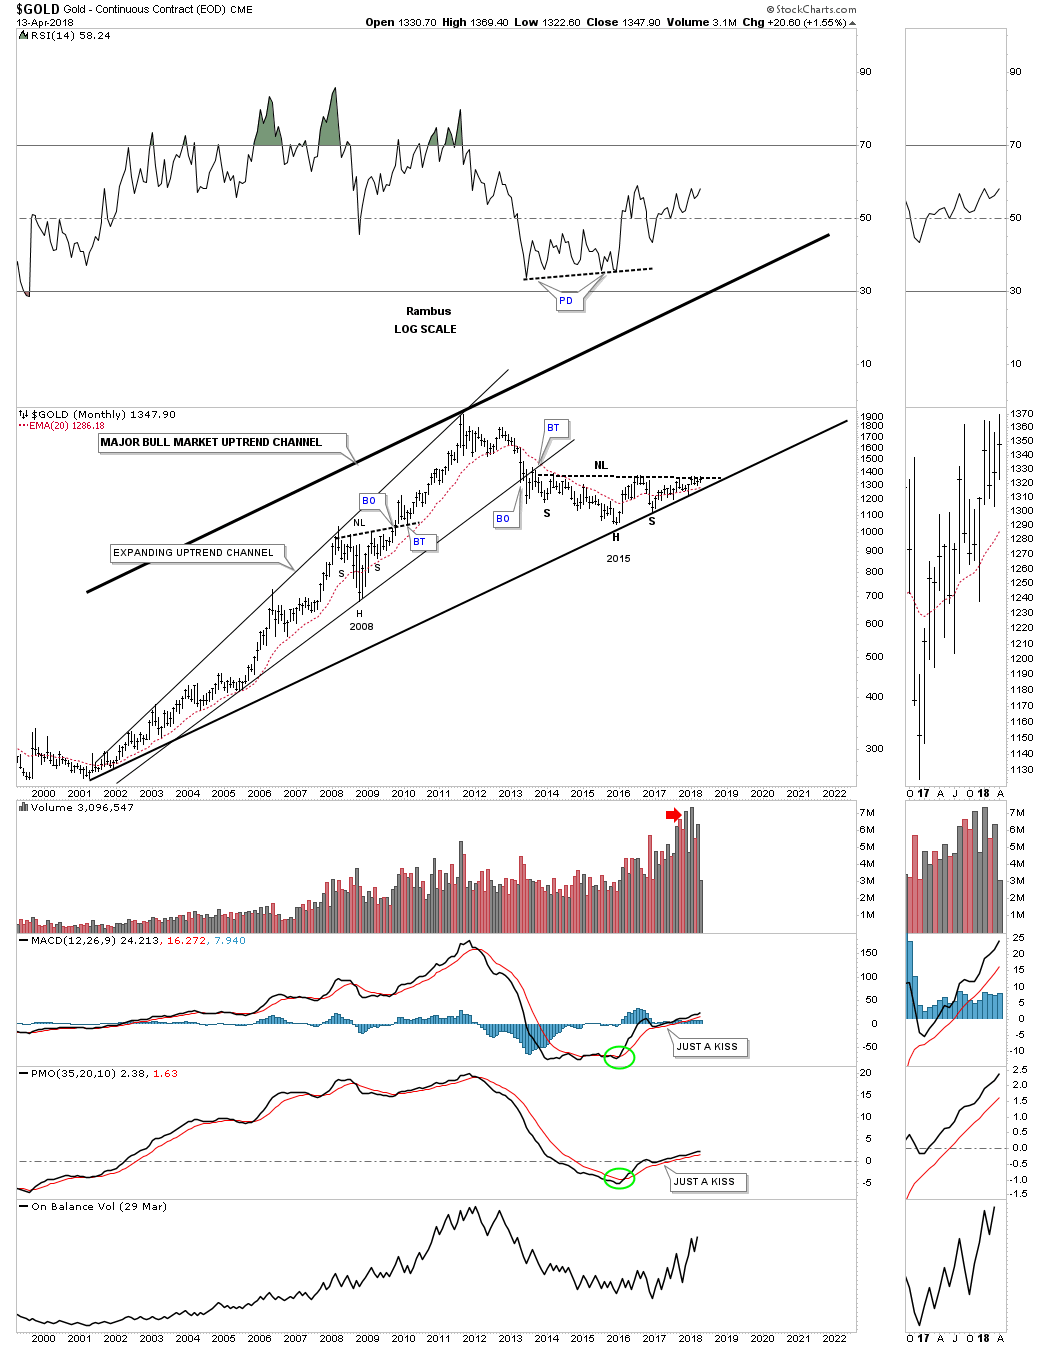
Below is a 20 year monthly chart which shows how the current H&S consolidation pattern fits into the big 20 year bull market uptrend channel.

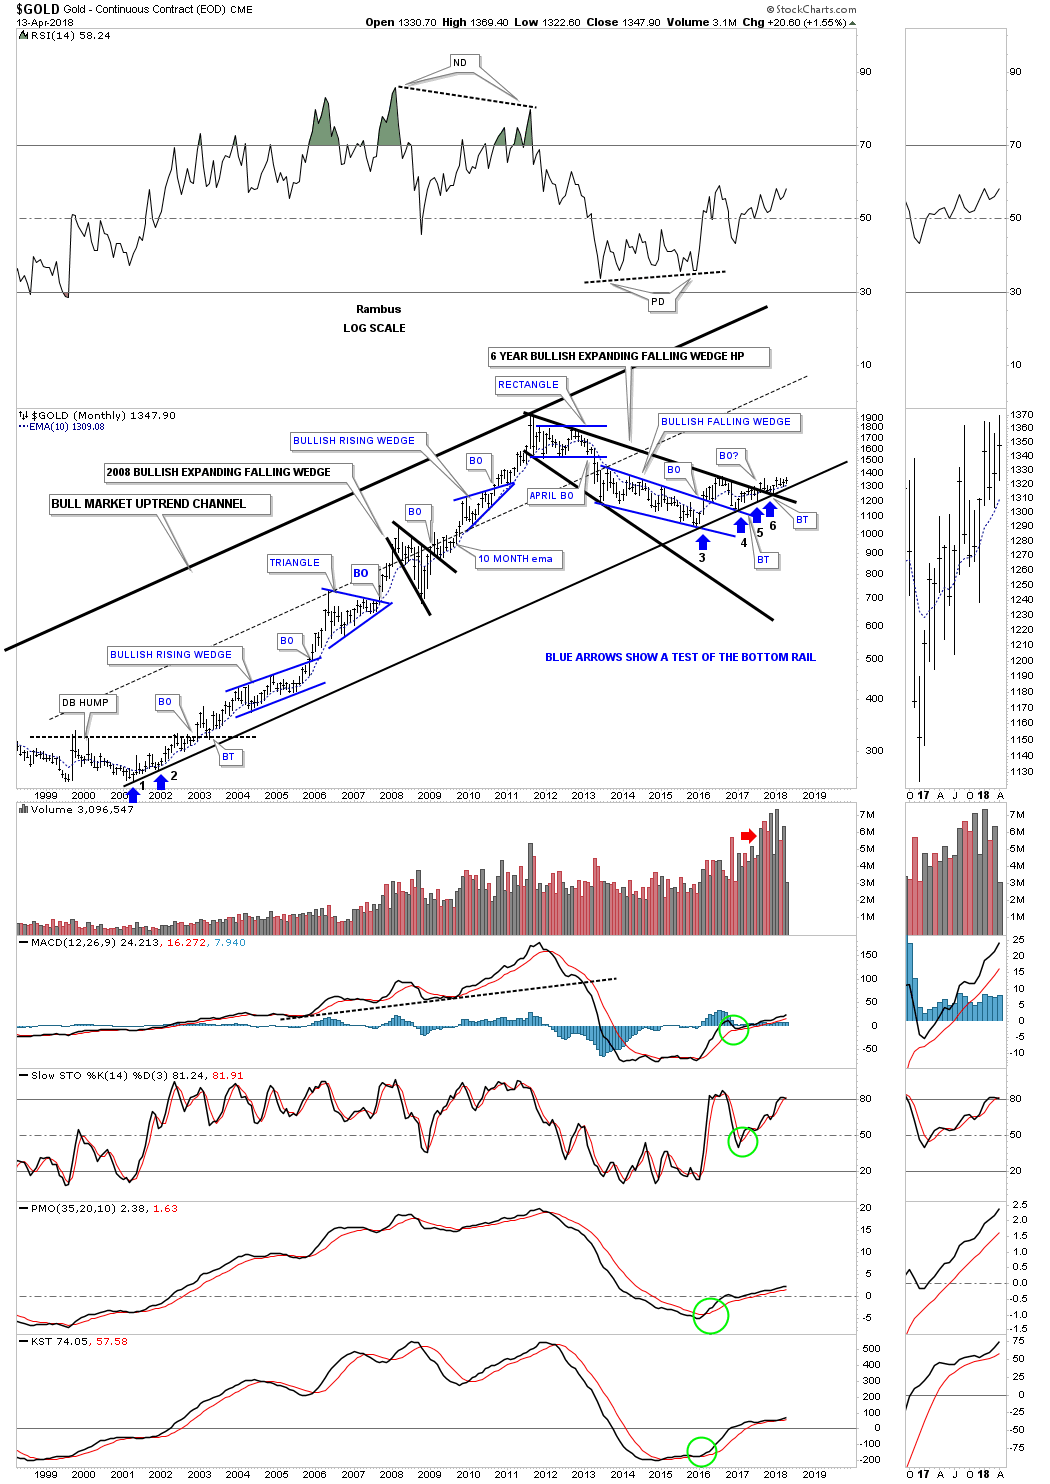
Below is another way to look at gold’s bull market uptrend channel which is my favorite long term chart. This chart shows all the consolidation patterns that formed during the first phase of gold’s bull market. Since 2011 gold has been consolidating that first phase by building out the black expanding falling wedge.

There is some really nice Chartology if you follow the price action starting at the blue arrow marked with a #3 on it. One of the reasons its taken so long for gold to really start moving up is because of all the work it has had to do with the breaking out and backtesting of all the important trendlines. Gold has been painfully climbing along the bottom rail of the major uptrend channel that has been tested six times so far so we know it’s hot.

I don’t show it on this chart, but when the H&S neckline we looked at on the above charts gets broken to the upside, that is when we’ll see the price action start to accelerate away from the bottom rail of the major uptrend channel. I’ve always said that gold produces some of the nicest Chartology of any market sector out there. If gold was manipulated as many seem to think there is no way you would get such beautiful chart patterns.

Now is the time for the gold bulls to step up to the plate and walk the walk. This is the perfect time to launch the next leg of gold’s secular bull market. Everything is in place, now we wait and see if the gold bulls mean business.


Late Friday Night Charts…The Beautiful Chartology of SLV

SLV along with the PM stocks have been under performing gold in a pretty significant way. Normally you would like to see the PM stocks outperforming gold on the front end of a bull market similar to what we saw back in the beginning of the 2000 bull market in the PM complex. So far that hasn’t been the case.

Below is a weekly chart for SLV we’ve been following for a long time now as it has been chopping out the nearly four year diamond trading range. The first thing that would get my attention would be if the price action could takeout the top rail of the seven point diamond which is technically a reversal pattern at the moment. A touch of the bottom rail would complete the 8th reversal point which would be a consolidation pattern to the downside if the bottom rail is broken. It wouldn’t hurt to see SLV trade back above the 65 week ema if one is a bull.

This next chart for SLV is a longer term weekly look which puts the diamond in perspective. If you’re a long term member you may remember the 8 point diamond that formed back in 2012 which led to a big impulse move down.

This next weekly chart has a lot of Chartology on it which shows SLV produces some really  nice chart patterns. The 2008 crash low produced the head of a large H&S consolidation pattern which led directly to the the high at 50. Note how the right shoulder was a small H&S pattern. SLV also built out a beautiful red bullish rising flag as a halfway pattern to the 50 area in time and price. So far there is nothing on this chart that strongly suggests to me the bear market is over and a new bull market has started.

Since the April 2011 high which took place a full five months before gold and the PM stock indexes topped in September, we can see one consolidation pattern forming below the previous one. The current diamond has a chance to be a reversal pattern, but the bulls need to take control so until then the downtrend continues. SLV has gone virtually nowhere in nearly four years which has been dead money if any one is a long term holder.

This last chart for SLV is a long term monthly chart which shows its parallel double trendline downtrend channel. It wouldn’t take a lot of work to turn SLV bullish, but the bulls need to step up to the plate with action and walk the walk. I would love for nothing more than to see the diamond resolved to the upside. Have a great weekend and all the best…Rambus

Editor’s Note: Here is the original Silver Diamond Post from 2012…Seems Silver and Diamonds are a thing

https://rambus1.com/2012/12/23/weekend-report-a-look-at-silver-and-its-diamond/

Market Update- Complacency Reigns Supreme

I had intended to post part III of my interest rate series, however market conditions dictate that I post views on the current market.  This market is now communicating that it is at high risk.  For two months now,  I have been advocating a strategic retreat.  Head for the sidelines and watch the action with an unemotional detachment.  The market is now sounding the alarm and one should be on high alert for a downside acceleration.

Plunger’s Bullet Points 

Here are the main points I have presented over the past few weeks:

  1. The market has been in a final Phase III since the Trump election- it lasted 16 months.
  2. Secondary Reactions rarely occur in Phase III- Therefore, any major decline could very well be the end of the bull market and not just another correction.
  3. Dec 2017-Jan 2018 was a classic buyers capitulation which traced out as a steeple top in many indexes.
  4. The proper course of action for investors should be to execute a strategic retreat and head towards the sidelines. One could redeploy capital once the market resolves itself according to DOW Theory methodology.
  5. Rising rates are in the process of bursting the largest credit bubble in history.
  6. The bursting of the bubble will usher in a Post Bubble Contraction.
  7. Gold stock bull markets are most robust within the confines of a PBC.
  8. Phase I of a new bull market in the gold stocks began in Jan 2016.
  9. Phase II started in Dec 2016, however initial action is characterized by further consolidation and lethargic action resulting in investor doubt and discouragement.
  10.  Excessive bearishness in the gold sector is unwarranted despite weak looking price action.

The largest financial bubble in history is concluding and one should prepare his bomb shelter and know how to protect oneself.

Supreme Complacency

I am standing on a mountain top and shouting-REDUCE YOUR RISK

Am I calling for a crash? – No, I am not, however conditions exist which would allow a crash to happen.  We are now 2 months after the highs put in by the major indexes world wide.  This is the timeframe that crashes have traditionally occurred.  1929 and 1987 are classic examples.  Complacency reigns supreme as dip buyers are getting lathered up for another romp to the upside.  Don’t believe me?   Check out this Charles Schwab email I received in my inbox and don’t miss the name of it:

Bullish Investors typically continue buying one third of the way into a bear market, up until the point of recognition. After this point the pain becomes too great and they then retreat.

The arrogance and cluelessness of both the average investor and the financial establishment astounds me.  Take the FED, they think they can create $4.5 T of QE and then simply yank $1.8 T of it right out of the market while simultaneously increasing government borrowing by $1.2 T/year, all while threatening the largest buyer of T-Bonds with a trade war!  So after years of QE they think they can just turn the dial the other way and reverse it… astounding. Problem is, it doesn’t work that way.

This historic giant bubble is in the process of bursting- it’s now just a matter of time.

But enough of what Plunger has to say, let’s turn our eyes towards the market and listen to its message.  You know the line: I report…you decide:

First we will look at the big picture according to Dow Theory, then individual market leadership to include the FANGS and the FAB 4 then we will update our tour around the world.  Hang on as its going to be a wild ride…

DOW Theory Update

Friday’s action was huge as we now are poised to trigger a secondary reaction in the senior index.  I have gone back and reviewed the works of the great DOW theorists and conclude that we will use closing prices, not intraday extremes to determine market action.  Therefore the DOW has now violated its February lows and the Transports sit right at the lows.  One more closing down day in the transports triggers a SR classification:

Next we see a line chart with intraday prices:

The significance here is in the volume.  Note down days are on elevated volume.  I have posted numerous times the 10 year chart of decreasing volume throughout this bull market and compared it to the 1932-1937 analog.  It is the only bull market that resembles what we have seen from 2009-2018.  The 1937 bull market ended with a 50% decline in 12 months.

Now here is the shocker… The throw over top has now broken down into the channel. This is very bearish action judging from past historical outcomes.  Don’t forget to review that declining volume! :

Do I need to remind you of the risk here?  Check out what happened in a prior occasion:

The FANGS

Moving on let’s look at everybody’s “I wish I had bought” stocks. First let’s look at Facebook.  There will be a special private place in hell reserved for this company and its founder.  This company is becoming the poster boy for corporate abuse of its customers.  Just check out what Zuck thinks of his subscribers:

One should be asking themselves in light of recent revelations why would one knowingly volunteer to place oneself into an intelligence gathering operation on oneself?

Plungers recommendation: Cancel your Facebook account if you haven’t done so already. Then short the stock!

Daily chart… keep in mind this has been a market leader for the bull market:

And its not over yet:

AMZN NFLX GOOG I haven’t marked up these charts, but I leave it up to you to draw conclusions.  I would be out of them even though AMZN and NFLX have not broken down yet:

The Fab Four- The generals of the market

Over the past year the Fab Four (MCD, BA, MMM, CAT) have led the market higher and powered its advance.  Every market needs its generals and they were it.  Note how these 4 generals are all in the process of breaking down.  Once the market broke in early February and the bounce began these stocks should have resumed their advance to a new high due to the flow of money resuming back into them. The fact that this has not happened tells one the market has changed.  Worse still they are now in full breakdown mode:

MCD

Boeing

MMM

CAT- Heartland Favorite

Financials

They say a bull market has to have a healthy financial sector. Let’s take a look at the ultimate money center Rockefeller bank:

A Trip Around the World- Global markets imploding

In the following series of charts keep your eye trained on the following patters. Upside acceleration from December to January indicating buyers capitulation followed by upside exhaustion.  Steeple tops resolving into Island reversals.  And finally notice how contracting triangles have built out on the NL of the right shoulder.

Germany

First off Germany wins hands down the most ugliest market chart.  Don’t know why this has traced out such ugliness, but its there:

It’s got everything: Island reversal which left behind a massive zone of distribution and an army of trapped investors.  A massive broad H&S top with urgency gaps slicing right on through the 150 & 200 EMA as if they were not even there.  And now we have the break below the NL.  The weekly below shows how stochastics have flatlined like a dead EKG.

Global Indexes

Here is a look at all the world…gulp.

Here is Vanguard’s take of the world… note the buyers capitulation in the last 2 months leading into the top and the ensuing exhaustion:

The world minus the USA: Whoops.

Europe

The above chart simply is a horror show.  Double H&S Tops and now it has left behind a massive distribution topping range. Trapped Investors!

Another view of Europe-less focused on Big Caps:

London- A major international market

All the patterns are here and its now violated its NL…OMG.

Paris…Ticking time bomb

AMS-  Tick Tock…

Warsaw

Madrid

Stockholm

Zurich- Money Center

Moscow- Interesting as its the only healthy looking market

Canada- watching…

ASIA- The damage has spread around the world

Tokyo- NL drawn off the closing price shows price now violating NL

Hong Kong- World’s 6th largest market and an insight into China.

India- Tech sector not saving it.

Manila- Runner up most ugly contest.

Kuala Lumpur – Setting up

Seoul

The Big Boy- Shanghai. This could be the major pin for an unraveling

I saved this for last in the Asia series since it is so important.  Recall China has $4 T base money supporting a $40 T credit structure. Remember its all about interest rates.

Folks sit for a moment to take in this above chart. Jumping the creek of its NL in powerful fashion.  This is the market transmitting a message that this is not just a marginal break.  This is a deflationary signal of debt collapse.  It’s not messing around here.  Listen up!

Below the weekly gives it up.

The above monthly shows its hand of where it may be going.

Market collapses have signatures.  The powerful shocking collapse of 1929 announced  a deflationary implosion ahead.  No one believed it and read the collapse wrong. It wasn’t until May 1931 that the deflationary implosion signaled by the crash actually surfaced and was recognizable.  People blame crashes for economic damage to the economy, but that is not what a crash is.  A crash is simply a recognition of the underlying deterioration in the economy which has already occurred.  So when I see the daily price action of the Shanghai exchange jump the creek right across the NL with a gapped space on both sides it gets my attention.  It is sending us a message.

Emerging Markets

I have heard a few soothsayers claim this is an oasis.  Not so fast:

I suspect Brasil and Russia is holding this index up.  The message is the same once these two countries are get taken out IMO.

QQQ- The Darling

This index of course has had a religious following.  It topped 6 weeks after the main indexes did.  Big Deal… that’s what it always does.  Same thing in 2000.  And now it is displaying the same weaknesses as all the other indexes.  Island Reversal with a failed declining RSI.

General Stock Market conclusion:

If these charts do not scare the bejesus out of you then I am sorry I can’t get through to you.  I encouraged everyone take a strategic retreat months ago.  Here is my heart felt plea: This is a big deal.  Complacency reigns supreme.  If you care about your financial future… your life… run to your bomb shelter NOW.  Yes we will have a buy the dip moment and it should be tradable, but it is not advisable to think that moment is now.

A Personel Message:

I write these reports with little to no feedback.  Often times it seems I hit the send button and it simply goes off into the internet ether.  I have no idea if I am getting through to anyone.  Perhaps many think these are delusional bearish thoughts, after all the FED and CNBC say everything is going swimmingly.  They say the economy is strong and unemployment is at cycle lows.  But the key to being a successful investor is to be able to see things outside of convention.  That’s what one gets when one reads the entrails of Plunger…take it or leave it.

I have laid out the case that this 9 year bull market has been nothing more than a financially engineered event, similar to the 1932-37 bull market which ended disastrously.  This market and financial bubble are much, much larger than that era and has the risk of deflating even more violently than the 1937 market.  This has now become a global event, there is no conventional place to hide.  I am in cash, and in the precious metals sector with a short DOW position.  Good Luck because you are going to need it.

Coming soon is the bullish case for gold and the gold stocks.

Editor’s Note

Plunger is an Associate Writer and Resident Market Historian at Rambus Chartology

https://rambus1.com/


Really Late Friday Night Chart…

I haven’t posted much on the US dollar as it has been trading at an important level on the six year weekly bar chart. The last time we looked at this chart the price action had just broken below the bottom rail of the five point expanding triangle which is technically a reversal pattern. I showed how a backtest to the underside of the bottom rail at the 90.50 would be critical to the overall big picture. The bottom line is that as long as the US dollar trades below the bottom rail of the expanding triangle the bears are in charge. If the bulls can take the US dollar above the bottom rail they will be in charge. As it stands right now the bears are in control. Note how the bottom rail has reversed its role to what had been support from above to resistance on the backtest.

Wednesday Report…The Trend is Your Friend ’til the Very End

If you’ve been following me for any length of time you know I’ve been a major bull when it comes to the stock markets. The last two years were some of the best years to be a bull in one of the greatest bull markets of all time and I don’t say that lightly.

A little over a month ago we got our first correction of 12% in over two years on the SPX. Everyday the SPX would be up four or five points on the open, nothing major, and then  move slowly higher in a non threatening way which made it fairly easy to stay on trend. Impulse moves like that are the easiest part to trade as the corrections, when they came, were very small of only 3% to 5%.

That all changed a little over a month ago when it was time for the stock markets to correct that two year impulse leg up. When it’s time to correct the markets don’t need an excuse they just do it and it usually comes out of nowhere. The initial leg down is usually the hardest followed by counter trend moves that eventually build out some type of pattern.

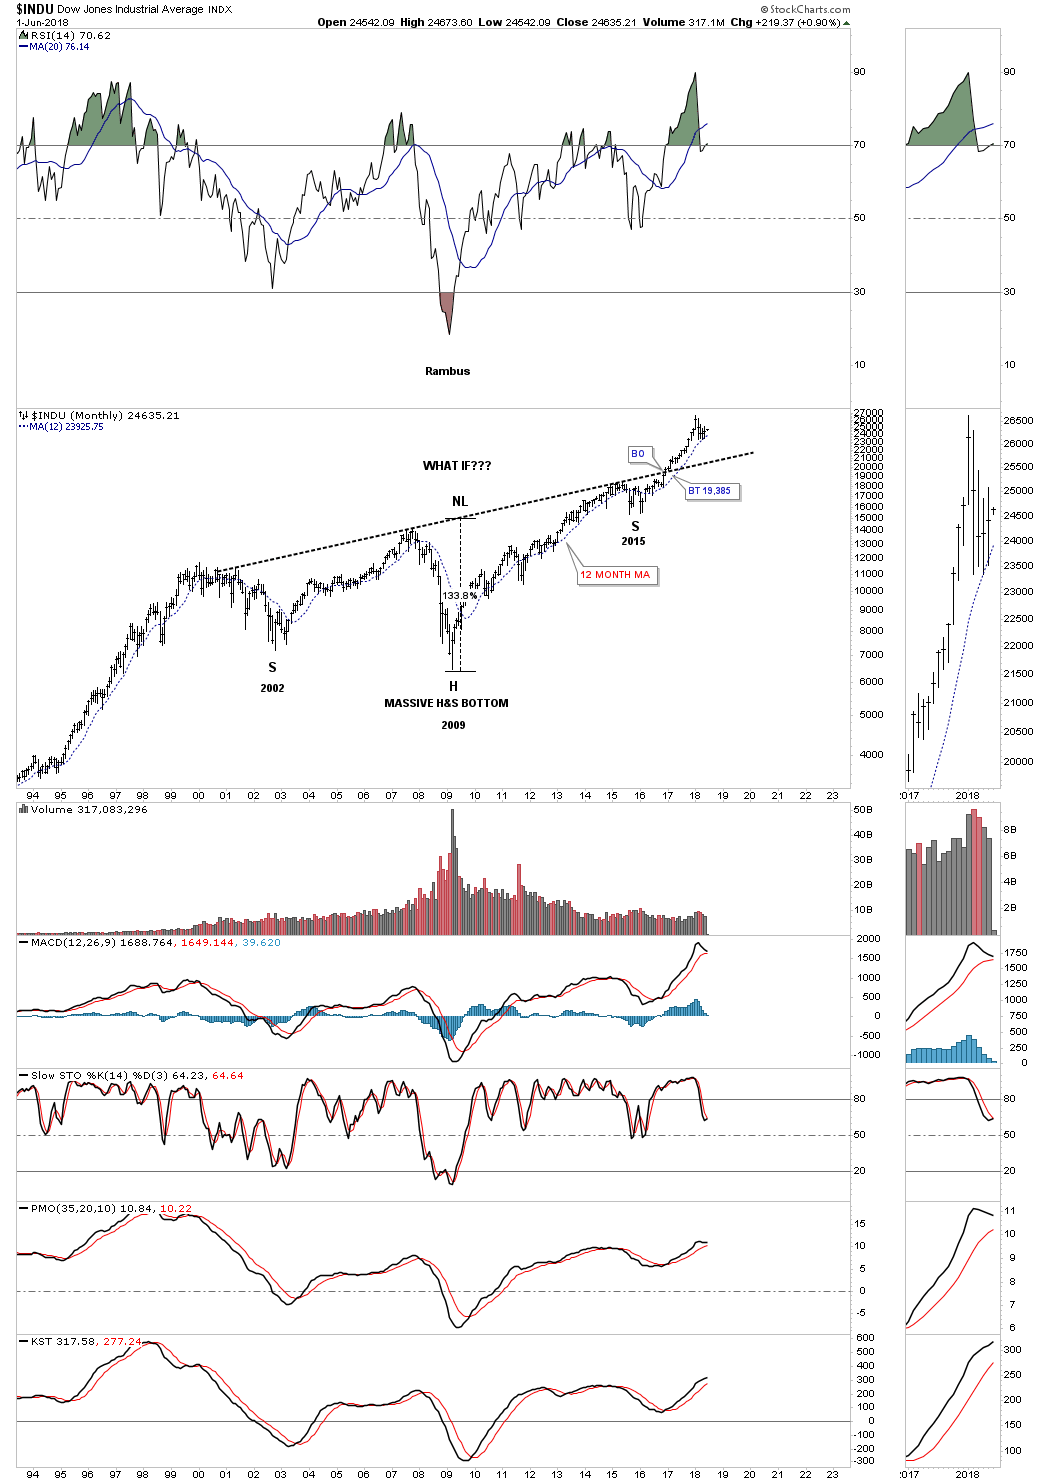
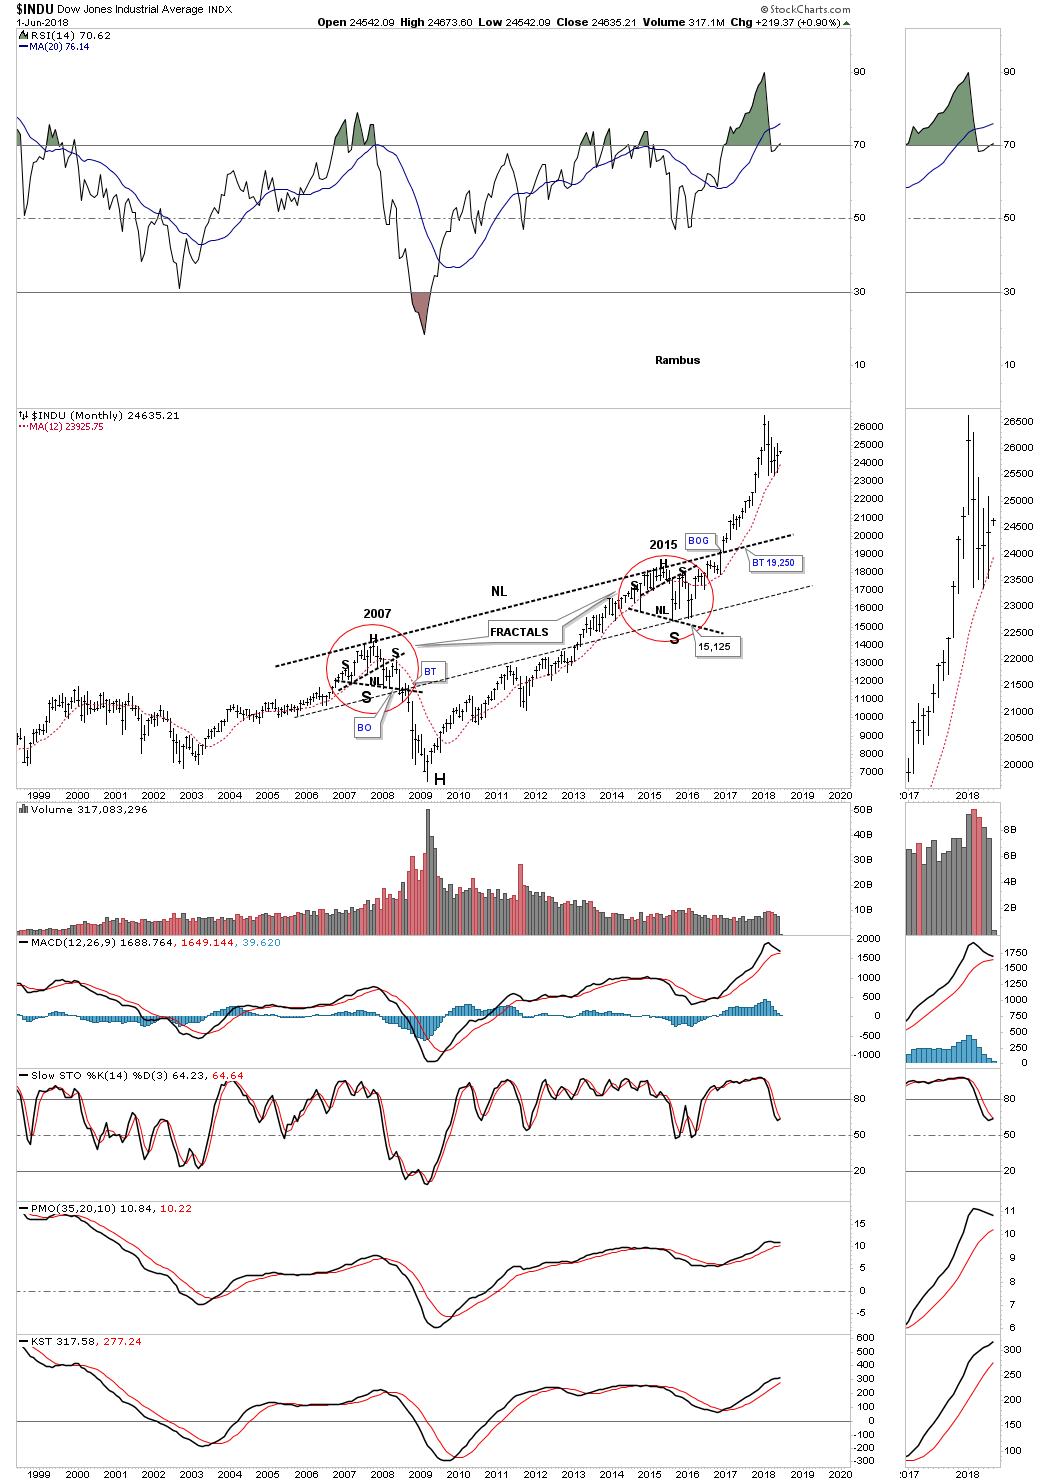
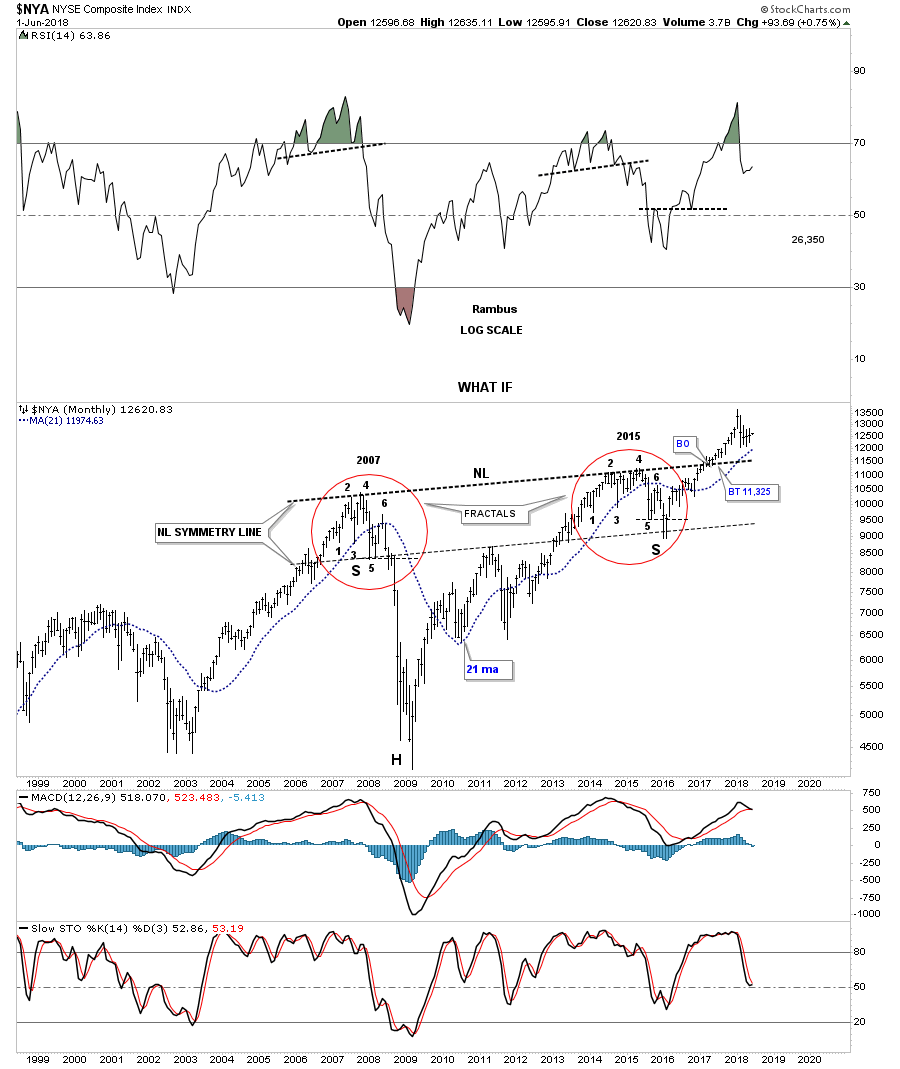
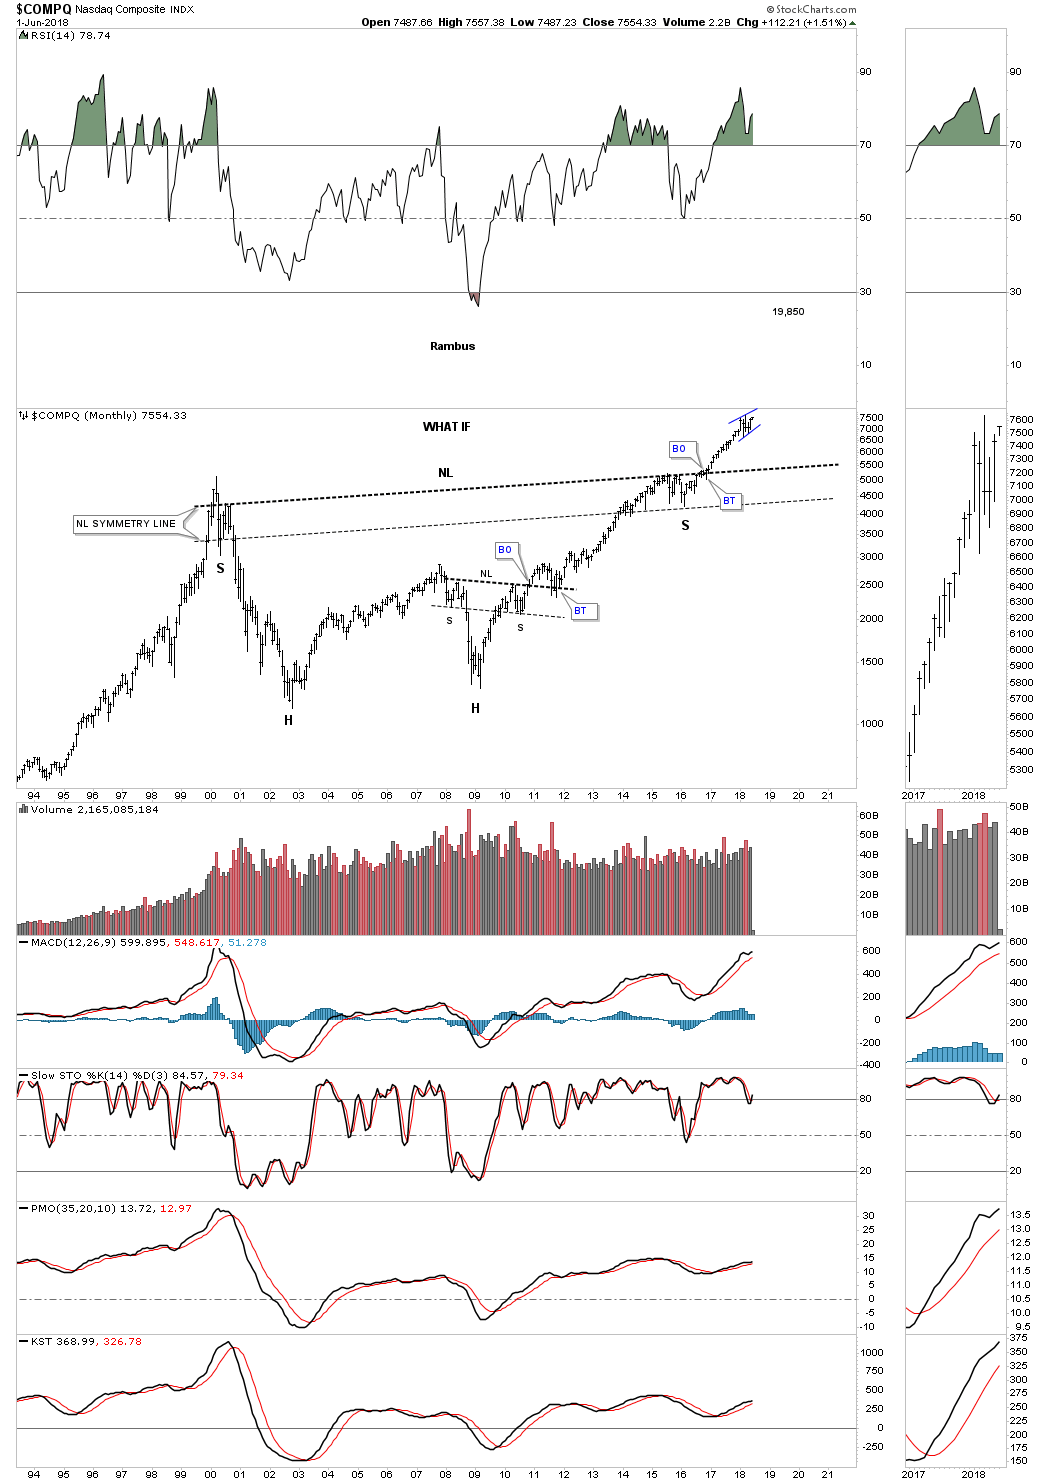
Tonight I would like to show you some of the long term charts which is the best proxy to define if the stock markets are in a bull or bear market. One of the most important decisions an investor can make is to determine if the market they choose to play is in a bull or bear market. Trading long in a bull market can be forgiving if your entry point is off. Eventually the price action will catch up to the bull and you’ll be forgiven for your bad entry point. On the other hand, if you go long in a bear market you’ll be constantly fighting the dominate downtrend like a salmon swimming upstream. It’s always much easier to go with the dominate trend, long during bull markets and short during bear markets. It sounds simple but I can assure you it is not.

For instance the bull market that started in the PM complex back in 2000 was a good example of trading inline with the uptrend. One could have done some shorting, but it would have been a much tougher game to play. After the bull market topped out in 2011 those folks that traded to go long the PM complex have been fighting a tough battle. There can be some small victories, but the big prize comes when you can get in sync with the major trend whether it’s up or down. As many are finding out major trends can last for many years and is unforgiving when you try to trade against it.

Below is a 20 year monthly chart for gold which shows you the beautiful bull market uptrend channel along with all the consolidation patterns. You can throw a dart anywhere within that uptrend channel for a place to buy. As you can see you will eventually be vindicated with your buy point. It might not be the best entry point, but you’ll eventually turn a profit.

Now throw a dart at the correction that began in 2011 to the present day which I’ve labeled as a six year expanding falling wedge. It should become very obvious to you how much harder it is to go long during a bear market vs a bull market. Even if you were good enough to pick the exact low and sell at the exact high you would have made a decent profit but nothing like an impulse move up during the bull market years.

Next I would like to show you some stocks that are in a long term bull market. Many of these charts I’v been posting for many years as there bull market has been unfolding before our very eyes. This first chart is the $BKX, banking index, which gave me a major heads up back in 2007 that something wasn’t right with this index. Fundamentals couldn’t have told you when the game was over, but the break below that massive S&R line did. Several years ago I extended that S&R line to the right hand side of the chart wondering if it was still hot. As the old saying goes, an important trendline never dies it just slowly fades away. Note how the price action built out that blue triangle just below the S&R line which told us it was still hot. We could see a backtest from the topside which wouldn’t affect the bullish potential for this index, above is bullish and below is bearish.

Below is the $BTK, biotechnology index, which has been tough to trade in the short term, but when one looks at this long term chart the price action is just off of its all time highs and looks like it wants to go higher. Again, throw a dart at the price action since the 2009 low to the present and you will have a profitable trade. On the other hand try shorting the 2009 bull market and see if you could have made any real money.

Next is a monthly chart for the $COMPQ. How much would you have gained if you had kept shorting this bull market that began in 2009. It can be done but the big profits go with the bull.

Is the $HGX, housing index, completing a breakout and backtest to the top rail of a five year bullish rising flag?

The $HSI, Hong Kong stock market, is breaking out from a 10 year triangle consolidation pattern.

Of all the US stock markets the $NDX 100 has some of nicest Chartology.

After breaking out from a 25 year bullish expanding falling wedge the $NIKK Japanese stock market, built out a H&S consolidation pattern. It’s currently in the process of backtesting the neckline.

After several years of breaking out and backtesting that massive neckline the $NWX, networking index, is finally beginning to move higher. The red arrows shows how this index may reverse symmetry to the upside vs how it came down.

We caught the biggest part of the last impulse move higher on EEM emerging markets etf, but when I sold out a month ago I’m looking for a place to get back in. Sometimes the markets don’t make it easy for you once you lose your position.

Below is another index the FXI China large cap etf, that I’m looking for a new entry point as it is just breaking out and backtesting the top rail of a 10 year triangle consolidation pattern.

I have many more stock I could show you that are strongly suggesting the bull market that began in 2009 is still very strong. What is so special about our current bull market is that it’s a world wide event that is taking most countries to a new standard of living especially the 3rd world countries. It’s a good thing to see struggling countries get a piece of the pie that we take for granted. We live in a global community now where everyone is tied together in one way or another. This boom will have its pit falls along the way, but I for one am glad to see the world participating in a new paradigm shift for the many. All the best…Rambus

RUT Update…

You may have noticed that the RUT 2000 small cap index has been fairly strong recently on a relative basis. This may be due to the fact that it has been in breakout and backtest mode for the last six months or so. Below is a long term weekly chart which shows the four year black expanding triangle consolidation pattern we’ve been following with the breakout and backtest taking place. The backtest to the top rail was a little hard, but it did hold support. You can also see the smaller blue flat bottom expanding triangle that formed just below the four year top rail.
This very long term monthly chart shows an even bigger consolidation pattern that goes all the way back to 2000, the 18 year bullish expanding rising wedge. The last time we looked at this chart I suggested one of the reasons the RUT had been weaker on a relative basis is because of all the overhead resistance it had to overcome to break free. The impulse move may be at hand.

The quarterly chart shows the 18 year bullish expanding rising wedge all by itself. It’s always nice to see the small caps do well durning a rally phase in the stock markets.