
This gallery contains 22 photos.
I’ve been a little under the weather this week so this Weekend Report will be a little on the short side. First lets recap where the HUI is now vs two years ago at the March 2020 crash low. In … Continue reading
This gallery contains 22 photos.
I’ve been a little under the weather this week so this Weekend Report will be a little on the short side. First lets recap where the HUI is now vs two years ago at the March 2020 crash low. In … Continue reading
This gallery contains 9 photos.
The clues are beginning to mount that the PM. complex may be in trouble. I don’t say this flippantly, but to just make you aware of what could happen as more clues become available. Today the small blue flags experienced … Continue reading
This gallery contains 5 photos.
Before we look at today’s charts I just want to make sure that everyone knows that the trades in the PM Stock Trade Portfolio are just 5% of $100,000 of the portfolio. If things work out we should have at … Continue reading
This gallery contains 26 photos.
One of the headlines this week was, the biggest rise in inflation since 1982. To put that into context we’ll need to look at some long term charts and what the Chartology looks like back then and today. Right now … Continue reading
This gallery contains 9 photos.
Lets start with the daily combo bar chart for the PM complex which shows the double H&S bottom failing today. With today’s failure it means I have to go back to the drawing board and see why this pattern has … Continue reading
This gallery contains 48 photos.
Last week marked one of the most important weeks in the PM complex in a very long time. After 15 months of consolidating the last impulse move up, that began at the August 2020 high, we are now seeing a … Continue reading
This gallery contains 2 photos.
This is what I wrote exactly one year ago today. I’m headed out to do my civic duty and vote. I have no idea how long it will take so I’m going to post this chart now. For those that … Continue reading
This gallery contains 11 photos.
Tonight I would like to update some long term charts for Gold to give you a feel for where Gold is at in its secular bull market that began at the 2000 double bottom low. I’ve said a million times … Continue reading
This gallery contains 13 photos.
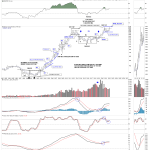
Lets start with the BPGDM, Gold miners bullish percent chart which has just made a lower low along with the GDX on top. If you recall I was looking for some kind of divergence between the 2 which hasn’t happened … Continue reading