Wednesday Report…Take The Bait or Should You Wait ?

In this Wednesday Report I’m going to show you a lot of charts of which some are positive and some negative. Today was a day where alot of investors felt compelled to buy strictly out of emotional reasons. Like a lure going by a big fat Largemouth Bass, the temptations was too great to resist. Maybe today marked the bottom for the PM complex or maybe not. Its still to early to say yet, with any amount of confidence, that the BOTTOM is in. Keep in mind that I want nothing more than for the precious metals stocks to rally big time and clear out some of the overhead resistance that was created on the last leg down. Its so much more fun when a true impulse leg up is in full gear to the upside and the PM stocks are making one new high after another. With that said lets start with some charts of the precious metals complex starting with a combo chart that shows the HUI, GOLD and SILVER.

The brown shaded area shows our current trading area that topped out in September of this year. If you look at the last bar on the far right hand side of the chart you can see today’s price action that shows the HUI, on top, being the strongest followed by silver, at the bottom of the chart, which had a good day and then gold in the middle that closed at the lower end of today’s bar. The first real positive development would be for the HUI and Silver to close above their bottom red trendlines.

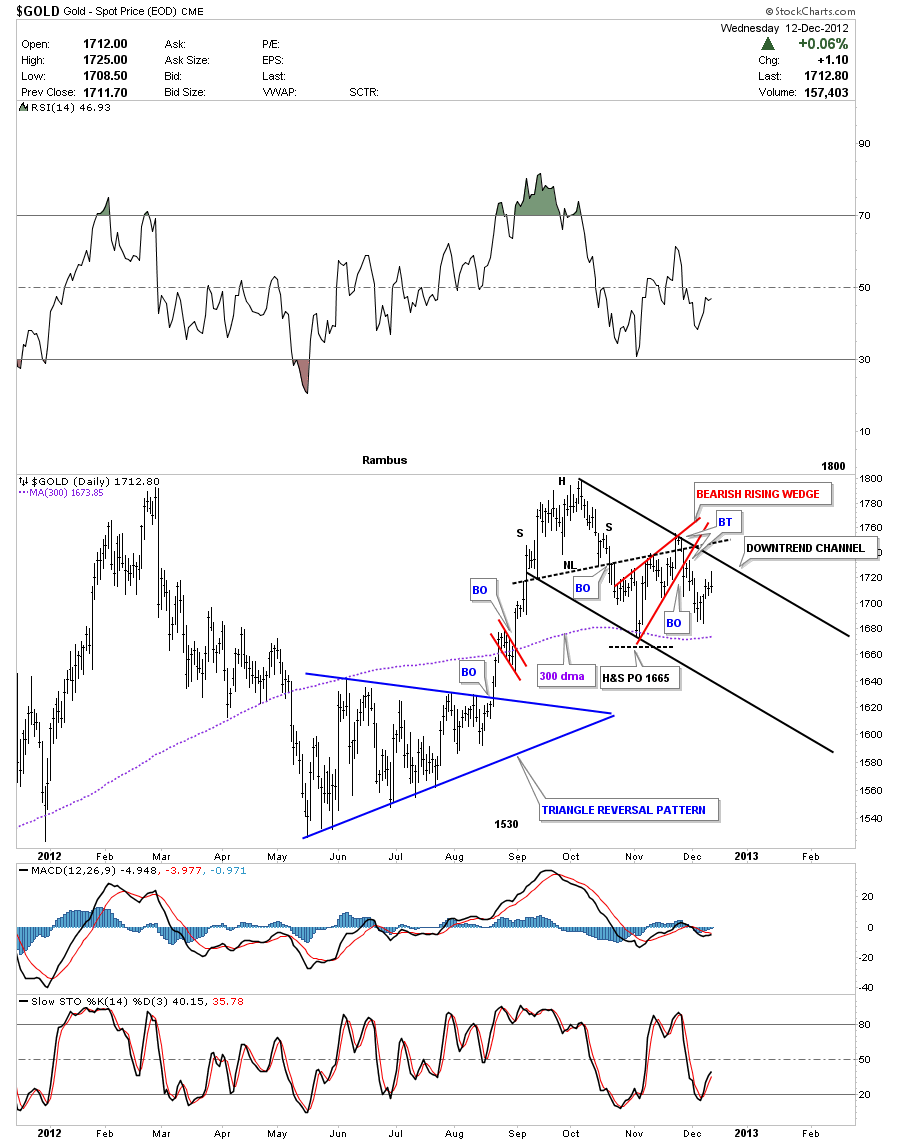
Next lets look at a daily chart of gold that shows the H&S top that was formed in September and October of this year. The H&S top fell about 5 points short of reaching it’s price objective at 1665 before it had a counter trend rally that took on the form of the red bearish rising wedge. You can see the backtest to the neckline was a tad strong  but it quickly reversed course and the bottom rail of the red bearish rising wedge was broken to the downside. On the third day of the breakout of the red bearish rising wedge it too had a backtest where the price action fell to our most recent bottom just above the 300 dma. You can see the 4 day counter trend rally that has been in place including today’s bar where the close was at the lower end of the bar. So what this chart is showing us is we have a H&S top reversal pattern with a bearish rising wedge trapped in the downtrend channel at this time which isn’t all that bullish.

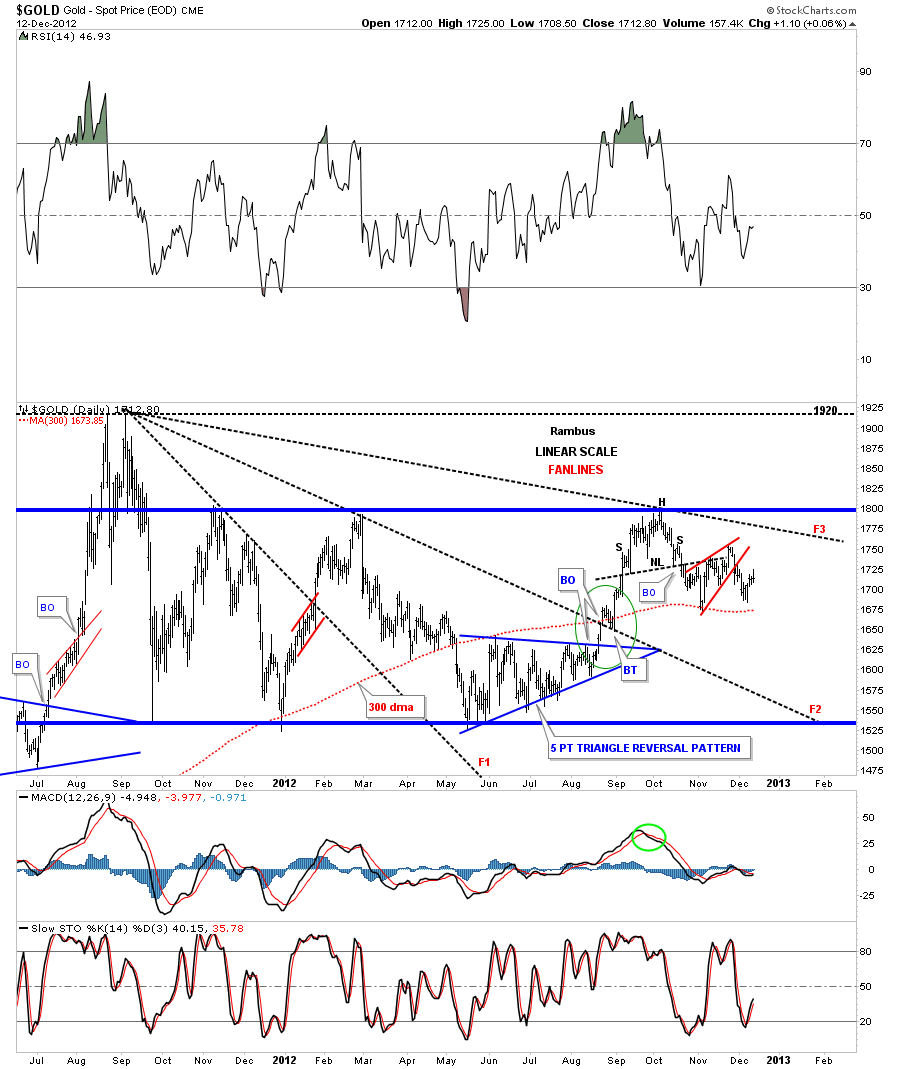
Lets step back and look at a 1 1/2 year chart that shows the big rectangle that started to form on the initial break off the all time high at 1920. This chart shows you why the H&S top, on the chart above, shows up where it does. It formed right at the top rail of the rectangle. Please observe how the price action, from the first low in the rectangle at 1530, is stretching out in time. You can see how the first decline was very dramatic taking just a few days to complete. The countertrend rally back up was also very fast, points #1 and #2. Notice how long the second leg down took, points #4 and #5. The last rally phase between points #5 and #6 took much longer to complete then the first two rallies which brings us up to our current decline. You can see the blue downtrend channel that has been forming since the H&S top at point #6. The swings are getting longer in time, both up and down, which cause alot more stress on investors who are use to the fast moves between the top and bottom rails of the rectangle earlier on. The price action is stretching out meaning the volatility is lessening which is what you want to see as a price pattern matures out. Like dropping a super ball on the floor, the first bounce is hard and fast and as it keeps bouncing up and down it starts to loose momentum. The formation of a consolidation pattern is the same principal.

The next chart shows the fanlines that are taken off the all time high at 1920. The rule is when fanline #3 is taken out to the upside the rally will begin in earnest after one possible backtest. Note the green circle in the center of the chart that shows how gold broke out of fanline #2 with a nice backtest before price went higher. Note the 300 dma that held support on the last low.

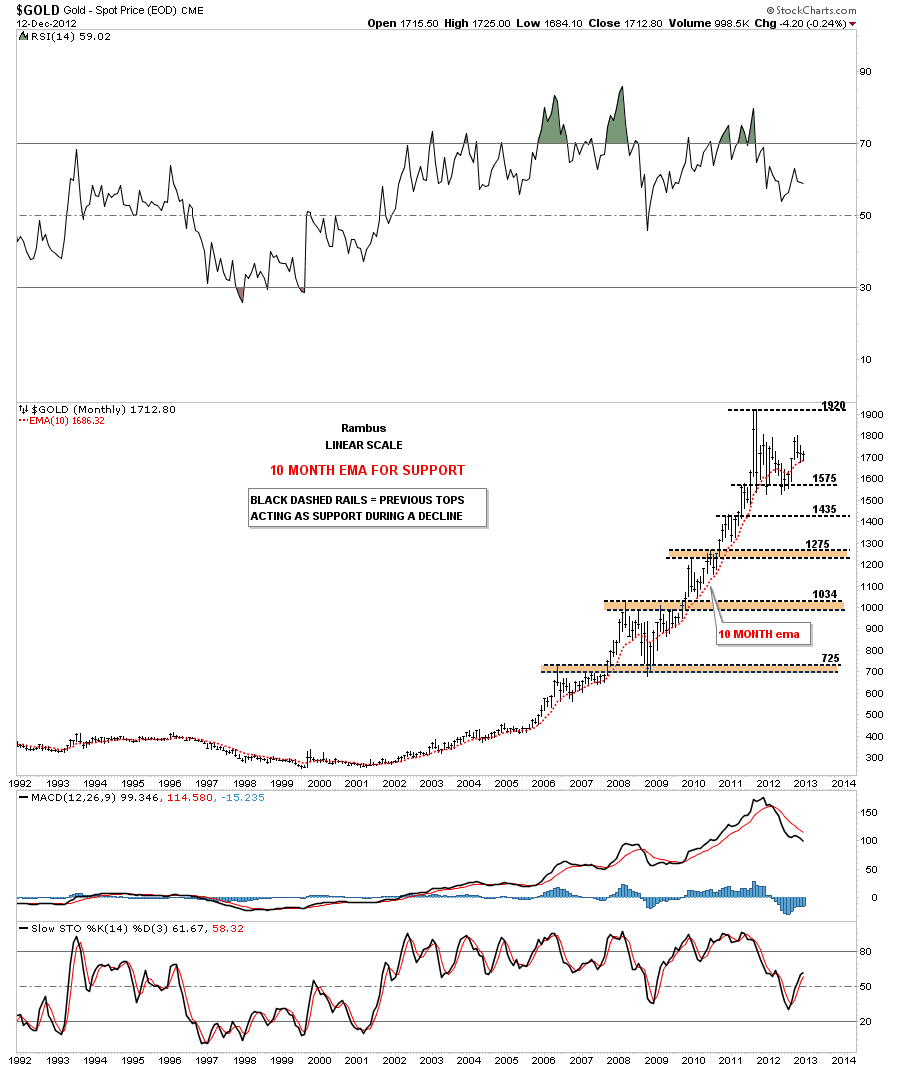
Lets now look at several longer term gold charts that are showing support is still holding. I like to use the 10 month moving average when looking at the monthly chart. You can see on the chart below the 10 month moving average came in at 1686 and the low so far for the month of December has been 1684. So far so good.

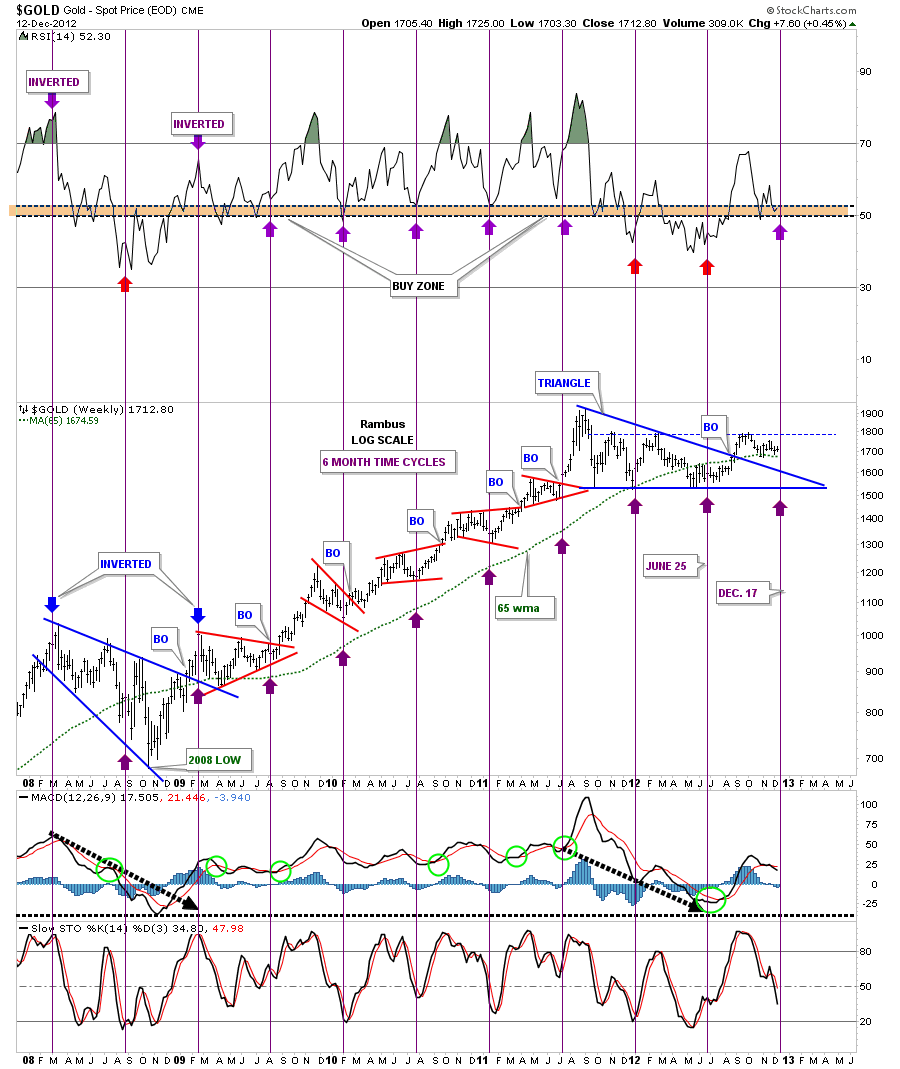
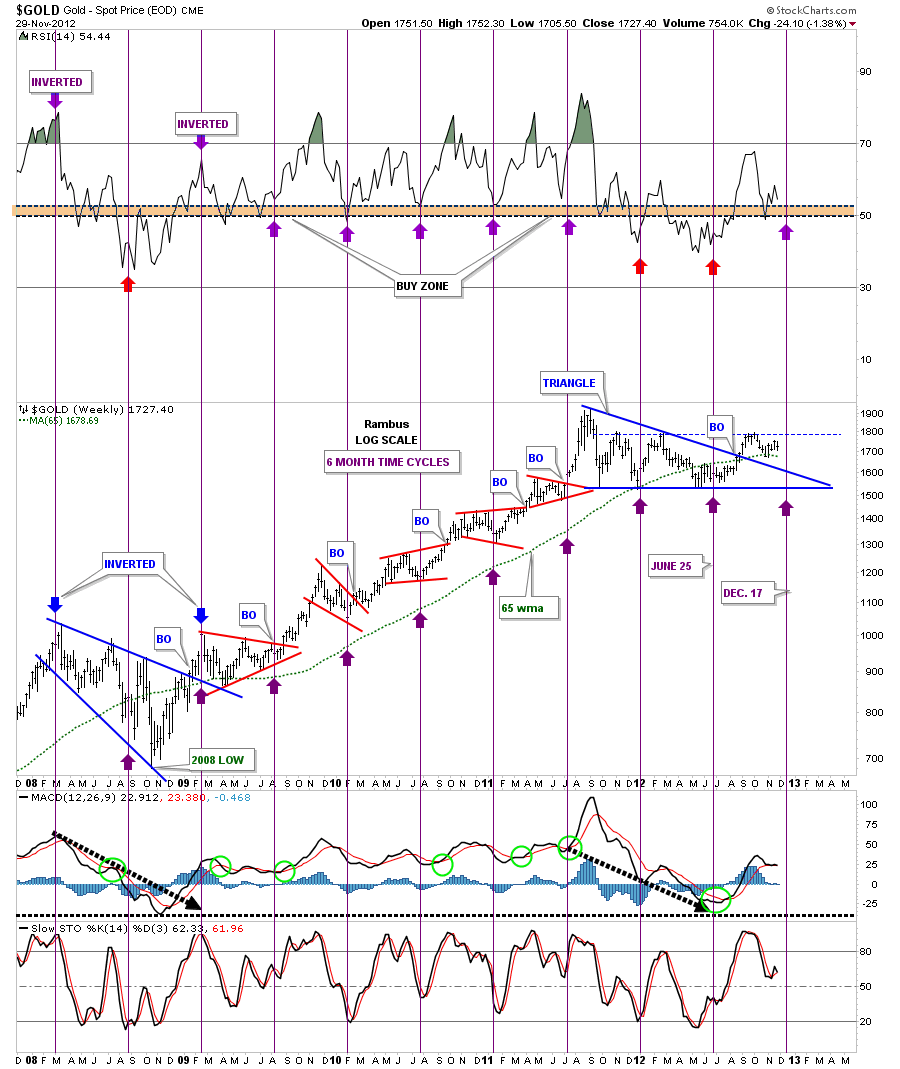
The next chart is a six month time cycle chart that has done a good job of calling the bottoms over the last several years. You can see its calling for a low around the 17th of December. You can also see the green 65 wma comes in at 1674 which has also done a good job of holding support. It has only failed when we get a big correction like 2008 and our current correction.

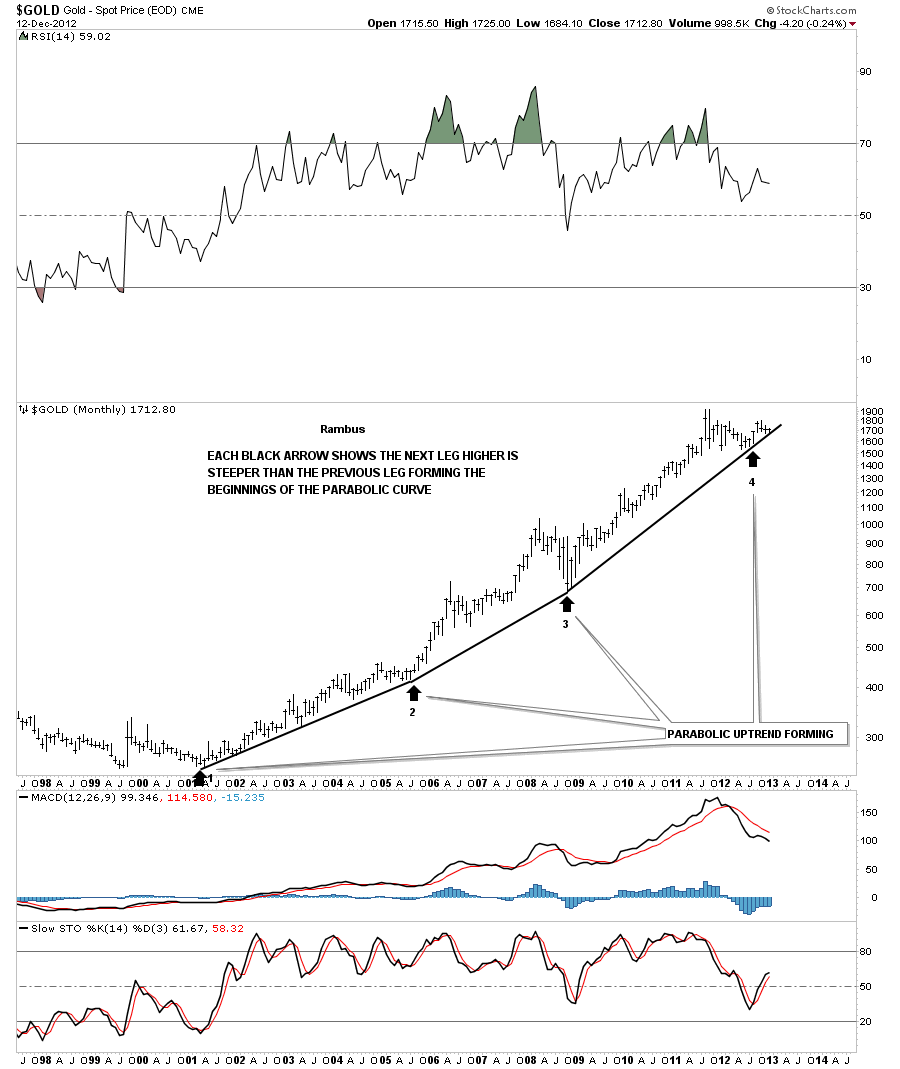
This next chart shows the price action still holding above the parabolic curve, ever so slightly. Critical test taking place right now.

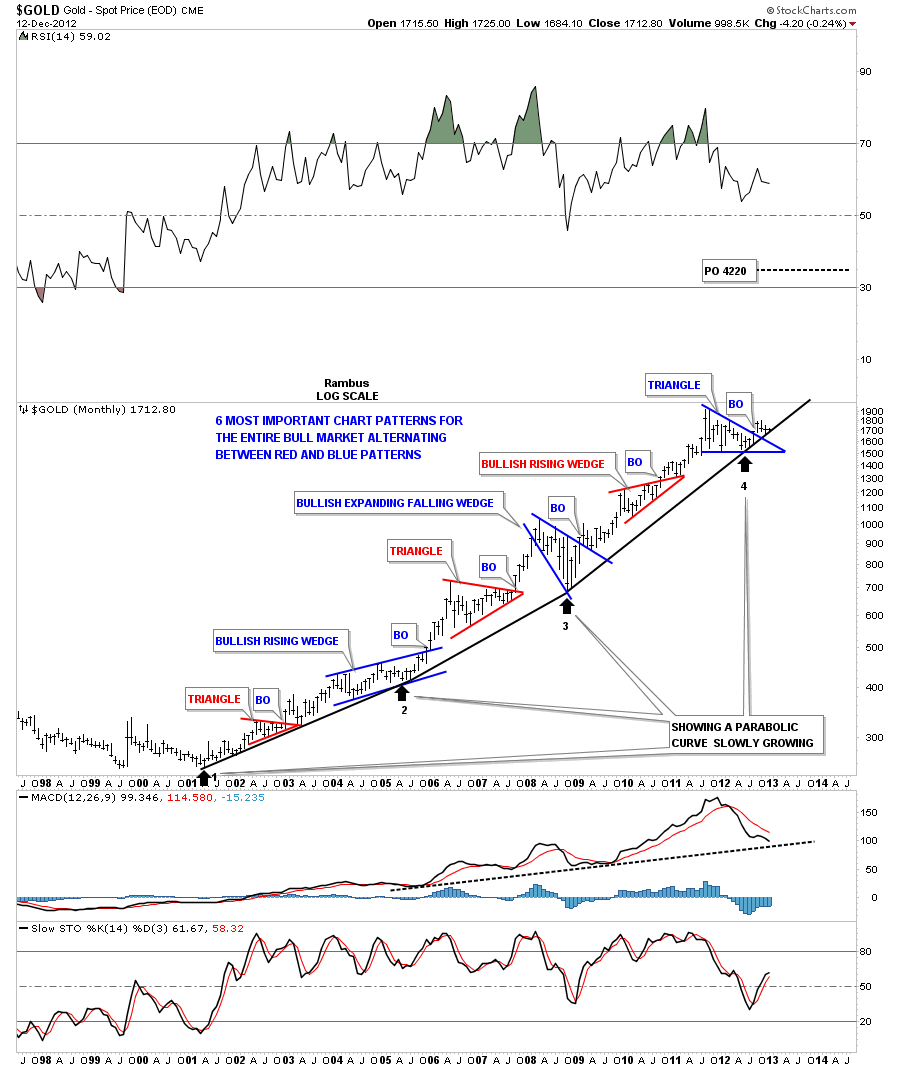
The next chart shows the important chart patterns that have formed during this bull market. You can see how critical this area is for the continuation of the parabolic move to continue.

This last chart I would like to show you has the 3 most important moving averages for gold during this bull market. The blue circle shows you how they are all converging within 10 points of each other. This is another critical test taking place right now.

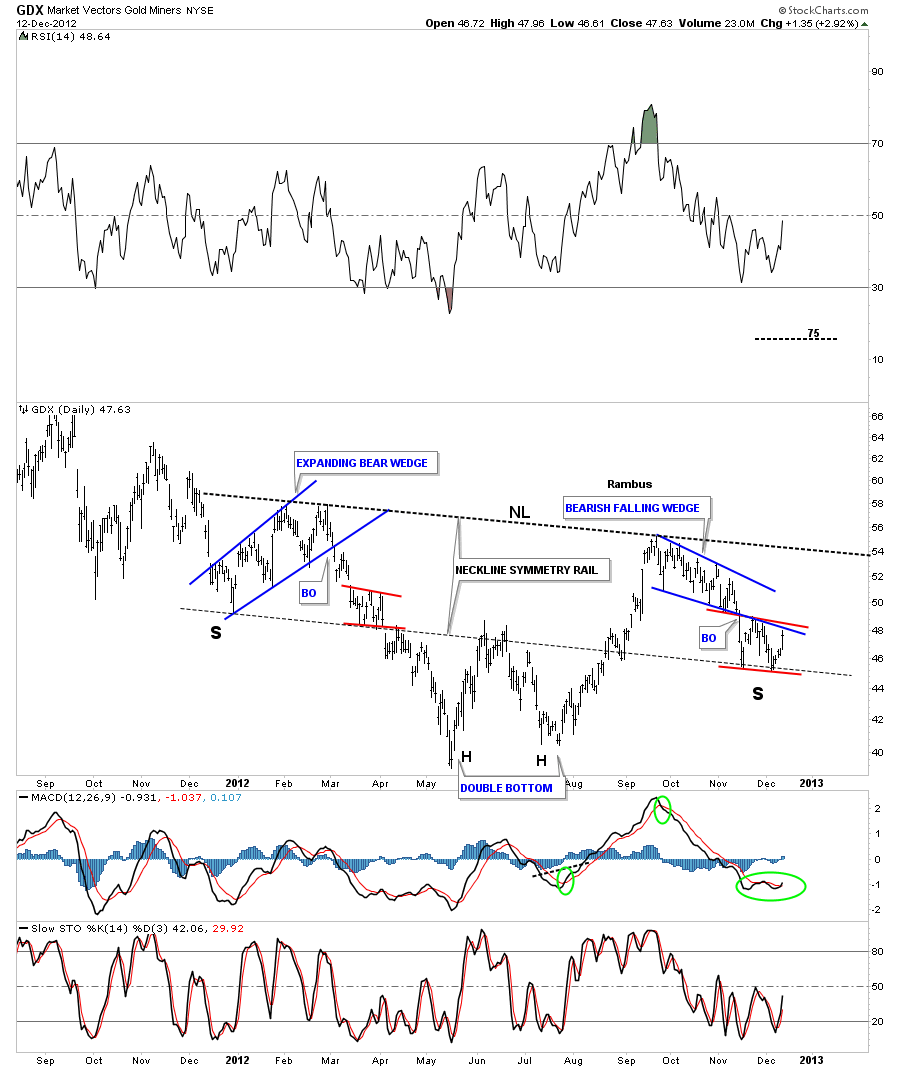
Lets now look at some charts of the precious metals stock indexes and see how they are shaping up. The first chart I would like to show you is the daily look at the GDX that is showing two possibilities right now. The first thing we have to look at and is most important is the 5 point blue bearish falling wedge that is a REVERSAL  pattern to the downside. That is the most important feature on the chart below at this time. Since its a reversal pattern we have to see some kind of reversal pattern form at the bottom to reverse our current downtrend back to up. As you can see with today’s price action GDX traded almost all the way back up to the bottom blue rail of the bearish falling wedge for the second backtest. This is where it gets real interesting. Note the two red trendlines. One that has formed on the neckline symmetry rail and the other has formed just below the bottom blue rail of the bearish falling wedge. What we have going on here is a possible red bearish falling flag or if the neckline symmetry rail can hold in here it could be a double bottom that is forming the low for the right shoulder. So choose your poison. One side is going to win out.

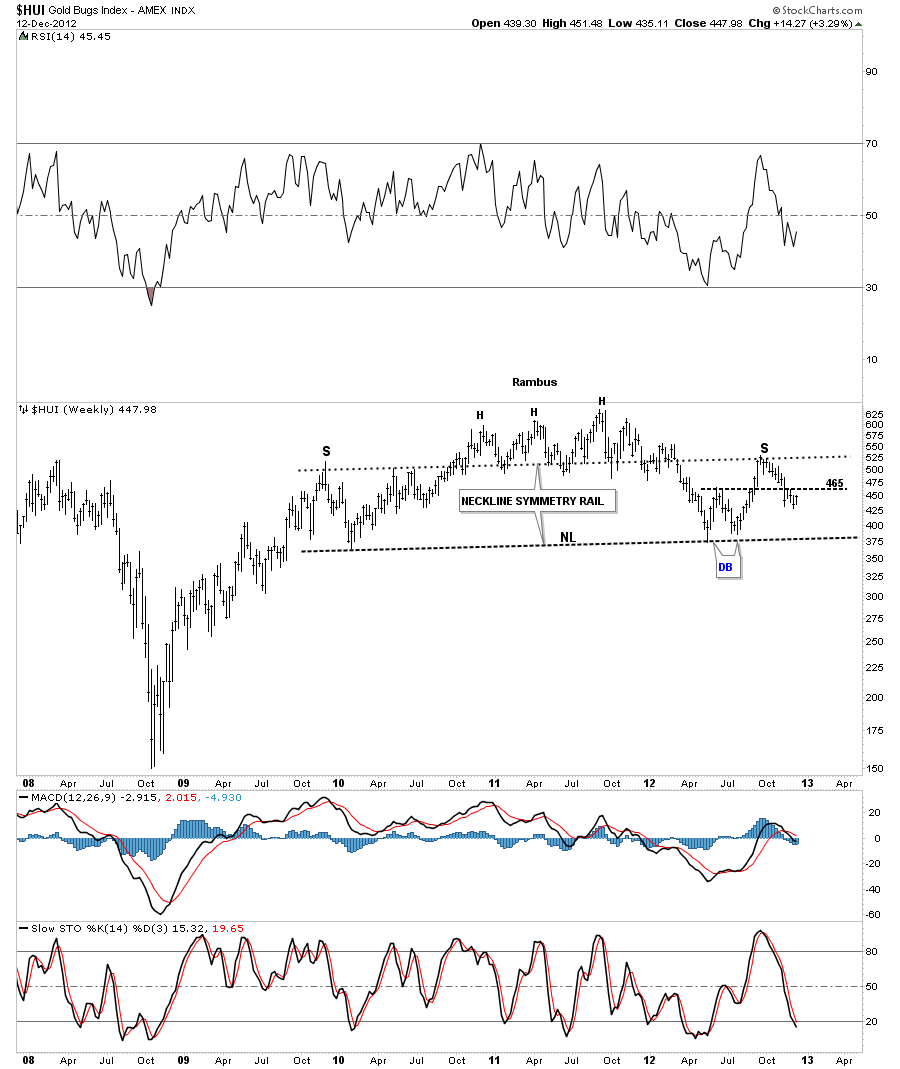
This next chart shows the HUI and the double bottom hump that comes in at 465, black dashed horizontal rail. That is the key area to focus on. Above positive and below negative.

This last chart shows you why the 465 is so critically important for the precious metals stocks. If the HUI can trade above that area it will negate the very bearish H&S top that has been forming for 3 years now. This is why the goldbugs are so frustrated now. We haven’t had a decent impulse leg up in a very long time.

I’m going to stop here so I can get this posted before it gets too late. I know many of you are probably frustrated with me right now because I didn’t jump on the bandwagon today. That’s OK as I need to see some more positive action before I commit to the model portfolio which is still in cash. Cash might seem like a good position down the road if things don’t turn around soon. The bottom line is today’s price action felt like the real thing to many gold bugs but as the charts show we aren’t quite out of the woods yet. How many times have we experienced days like today and then see everything fall apart a few days latter. If today was just a short covering rally then there will be more pain for those that jumped the gun today IMHO. Patience is a hard thing to learn and today was a good example of how easy it is to just throw caution to the wind and jump in with both feet. Maybe today was the bottom or maybe it was just a stopping off point for further downside action. We’ll know shortly I believe. Stay strong. All the best…Rambus

SLV Update…12-12-12

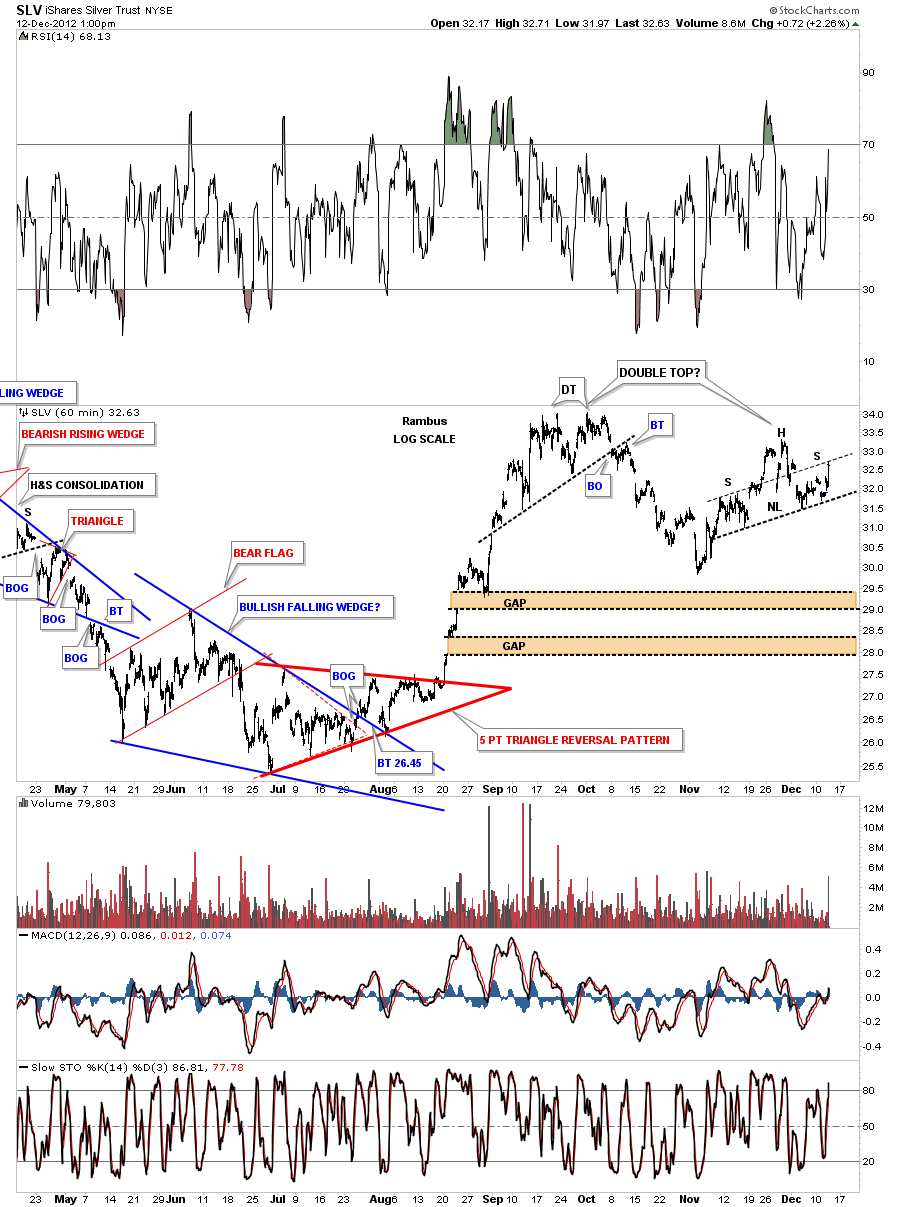
I’ve been watching the 60 minute chart for SLV that is at a critical area right here. SLV just hit the neckline symmetry rail for a possible right shoulder of H&S top pattern that could be part of a bigger unbalanced double top.

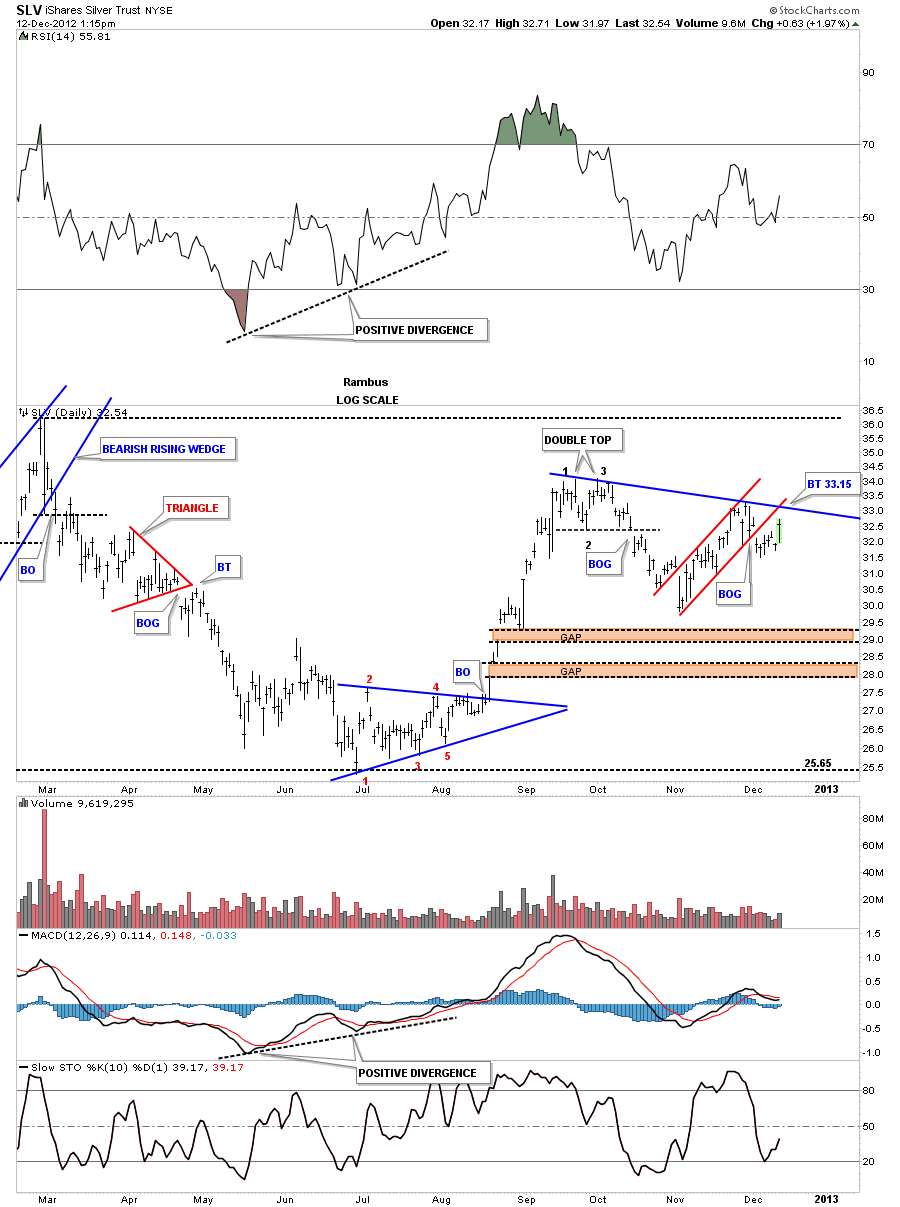
This next chart shows the small double top that was made back in September and the red uptrend channel that broke out to the downside 8 days ago. I’ve connected both tops with a blue downtrend rail that intersects around the 33.15 area. If SLV can trade above that area that would be a bullish sign as it would be making a higher high. There are still two unfilled gaps down at the 28 and 29 area that still may get filled at some point in time.

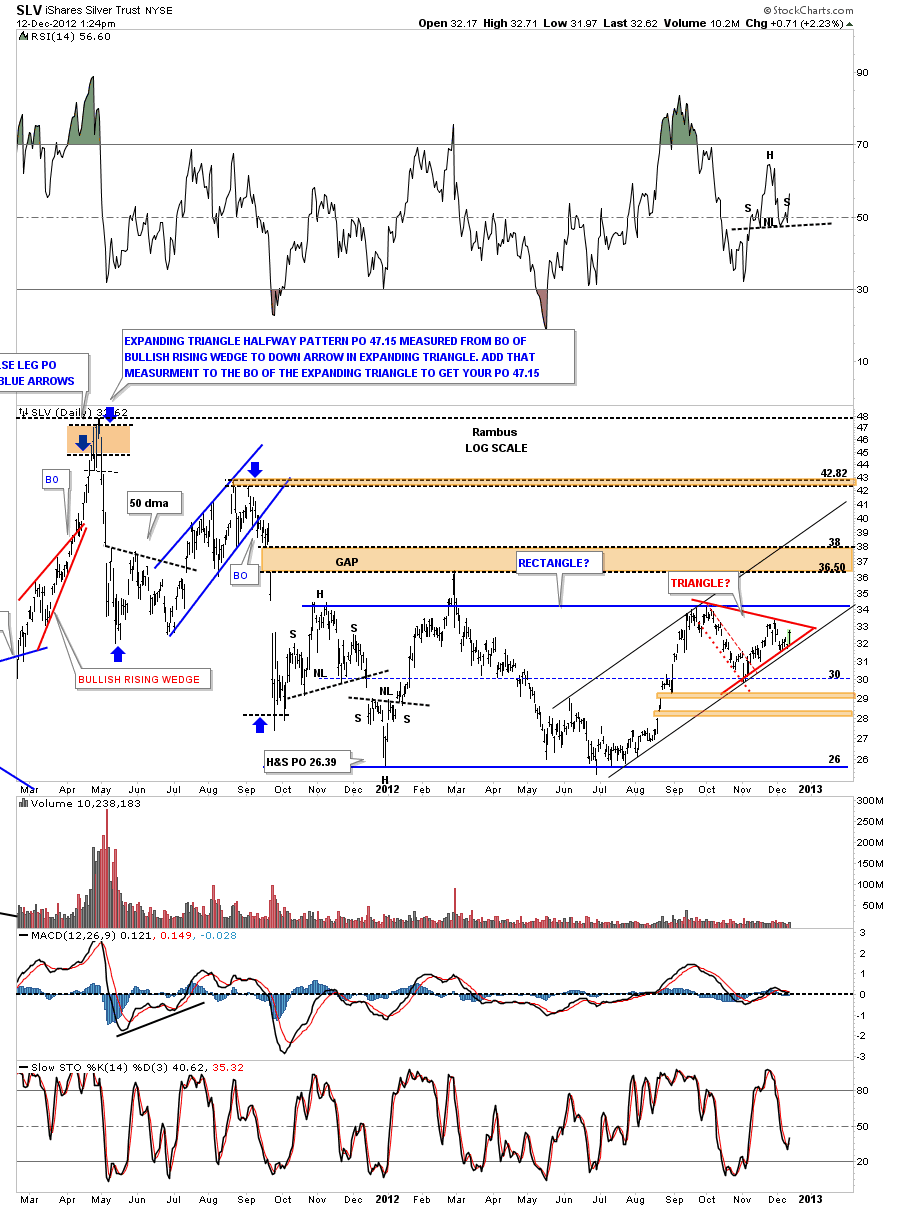
This next chart shows what everybody is watching right now. Its the uptrend channel with the possible red triangle forming. The top of the red triangle comes in at 33.15. The question is will it be a 4 point consolidation pattern to the upside or will the price reverse at 33.15 for a 5th reversal point making the red triangle a reversal pattern?

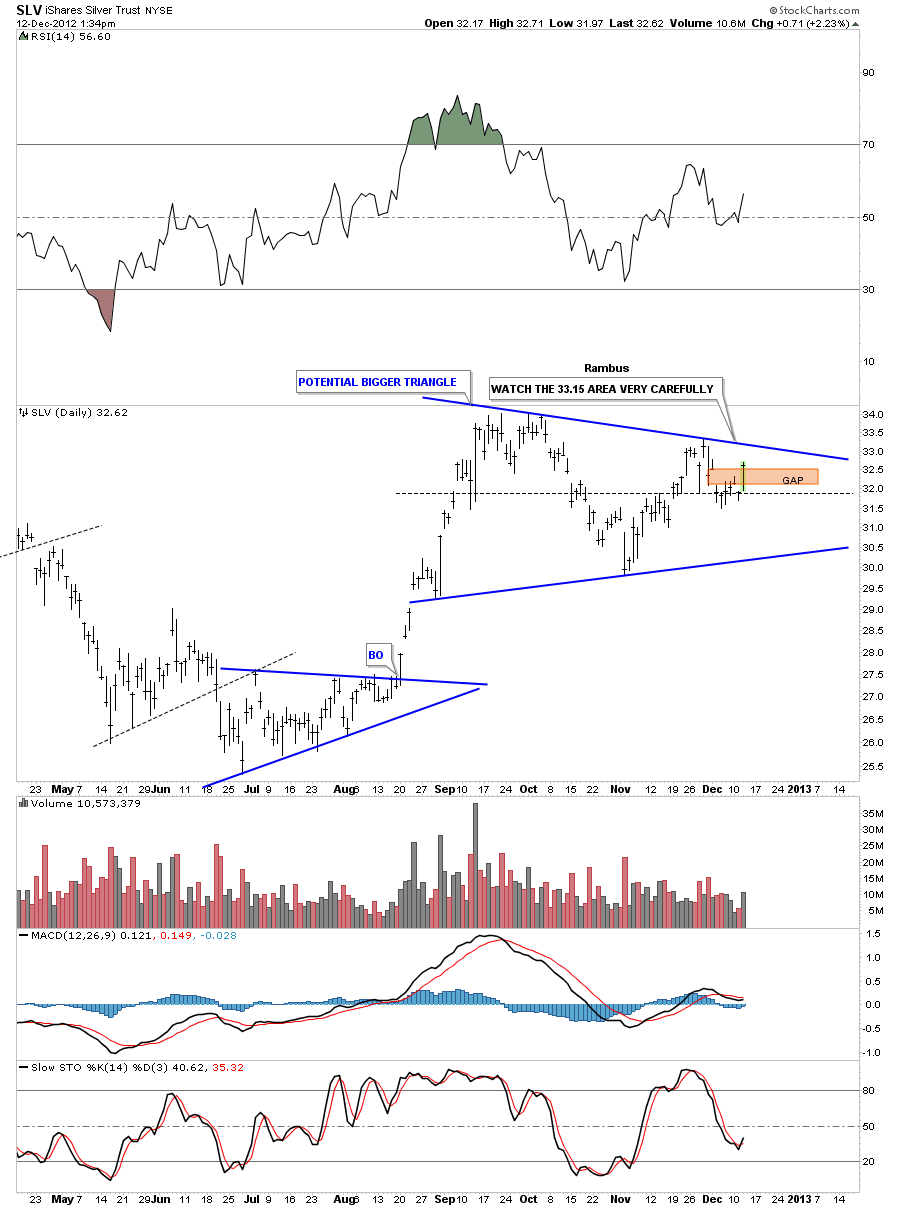
Below is another possible triangle that could be forming that is much bigger than the one above. Its alittle more symmetrical in appearance. Again, the 33.15 area is a critical place to watch on the top blue rail.

Apple Computer…

The reason I’m showing you this stock is because it has the highest market cap of any stock in the world I believe. Not to long ago I read something to the affect that it could be the first stock to have a trillion dollar market cap. It remained me of the late 90’s when I read that. Tech stocks were going ballistic to the upside even stocks that had no earnings to speak of.

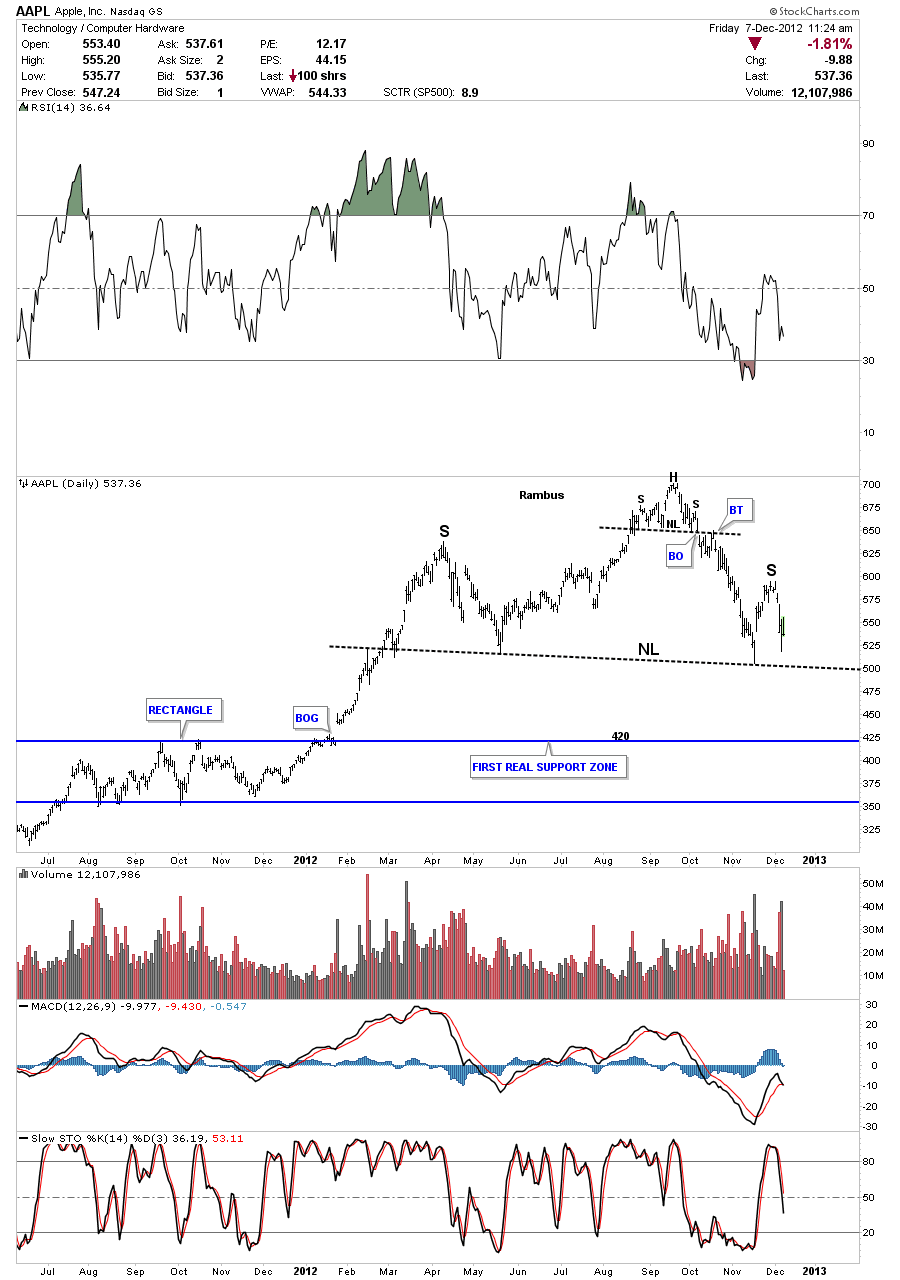
Below is a daily chart of Apple Computer that I haven’t shown in awhile. This stock shows up in alot of the stock market indexes and plays a big roll in how they move both up and down. Notice the head portion of the bigger H&S top formation. That is a small H&S top that reversed the parabolic run. It doesn’t look like much but it was significant in turning Apple around from up to down. Many times you will see a small H&S top that is just part of a bigger H&S pattern further down the road.

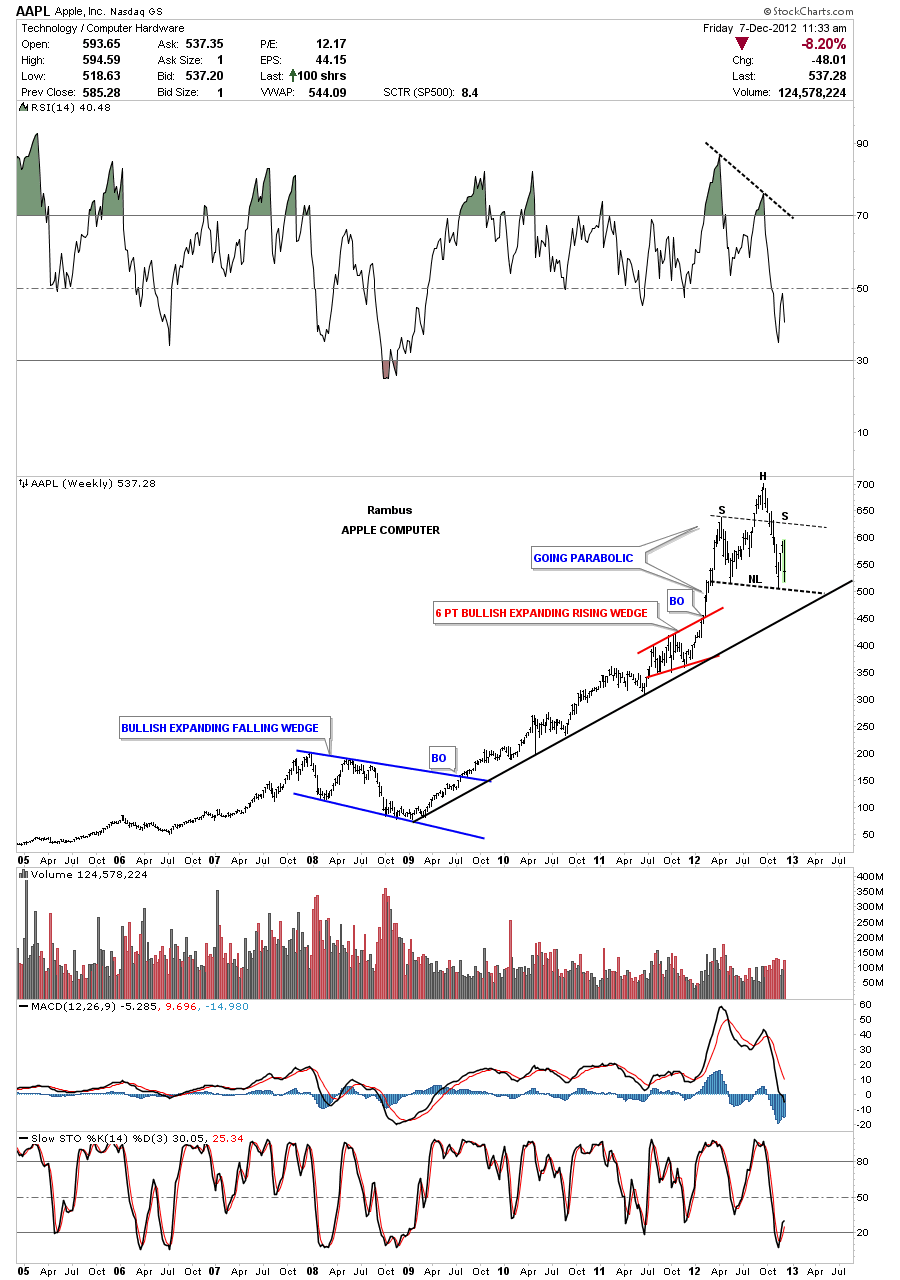
The weekly look really puts the H&S top into perspective. Note the black uptrend rail off the 2009 bottom and how the price went parabolic starting at  the end of 2011. The price basically doubled in 6 to 8 months which is an unsustainable run. What makes this H&S top pattern a little more ominous looking is that the right shoulder couldn’t make it up to the neckline symmetry rail and fell way short. If one of the best companies in the world is topping out what does that say about the rest of the stocks going forward? It maybe suggesting that this cyclical bull market, that has been in progress since the 2009 crash bottom, maybe coming to an end and the secular bear market might be getting underway again. One stock does not make a market but one of the best companies in the world, showing a topping pattern, could be a strong signal to protect your 401 K if its possible.

Weekend Report…Precious Metals Stocks Conundrum

There are times in the markets when things don’t seem to make sense which is most of the time for some investors. Then there are times when everything seems to line up and things go according to a plan. Right now the precious metals stocks are back to playing their old games again by not following the metals higher.

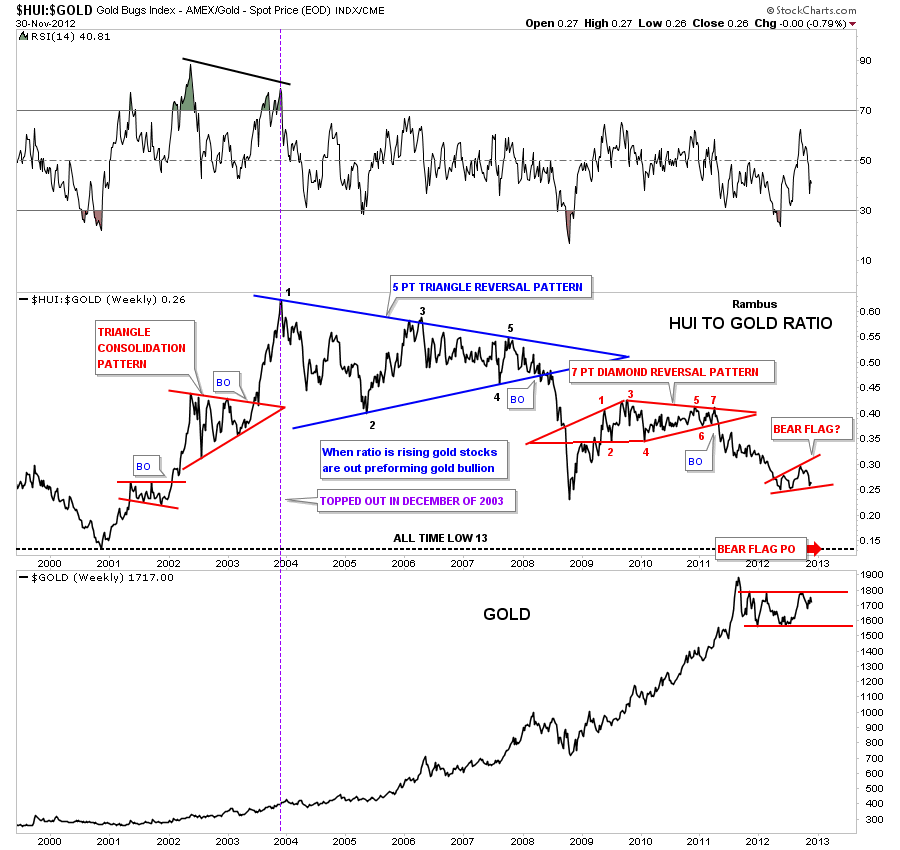
If you recall when gold hit it’s all time high in September of 2011 the precious metals stocks had a fairly decent move, if you can call it that, but woefully under performed the metal. I remember how hard it was to sit by and watch gold going to new highs on a regular basis and the gold stocks hardly moving. The HUI to gold chart below clearly shows that happening.

Before we look at the HUI : gold ratio chart below I want to explain how a ratio chart actually works. For instance, both the HUI and gold can rally together but if gold is rallying faster than the HUI the ratio will fall even tho they are both in rally mode. The other case is both the HUI and gold decline together but the HUI is falling faster than gold the ratio will fall.

What the HUI : gold ratio shows is that during the first three years of this bull market the HUI outperformed gold in a massive way. The ratio topped out in December of 2003 and has been going down ever since. One last note on the HUI to gold ratio chart below. There is a small red expanding bear flag that hasn’t broken out yet to the downside but if it does, the price objective is going to be all the way down to the 2000 all time low at 13. Gold has rallied over 1600 points from it’s low in 2000 yet the HUI is on track to hit its all time low for this ratio at 13. If this isn’t a conundrum I don’t know what is.
Lets see how the HUI has done compared to silver. As you can see on the chart below the HUI to silver ratio also topped out in December of 2003. You can see on the HUI to silver ratio chart there is a small H&S consolidation pattern that is forming just below the support and resistance rail and is beginning to breakdown. It looks like this ratio is on it’s way down to it’s all time low made in 2000 at 7.50.
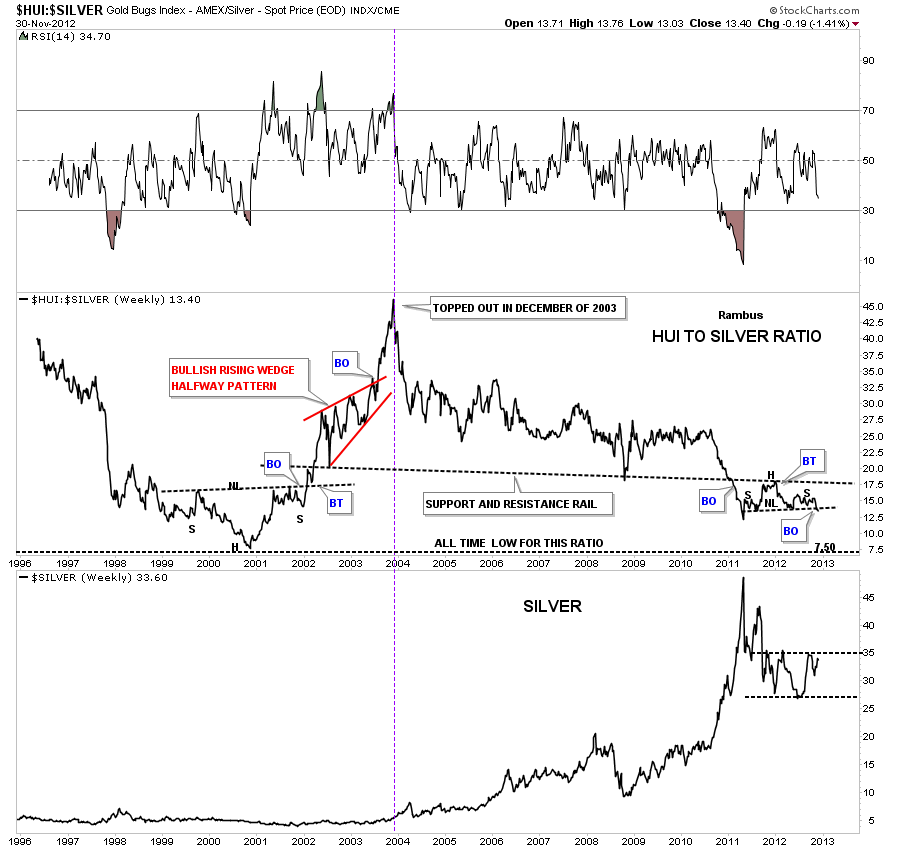
All three, gold, silver and the HUI have all rallied since the December 2000 oversold ratio bottom but the HUI stocks are now almost just as undervalued now as they were at the start of the secular bull market when the HUI was trading around 35 and gold around 255. Pretty amazing. Maybe when the ratio’s get down to their all time lows it might be a good time to jump on board the HUI stocks again. You would definitely be buying at the bottom that saw a 20 year bear market for the HUI to gold ratio.

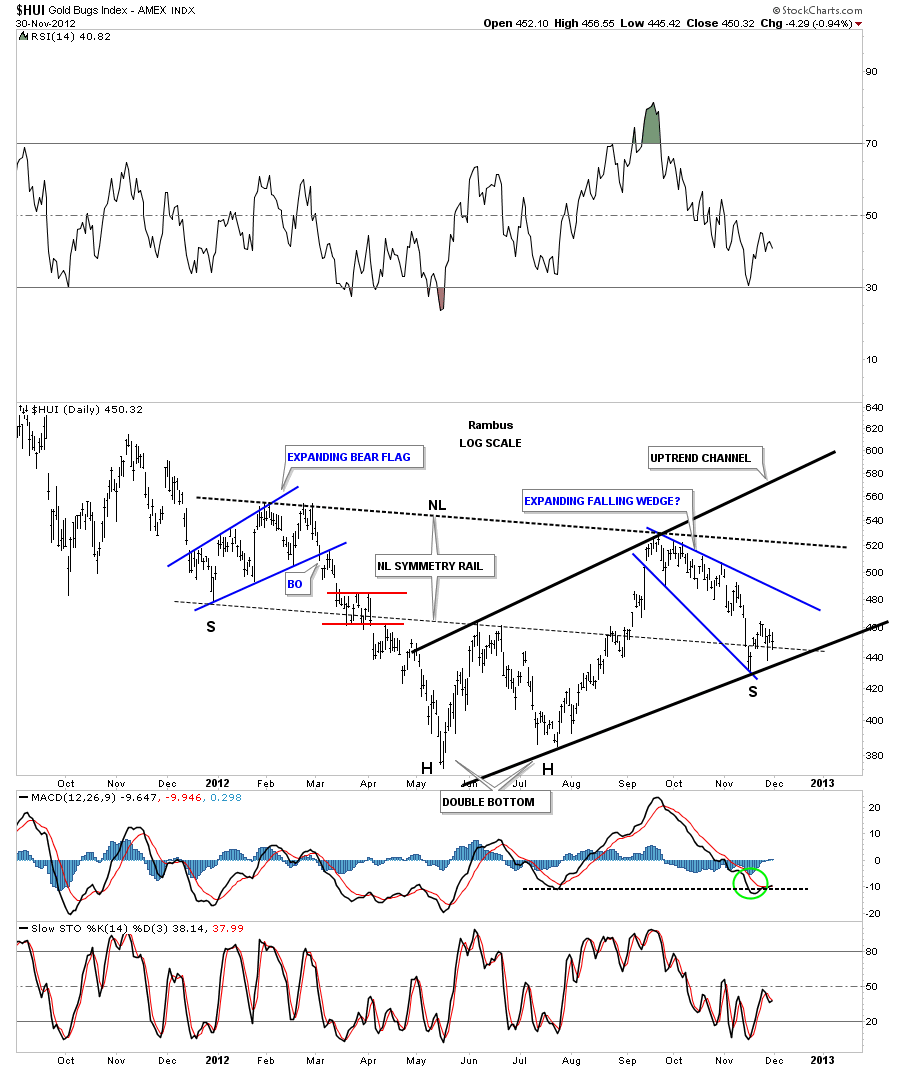
Now First lets take a look at the positive side for the HUI that is showing several potential bullish patterns. First, the inverse H&S bottom where the price action is testing the neckline symmetry rail which would be the bottom of the right shoulder. If the HUI can rally away from this point that would be very bullish. So far the this low has held for two weeks now. Its trying to make up it’s mind if it wants to go higher or lower. We should know the answer fairly soon.
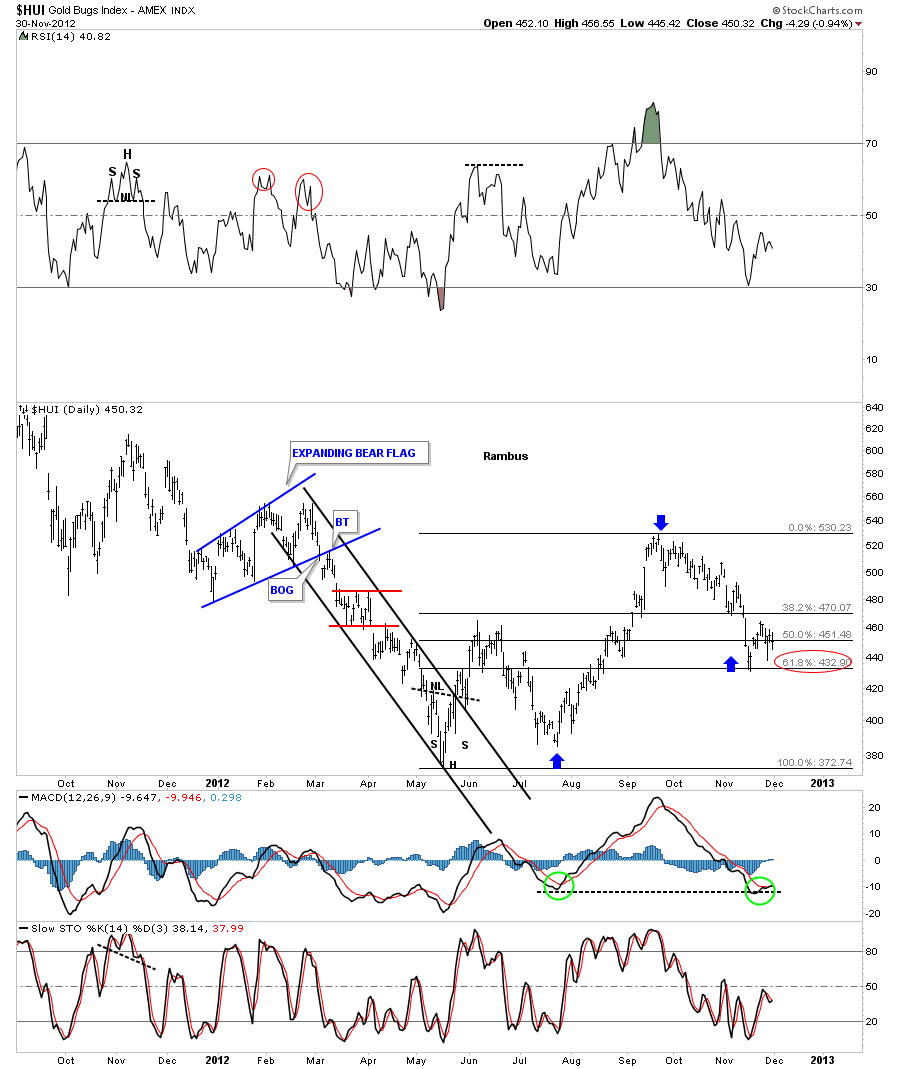
Next lets look at the Fibonacci retracement level which is still holding at 62% which falls in line with a normal correction.
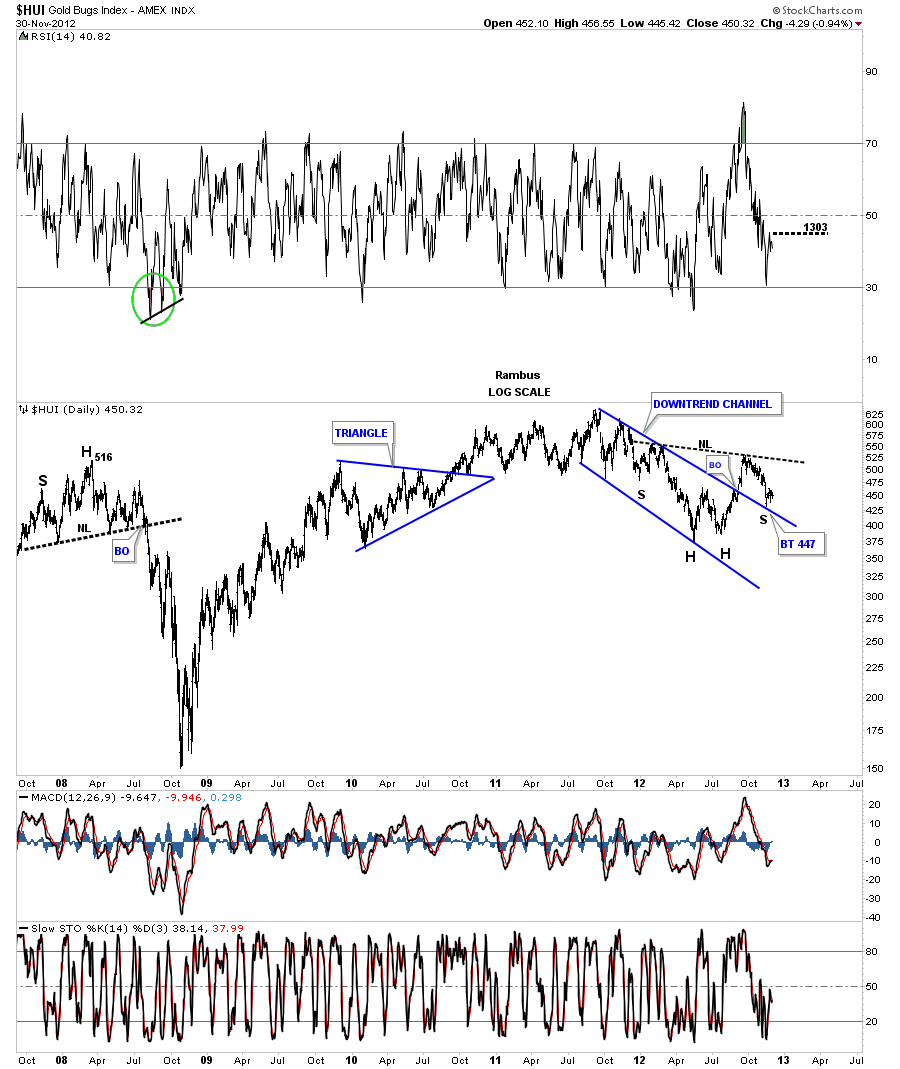
This last positive chart for the HUI shows it breaking above the downtrend channel with the backtest showing the possible right shoulder of it’s inverse H&S bottom. So far there in nothing not to like about these charts. They are all technically positive.
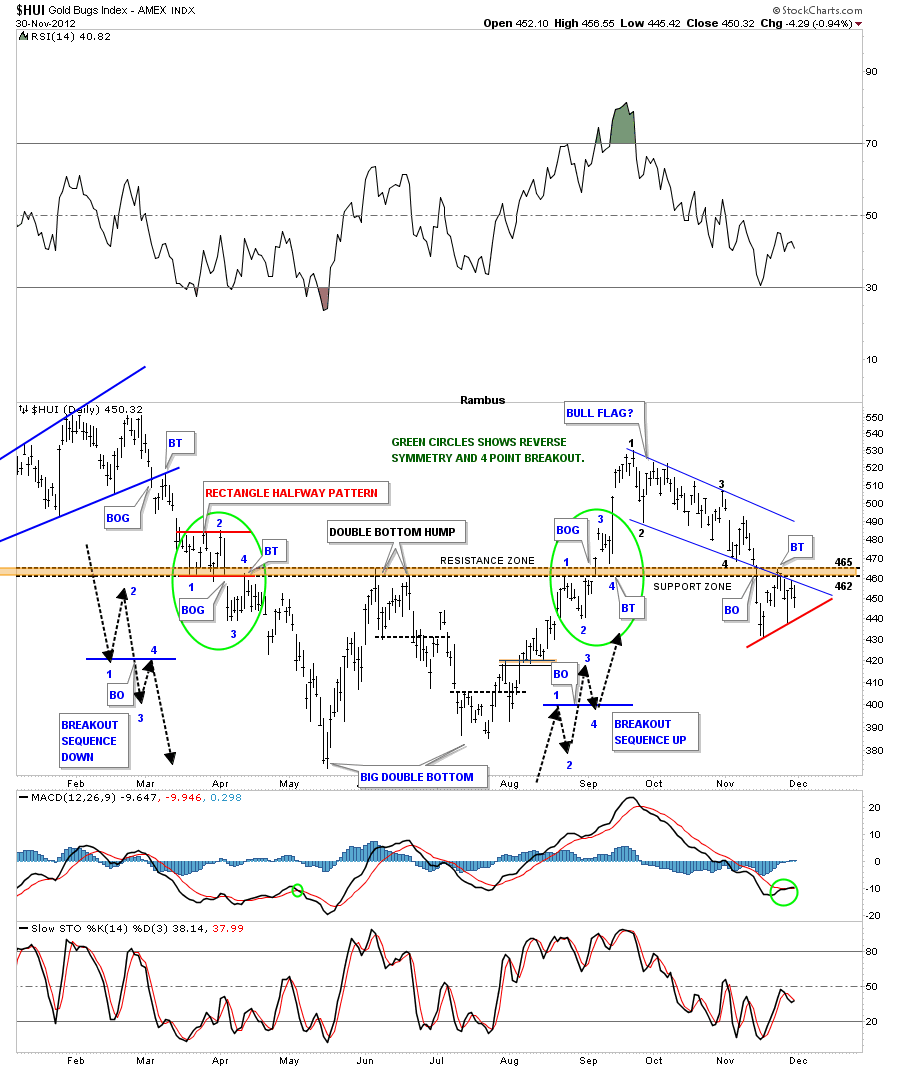
Now I want to show you some charts of the HUI that are throwing up a caution flag. The first chart shows the beautiful symmetry the HUI was producing when it broke out from it’s double bottom. It was picture perfect in every regard as the green circles show. Next I want to focus your attention to the blue downtrend that I have labeled BULL FLAG? Follow the price action starting at point #1 down to point #4. At point #4 is where support should have came in and launched the second impulse leg higher. You can see there was actually a four day rally that quickly faded away before the price action could reach the top blue rail. That hard decline below the brown shaded support and resistance zone should have held support but the price action sliced through it like a hot knife through butter. Next you can see the little counter trend rally that lasted about 5 days that took the price back up to the underside of the brown shaded support and resistance zone where the bottom blue rail of the downtrend intersect. It appears the brown support and resistance zone maybe reversing it’s role again and is now acting as resistance. You can also see a potential small triangle that is forming just below the brown S&R zone. The top of the little triangle is the bottom blue rail of the downtrend channel and I have put on a red trendline that shows the bottom of the triangle. That setup, when it happens above a support and resistance zone is bullish and when it happens below its usually bearish. It still needs to breakout before we can say game over.
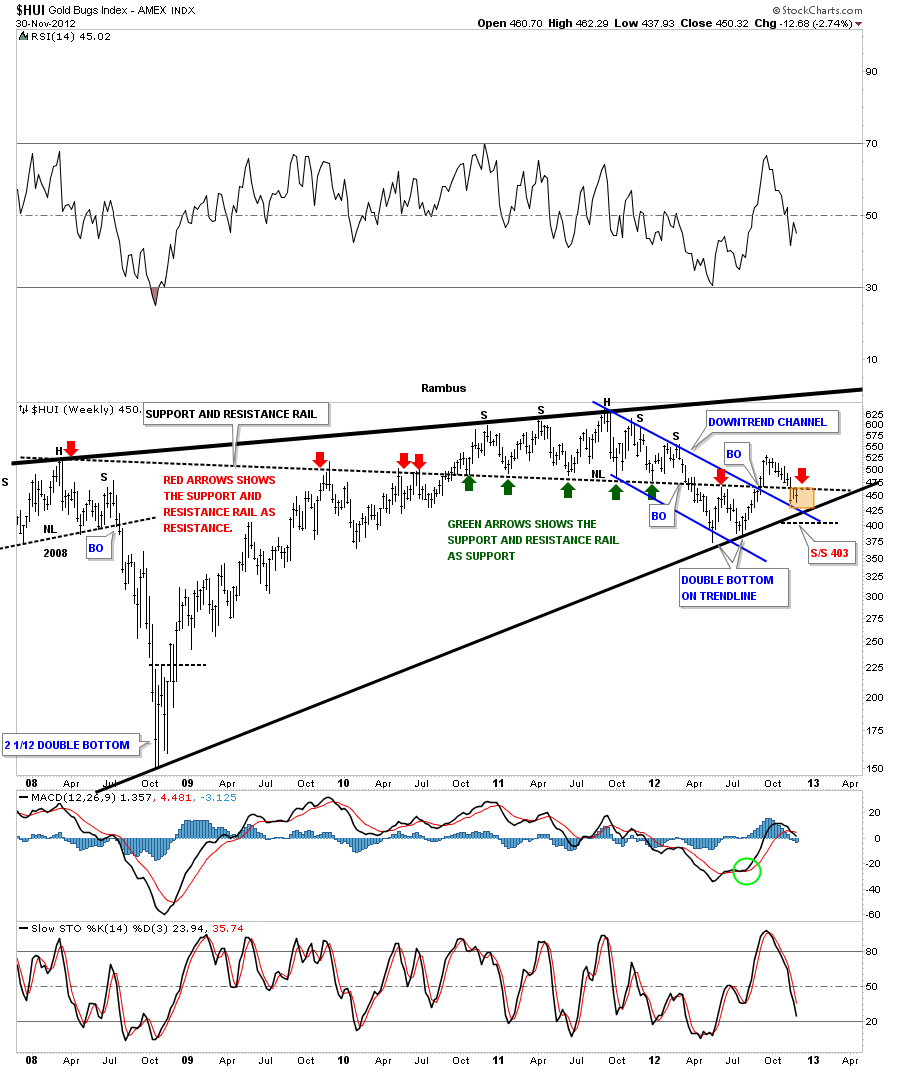
The next chart is a weekly look that shows the five year long support and resistance rail that has told us in the past when the price action is trading above it things are positive and when below things are negative. What this five year chart is telling us right now is that the HUI is now caught between a rock and a hard place. You can see it has resistance at the S&R rail but also has support at the top rail of the blue downtrend channel and the bottom rail of the black uptrend channel, brown area on chart below.
Sometimes a chart can get a little too busy and its hard to see what is really there. At times like these I like to erase all the chart annotations and start with just a clean chart. Sometimes things will jump right out at you and become very obvious. I’ve done this with a ten month daily look at the HUI. What has become apparent is that the HUI could be forming a series of H&S tops. As you can see on the chart below there is a small H&S top that broke down about two weeks ago with a small gap. Then we had that little counter trend rally that stalled out just below the small neckline #1 which is creating a possible right shoulder of a bigger H&S top #2. Sometimes reducing things down to their simplest form can yield much clear results.
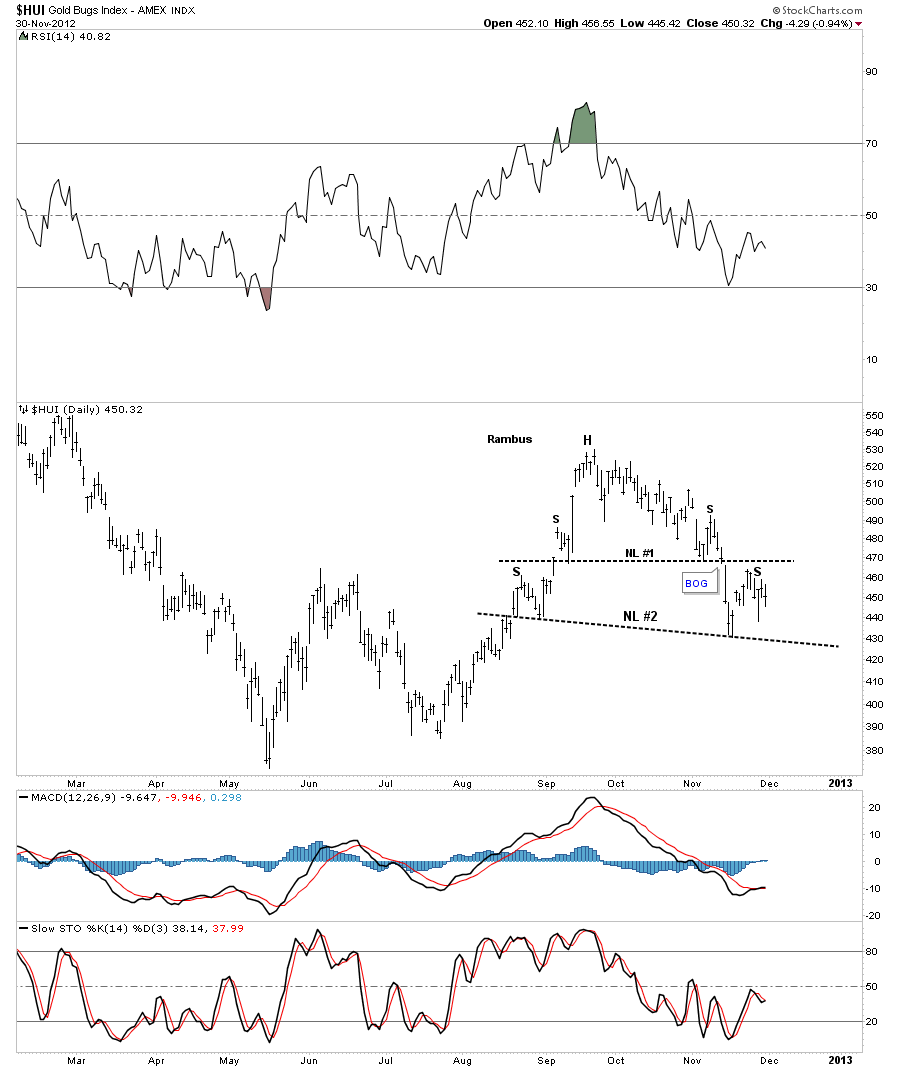
Usually, at inflection points, you can get alot of mixed signals that can cause confusion until the trend finally becomes clear once again. This is the most difficult time to be in the markets as there is no clear cut trend in which to trade. My job is to recognize a trend change as soon as possible and get back in sync with it. Its not a popularity contest we are playing here its all about preservation of capital so when a new trend emerges we can take advantage of it.

With these next set of charts I want to look under the hood of the HUI and see what some of the big caps stocks are showing as they are the stocks that make up the HUI. If alot of them are showing a certain pattern that could very well show up on how the HUI looks.

I would like to begin by showing you some of the big cap precious metals stocks that help makeup the HUI. I’ve shown some of these stocks back in the winter months when the precious metals stocks were correcting. Keep in mind most of the stocks to follow will be of the monthly longer term look that helps put things into perspective. The question we have to ask ourselves when looking at these charts, do they look like the beginning of a new leg up for the big cap precious metals stocks or does it look like a top that will lead to a severe correction. I’ll let the stock speak for themselves.

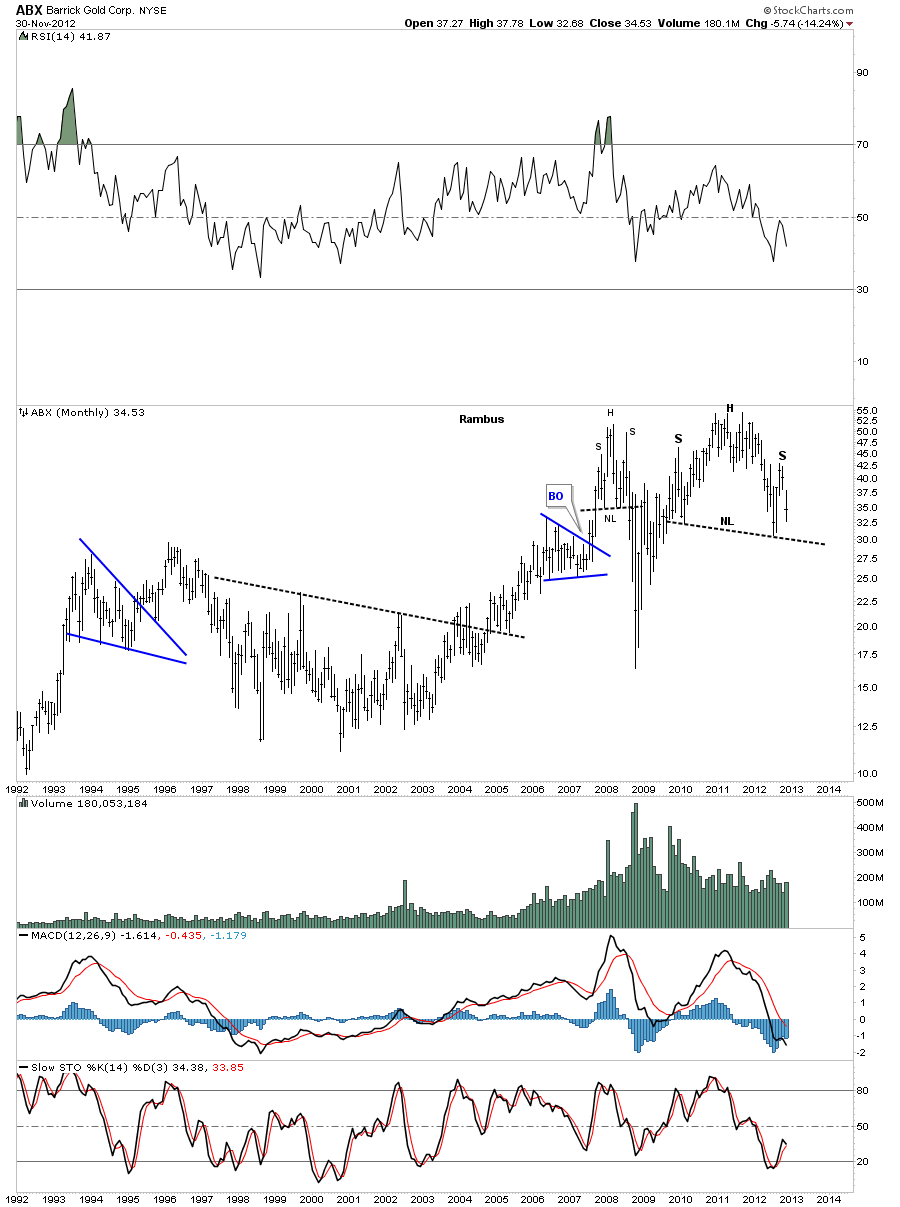
The first big cap PM stock I would like to show you is the ABX monthly look. How many charts have different analysis shown us that tell us we are in the strongest part of the seasonal trend for gold. If that is the case it would seem like the precious metals stock would partake to some degree in that seasonal strength. ABX certainly isn’t following that trend by the looks of this monthly chart. Notice how fast the right shoulder is breaking down.  That’s a huge H&S top.
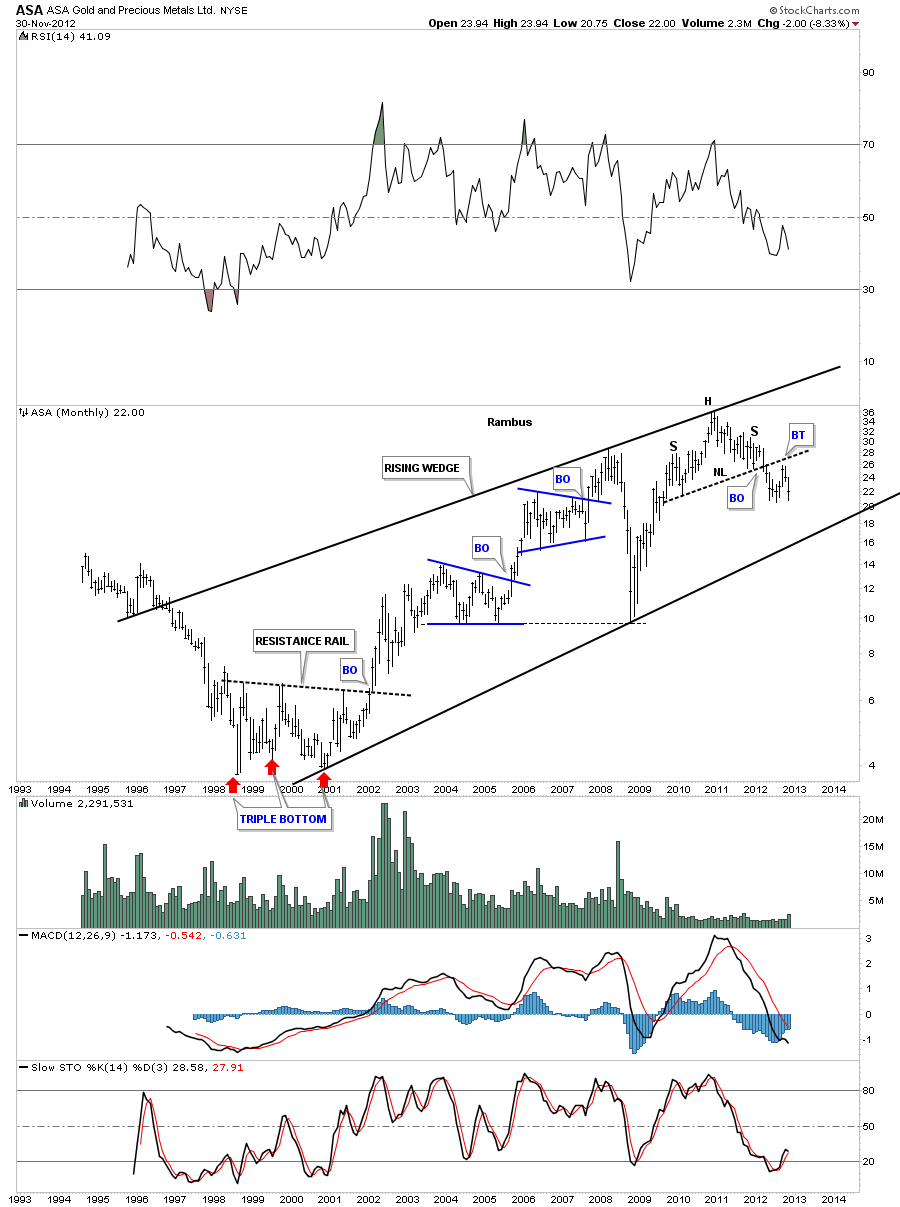
ASA is showing a H&S top at the end of a rising wedge. As you can see it’s on the verge of making a multi year low with just a little more weakness.
AU also has a monthly H&S top in place which is finishing off a red triangle consolidation pattern to the downside.As you can see it has closed the month of November at the lowest point since 2009. This isn’t how a bull market is supposed to look.

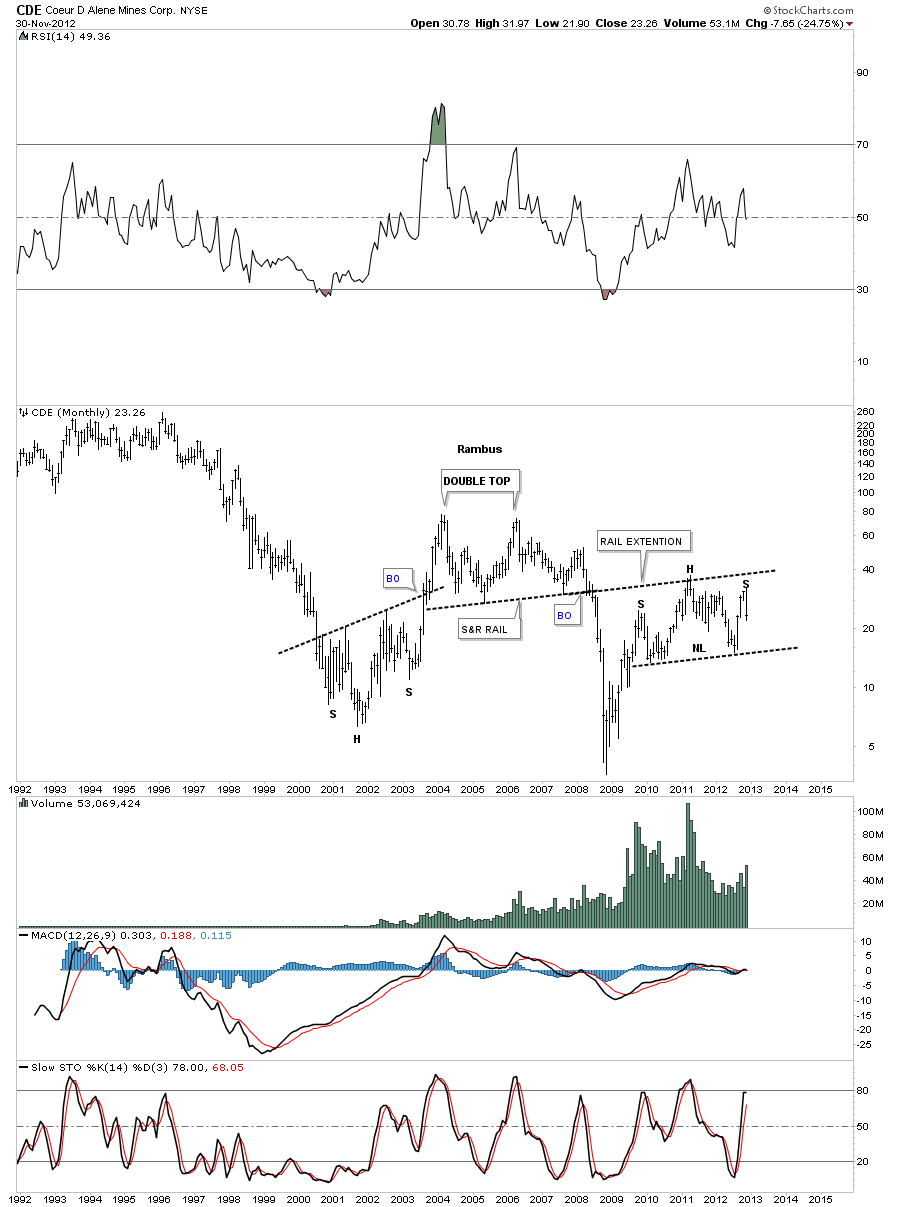
The next stock is CDE which had been one of the stronger preforming PM stocks until it was hit like so many other stock in this category. As you can see its now just breaking off the top of the right shoulder, where many  other PM stocks are trading below their respective necklines already.
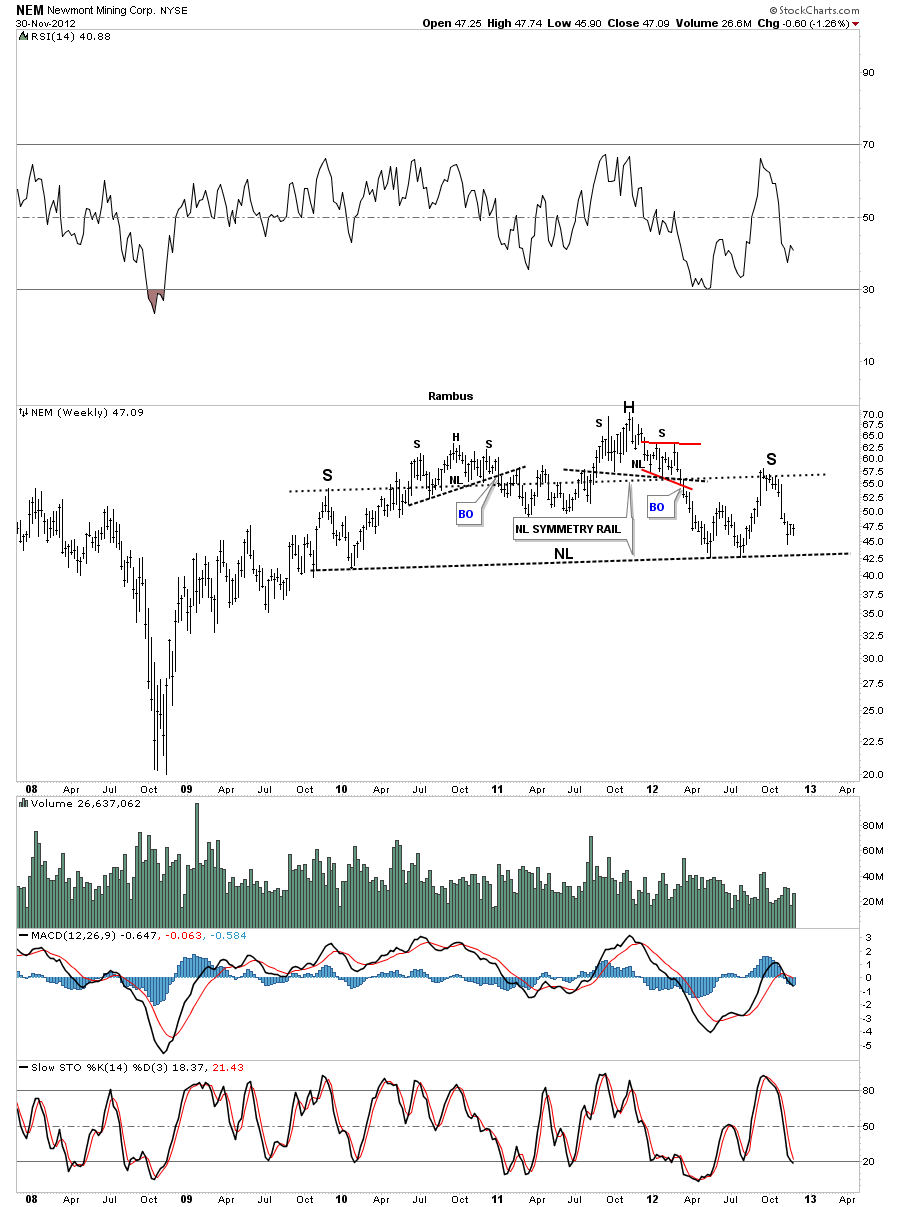
Lets first take a look at the NEM weekly chart that shows some pretty good symmetry taking place. I’ve added a neckline symmetry that is showing the top of the right shoulder that matches the top of the left shoulder.
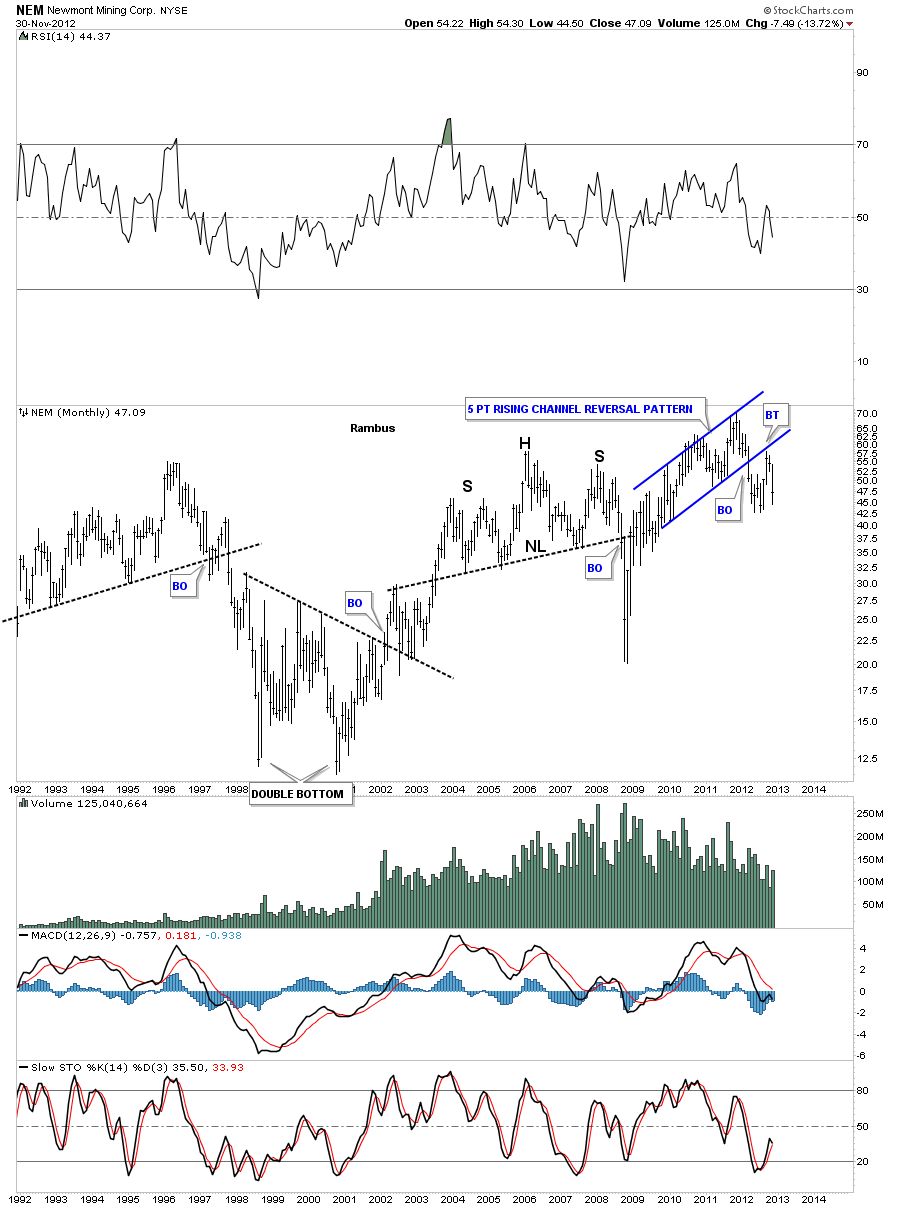
This next chart is a monthly look at NEM that shows a 5 point blue bearish rising channel reversal pattern. Notice the breakout and backtest that clearly shows the pattern as valid.
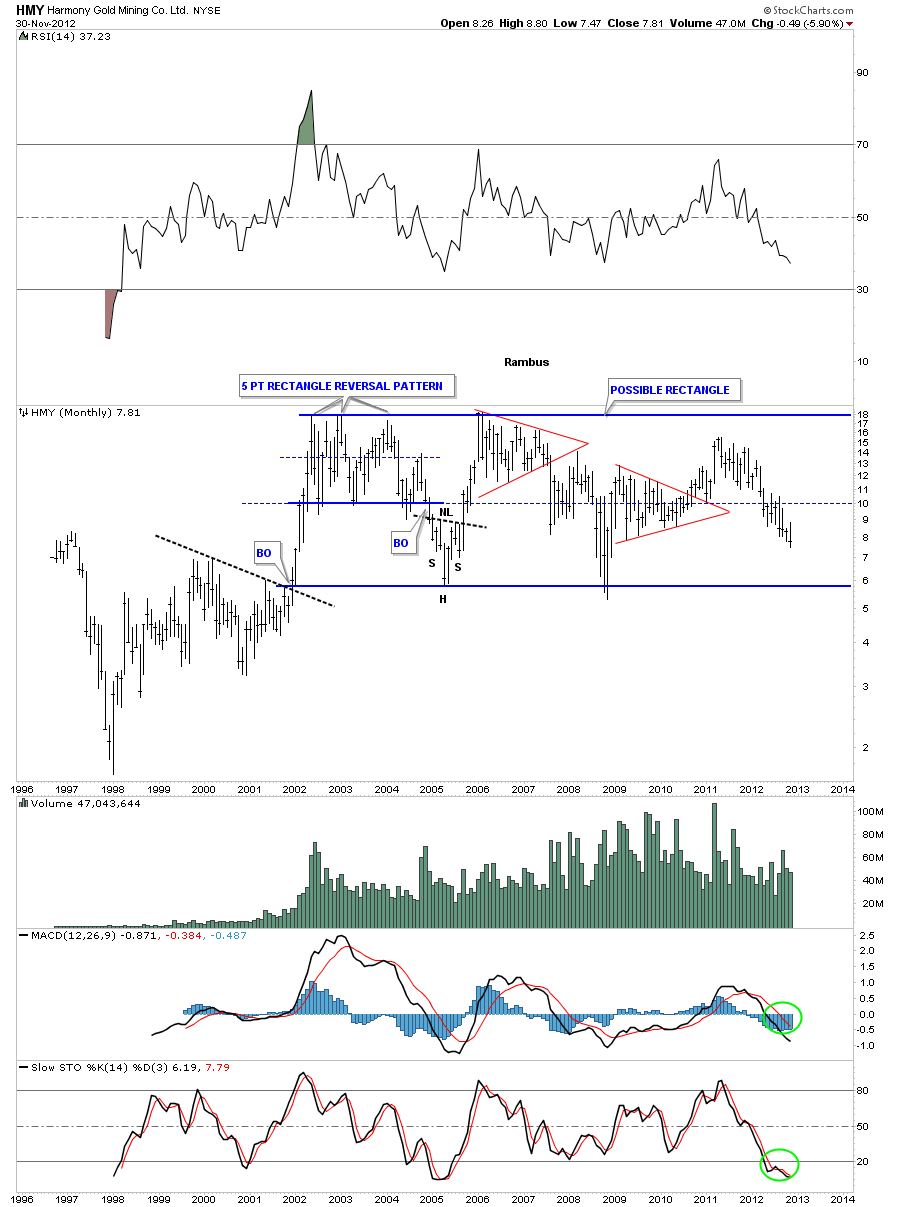
Lets look at a couple of South African precious metals stocks and see how they look. HMY has been trading in a horizontal trading range for most of it’s bull market. As you can see this stock closed the month of November at a new multi year low.  Might be a good buy around the 6 dollar level.
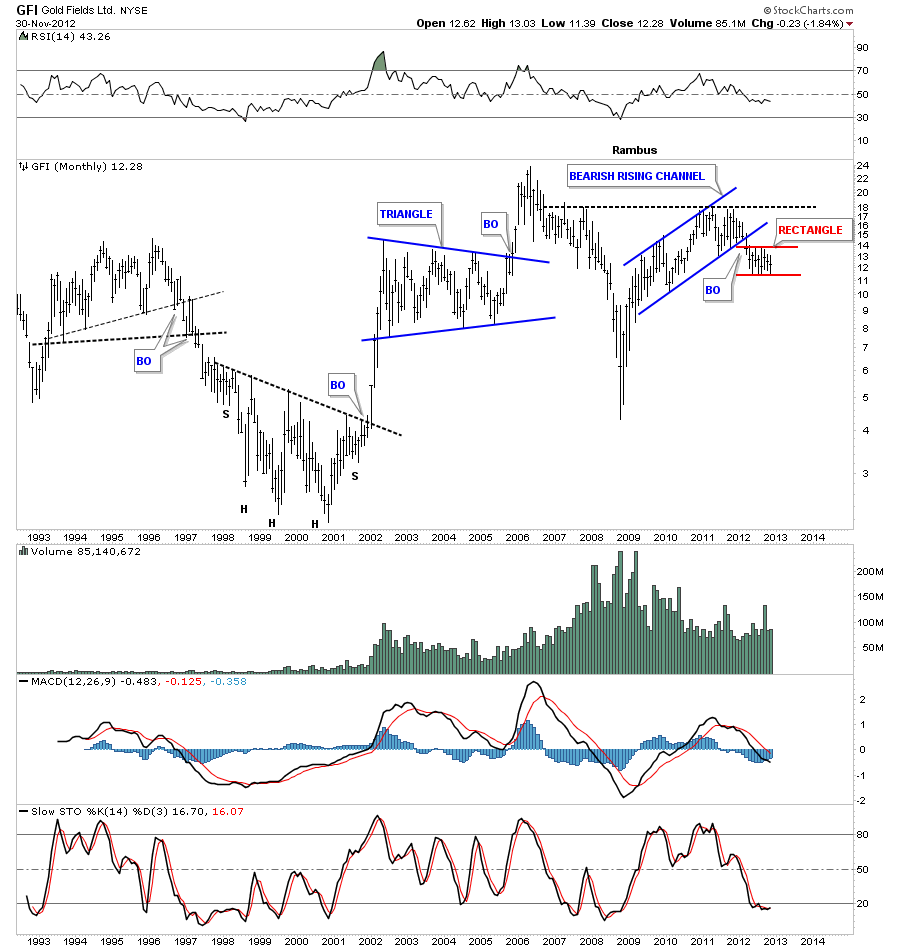
GFI has broken out of a bearish rising channel similar to the monthly NEM chart above. Its been chopping in a tight red horizontal trading range. A break below the bottom red rail will start the next leg down.
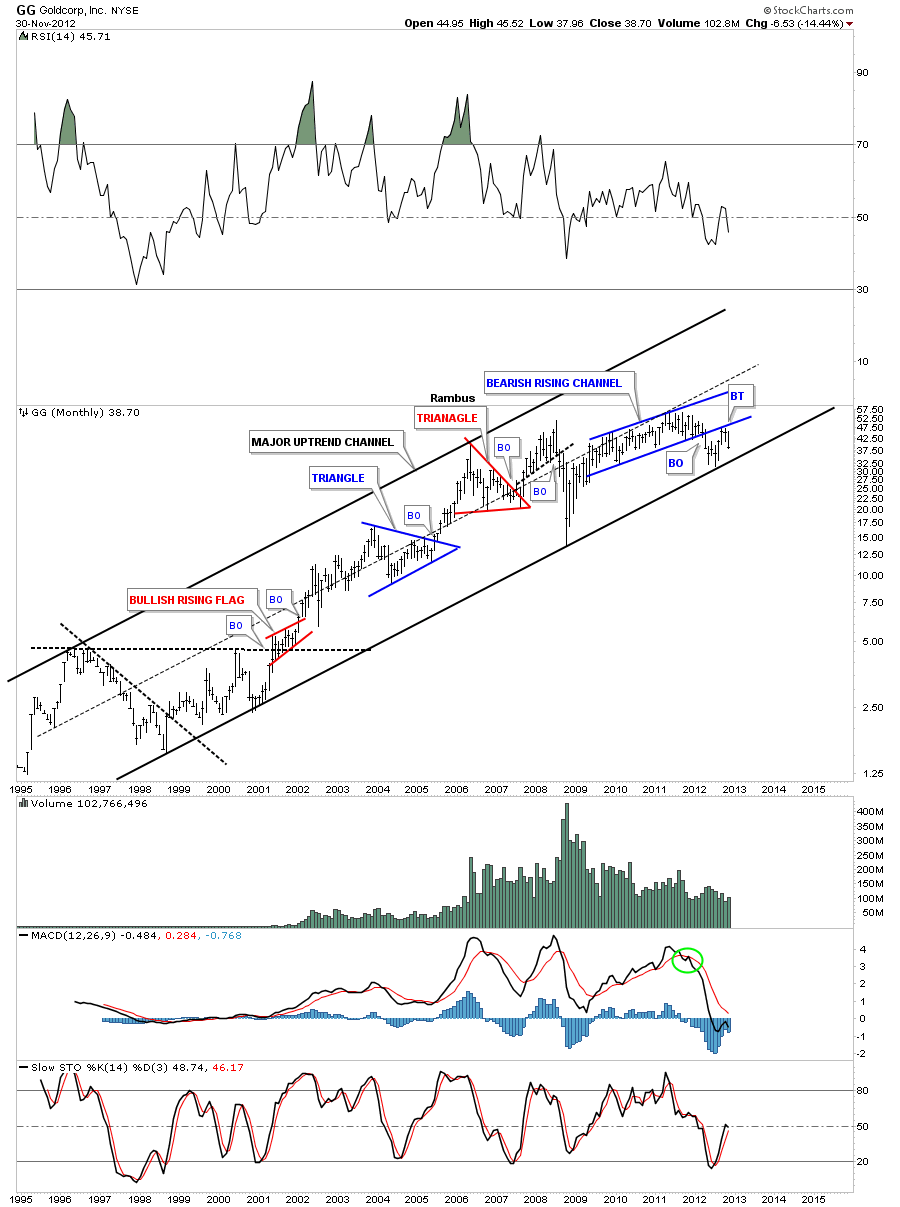
GG has been in a well defined uptrend channel since the beginning of it’s bull market. Like several other stocks I’ve shown you it to has a bearish rising channel that has broken down and has also backtested the bottom rail.
SA broke through it’s neckline over a year ago and has been in an expanding falling channel. It looks like its getting close to breaking below the red bear flag that fits nicely in the downtrend channel.

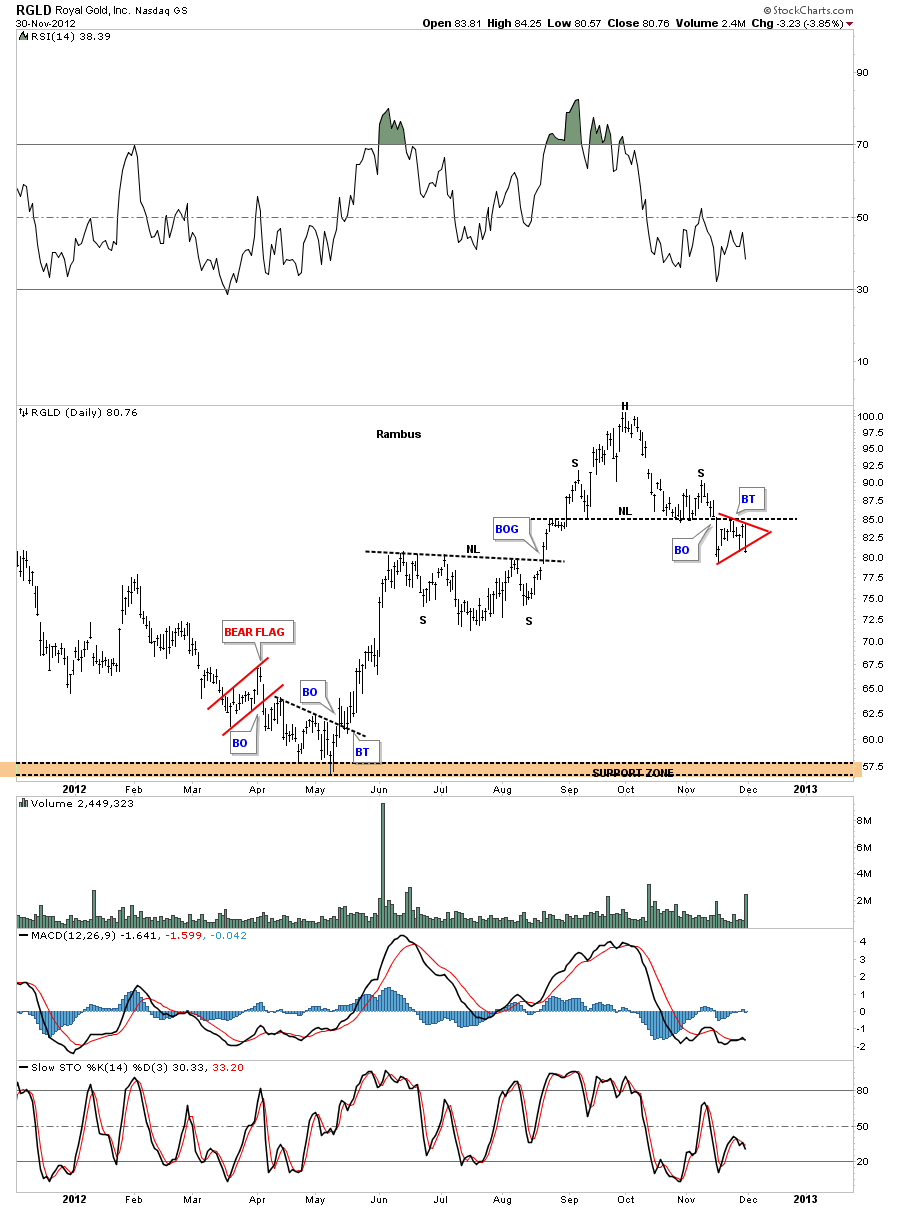
Lets look at one more PM stock that is a royalty company. RGLD has put in a H&S top on the daily look and has broken below the neckline and has formed a small red triangle. This stock was one of the leaders off the May bottom this year. It now looks like it’s a leader to the downside by dropping $20 so far.
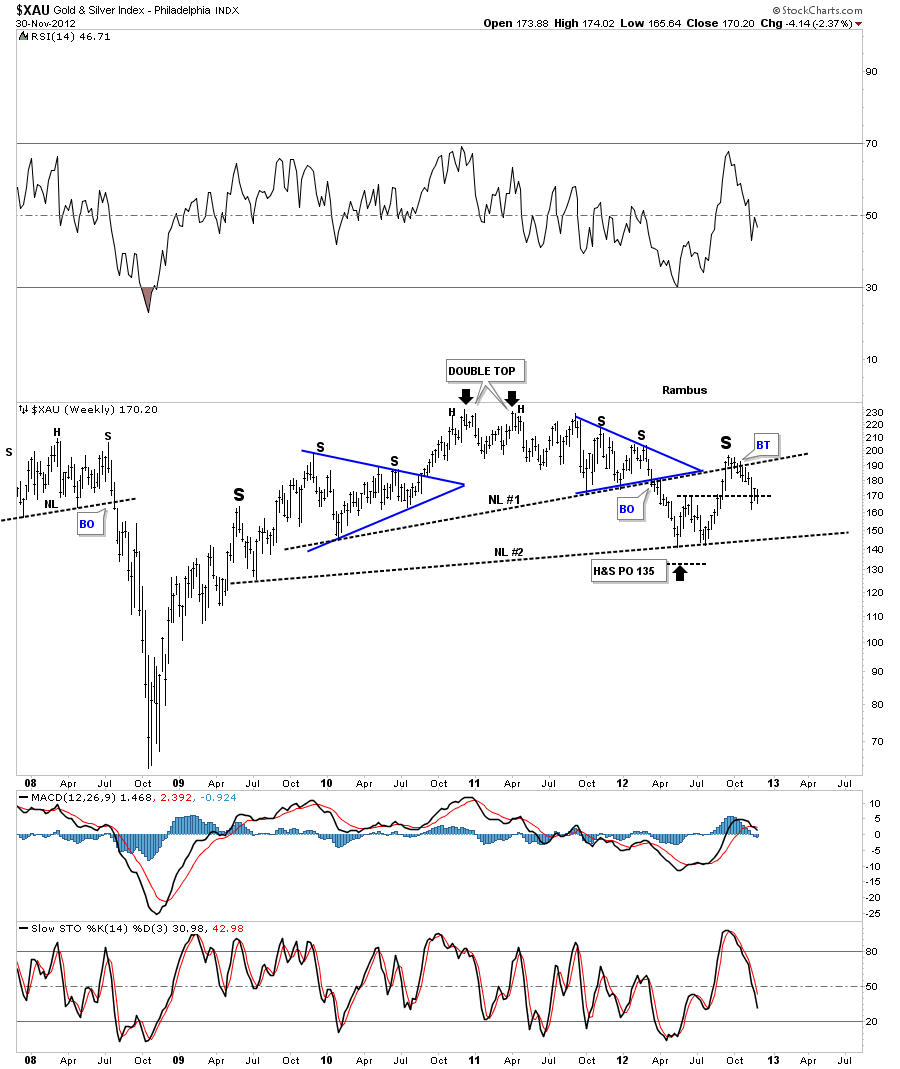
The last two charts I would like to leave you with is the XAU and the HUI long term look. The XAU has a very symmetrical H&S top with two blue triangles on each side of the head. Its also a double H&S top with two necklines.
This last chart of the HUI shows about as symmetrical a H&S top as you will ever see. There is one last critical test taking place right now and that is at the double bottom hump. Normally a double bottom hump should act as strong support on the backtest. As you can see the action is getting alittle sloppy around the horizontal black dash rail off the double bottom hump. If the HUI is going to get positive it must hold above the double bottom hump or the big H&S top will come into play. Folks this is a big deal taking place right now.
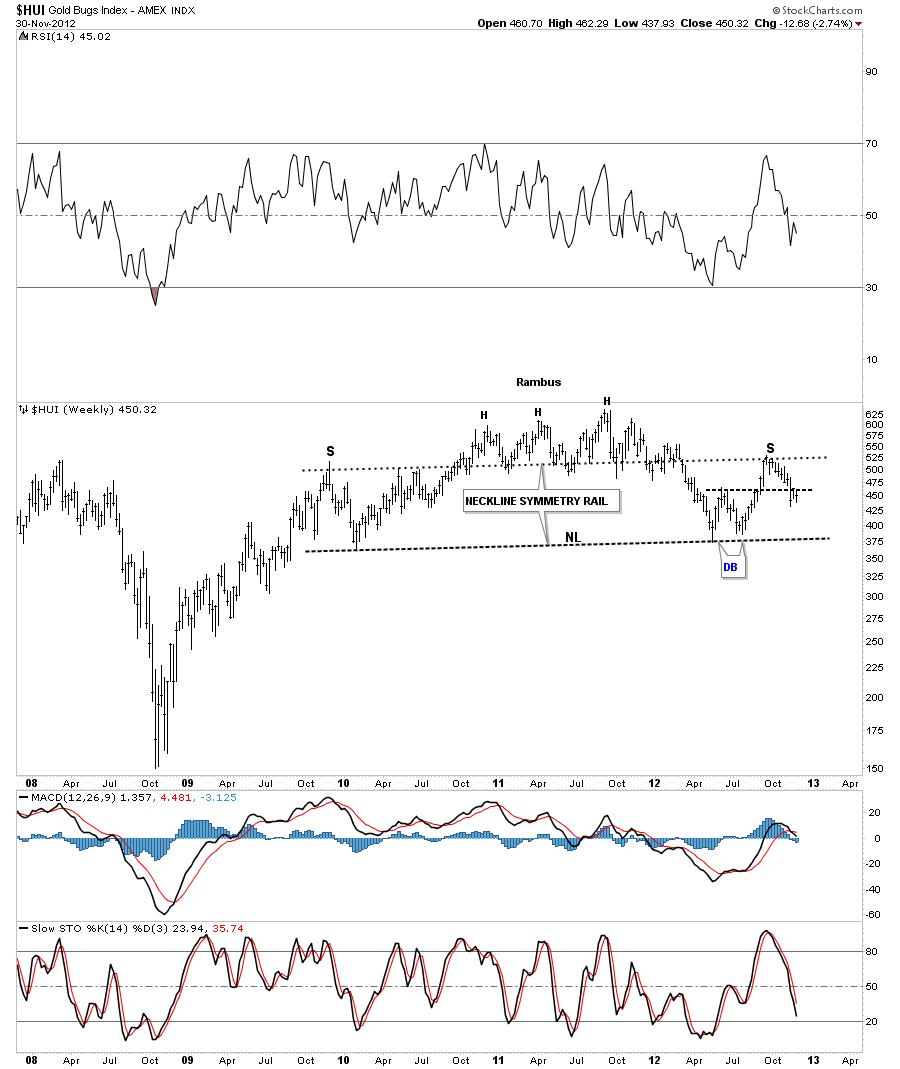
As some of our longer term subscribers know I was pretty bearish most of the winter months as the HUI was completing the head portion of this massive H&S top. When the HUI finally put in its small double bottom is was time to go long again which we did. As you can see the rally stalled out at the neckline symmetry rail. That was another key point on the chart above. If the HUI was truly in a new bull market phase the top of the right shoulder should have been taken out. As I’ve stated earlier we are testing the most important area on the H&S top and that is the double bottom hump. The H&S top pattern can still be negated if the HUI stocks start a strong rally and the top of the right shoulder is taken out to the upside. But as I have shown you above alot the big cap PM stocks are already starting to break down.

Folks, this is nothing to be afraid of. We can make just as much money with the stocks going down as when they go up. As a matter of fact stocks usually go down faster than they go up. I just want to see little more confirmation around the double bottom hump area before we commit in a big way. As they say there is more than one way to skin a cat and when your dealing with the markets, no truer words were ever spoken.

This week coming up could be a transitional week for us if we start to see some weakness. We will be raising some cash on Monday for sure and then we’ll take it from there. Stay tuned as things could start to get exciting once again.  All the best…Rambus.


EDITOR’S NOTE :
Rambus Chartology is Primarily a Goldbug TA Site where you can watch Rambus follow the markets on a daily basis and learn a great deal of Hands on Chartology from Rambus Tutorials and Question and Answeres .
Most Members are Staunch Goldbugs who have seen Rambus in action from the 2007 to 2008 period at www.goldtent.org and now Here at Rambus Chartology since early 2012 .
To review his Work and incredible calls from the 2007-2008 period click on the top right sidebar in the “Wizard of Rambus” ….”What If !!” Post
To Follow Rambus Unique Unbiased Chart Work and participate in a Chartology Form with questions and answeres and learn the Art and Science and Mindset of a Pro Trader please Join us by subscribing monthly for $29.99 at
www.rambus1.com
We have many subscribers from all over the world who are glad they did as they enjoy the many daily updates and commentaries provided at this exciting new site
As you will see Rambus (Dave) has prepared us for this difficult period by being one of the only ones to see and warn about the incredibly debilitating PM smackdown as early as Jan 2 2012 …click on the” HUI Diamond in the Rough” Post in the “Wizard of Rambus” top right
More Recently Rambus called a Bottom in HUI in this post…and has had subscribers on board for a Powerful Run to the Upside
rambus1.com/?p=5651
BUT
What is he seeing Now ?
You will find Rambus to be a calm humble down home country tutor with an incredible repitoir of all the TA based protocols tempered with his own one of a kind style…simply put…He wants to keep his subscribers on the right side of these crazy volitile and downright dangerous markets
See you at the Rambus Chartology
www.rambus1.com

GLD Update…Heads Up !

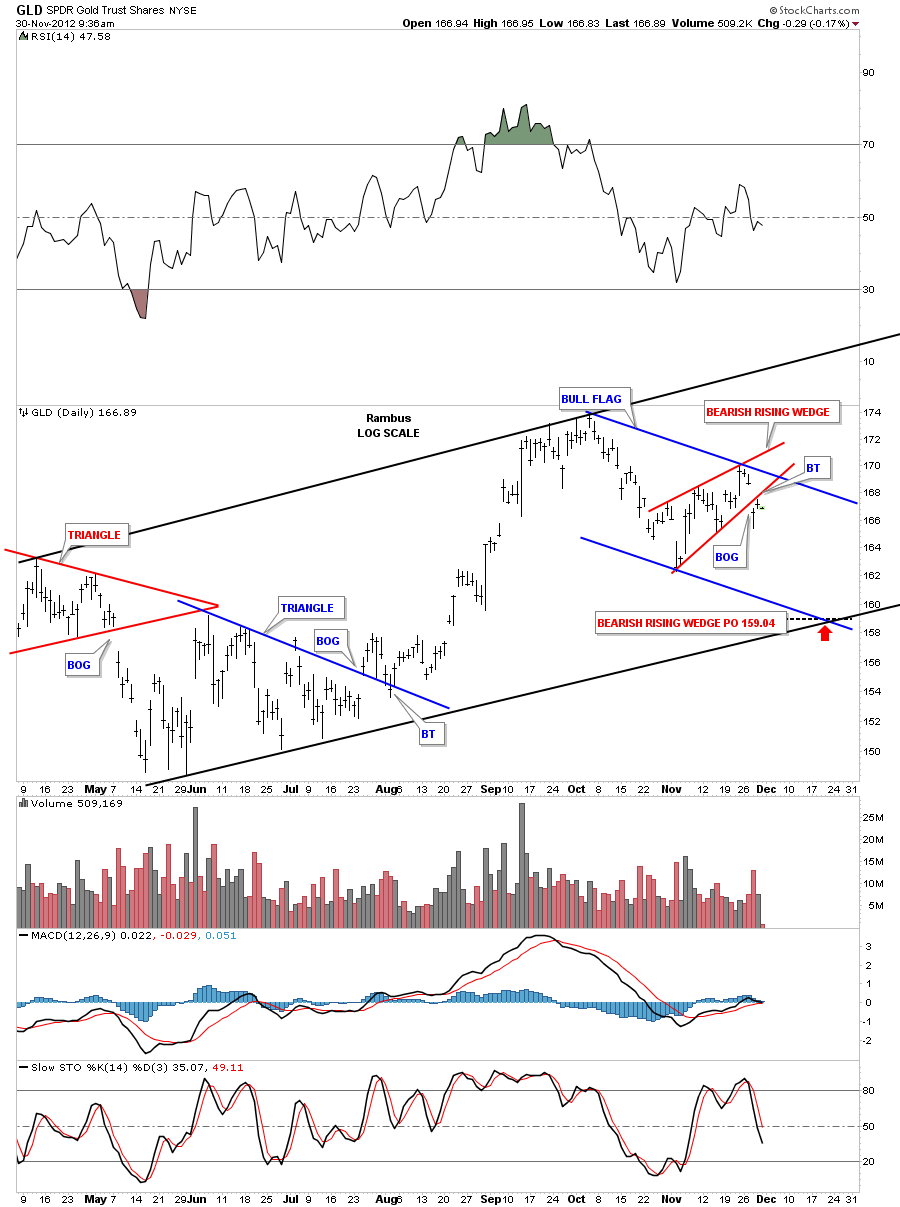
I’ve been studying the GLD to figure out why GLD broke down the other day with a big gap. It drastically changed the short term picture that had been in place. It looks like there could be a small red bearish rising wedge halfway pattern that is showing up within the confines of a bigger blue bull flag. Elliot wave guys would call this an ABC correction within the uptrend channel. If we see some weakness today we will sell our UGLD.. The chart below shows the possible setup if GLD can’t trade back above the bottom rail of the red bearish rising wedge. The price objective would be around the 158.81 area.

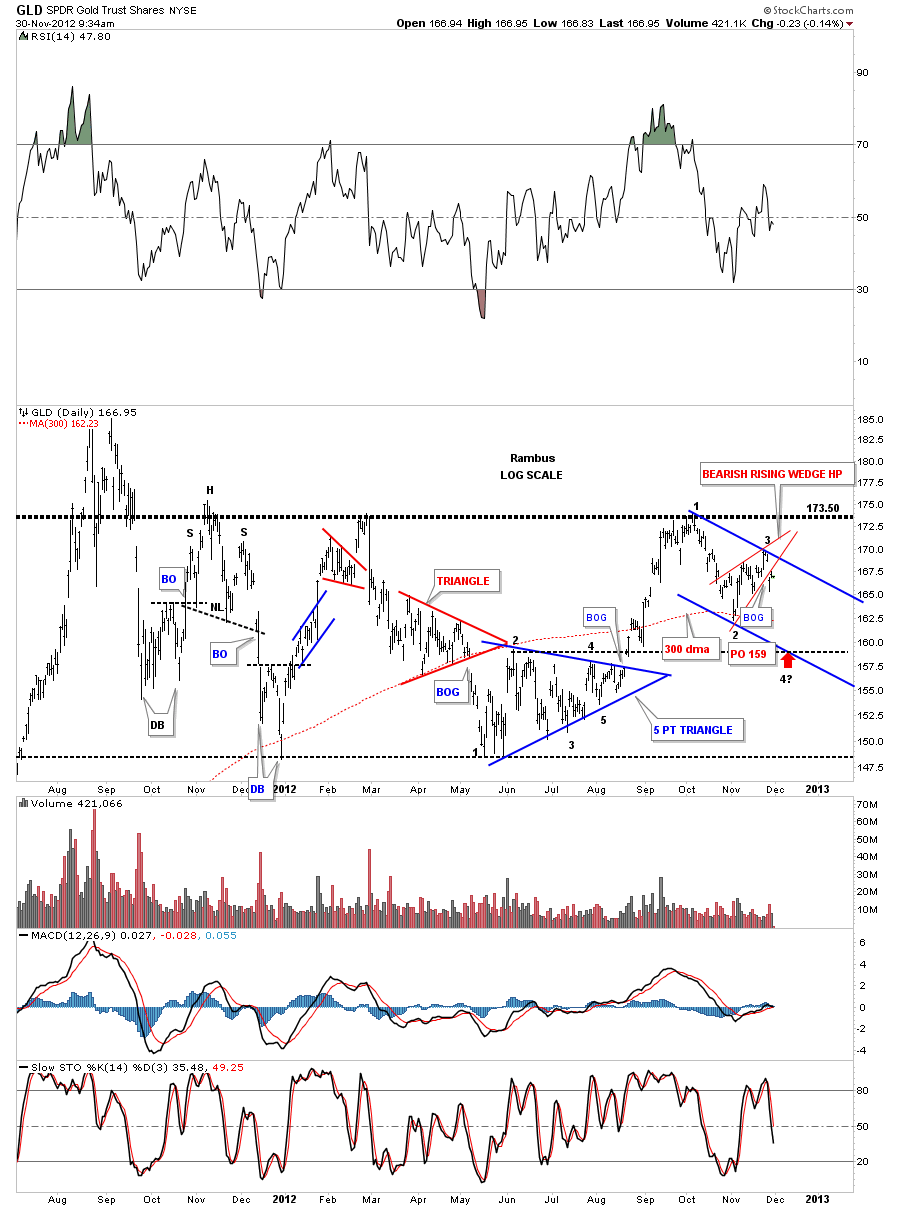
This longer term chart for GLD shows the price action trading below the top rail of the rectangle.

Below is a 6 month time cycle chart for gold that has done a pretty good job of calling the bottoms since 2009. It shows another 6 month time cycle bottom is due around the 17th of December. This may indicate that gold still has some more chopping around to do for the next 2 weeks.


SLV Update…

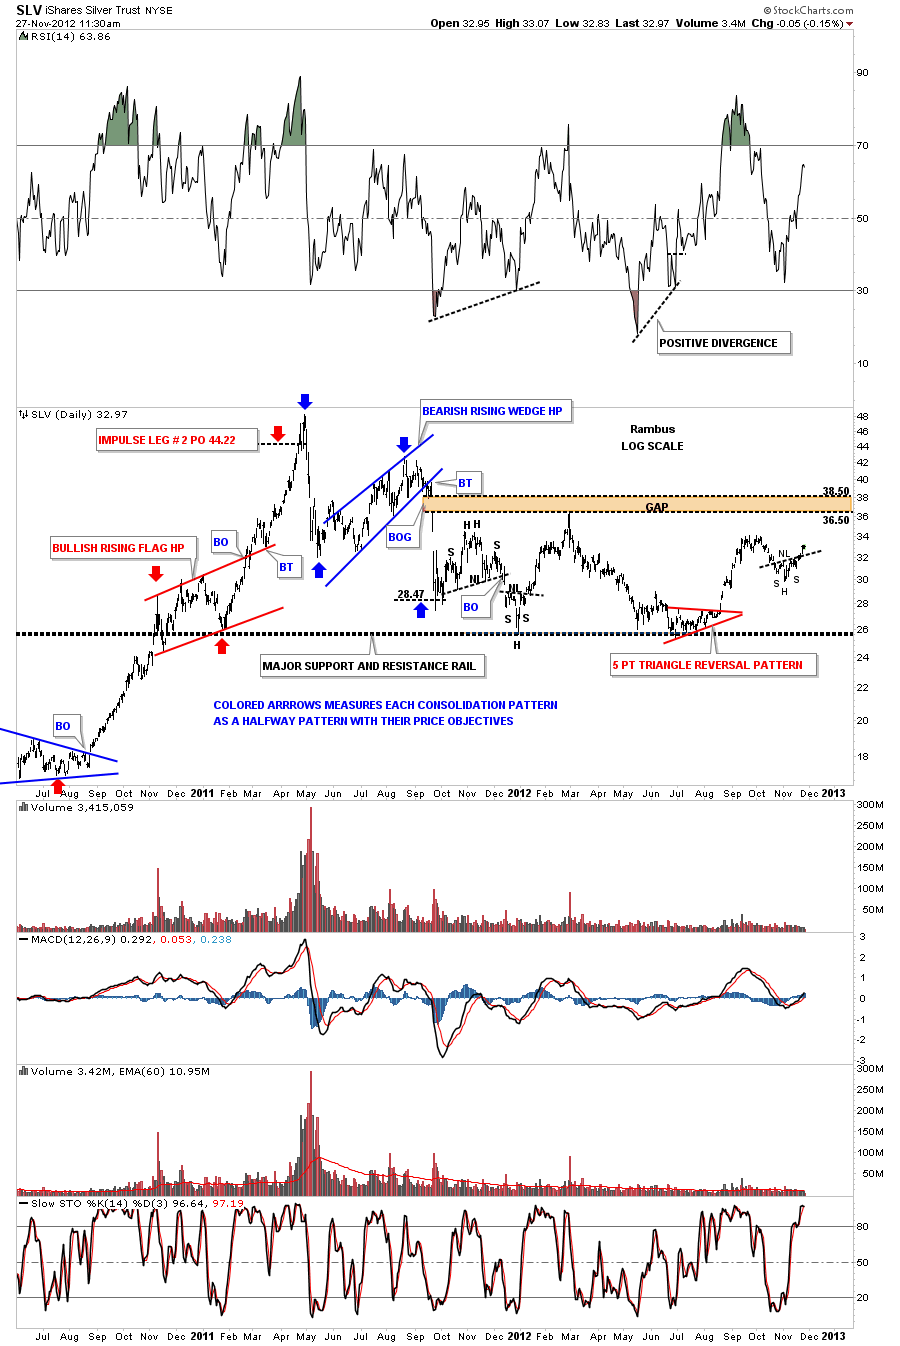
I just want to show you a quick update on the 2 1/2 year daily chart that shows the big 2 point gap that was made on the way down back in September of 2011. I have always kept the big gap on my radar screen knowing one day we would eventually be back to visit this area. You can see our little H&S bottom on the far right side of the chart that may give SLV enough energy to reach the gap area. For those that are studying halfway patterns there are a couple of good examples on the chart below.

Weekend Report…The Buck Stops Here 2 !

About a month or so ago I wrote the Weekend Report on the US Dollar showing many dollar charts that were suggesting the dollar was close to topping out. Its important to pay close attention to the dollar as it affects so many markets especially Gold and Silver. I would like to update a few of the charts to see how the price action has been.

rambus1.com/?s=The+Buck+Stops+here

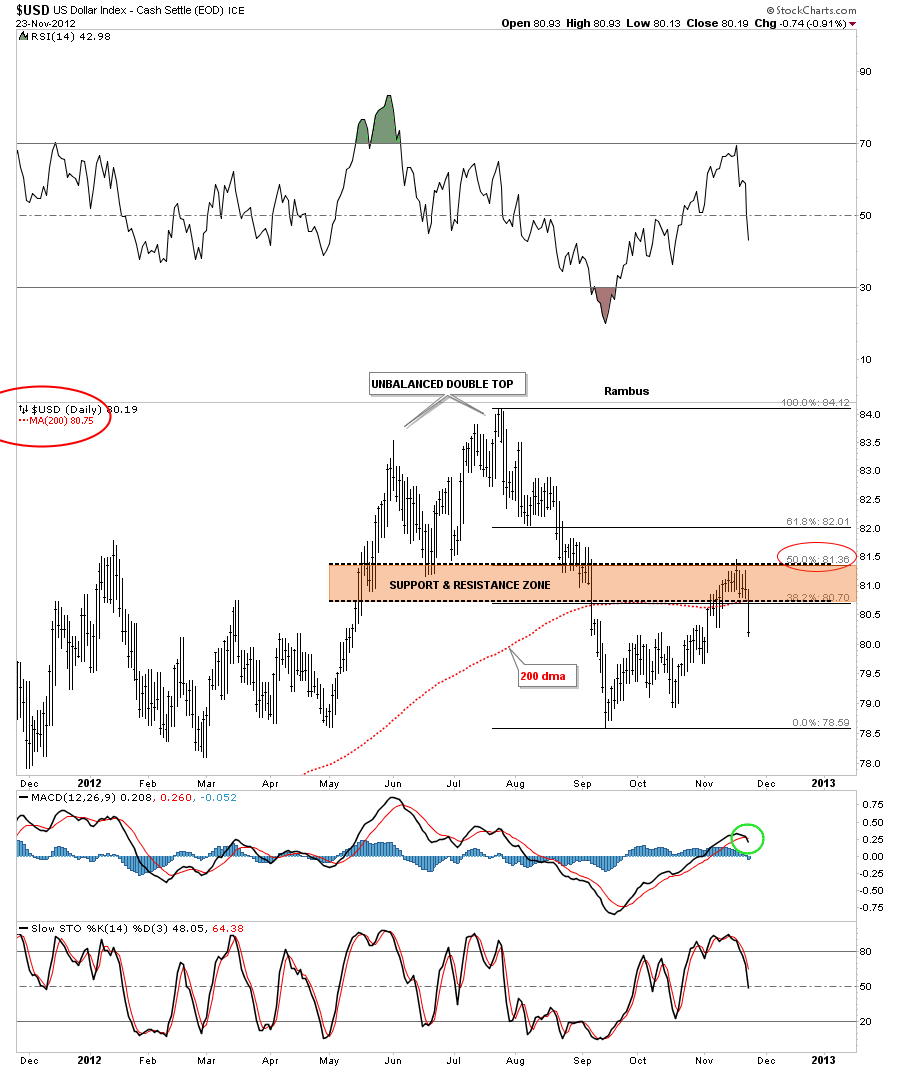
First lets look at the Fibonacci retracements and see which one finally held resistance. The chart below shows the 50% retrace held which also corresponded to the top of the brown shaded support and resistance zone. Fridays price action also closed below the 200 dma and MACD at the bottom of the chart has now crossed giving a sell signal.

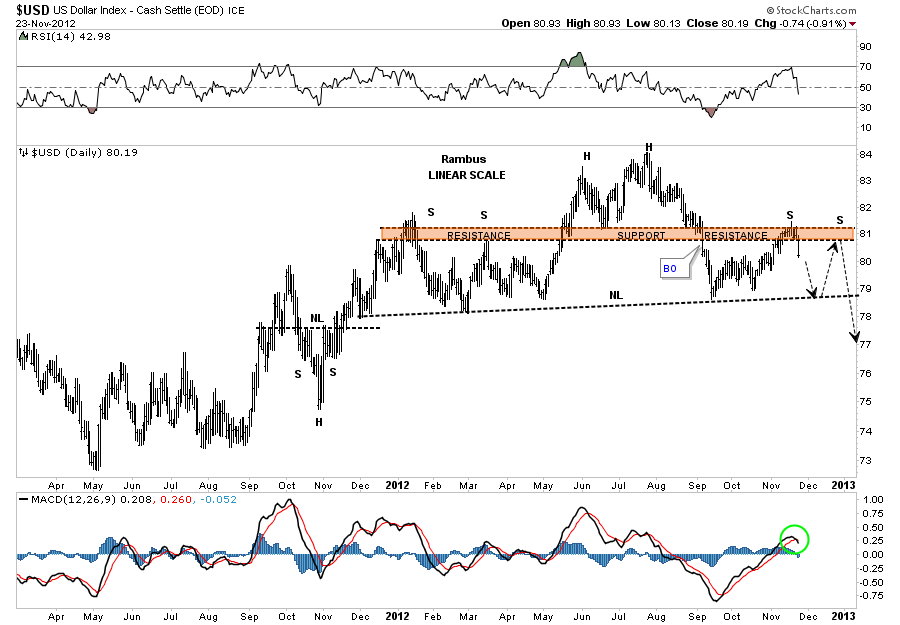
Next lets look at the H&S that was forming that has two left shoulders. It looks like the dollar has just completed the first right shoulder and is headed back down to the neckline. As you know symmetry plays a big role in how I look at the charts. As you can see on the chart below the left side of the H&S top has two shoulders. Its very possible that the dollar may build a second right shoulder before the H&S top is complete. Its possible that this H&S top could be of an unbalanced variety meaning two left shoulders and one right shoulder. We will just have to see what happens when the dollar reaches the neckline and take it from there. Note the MACD has crossed and is now giving a sell signal as well.

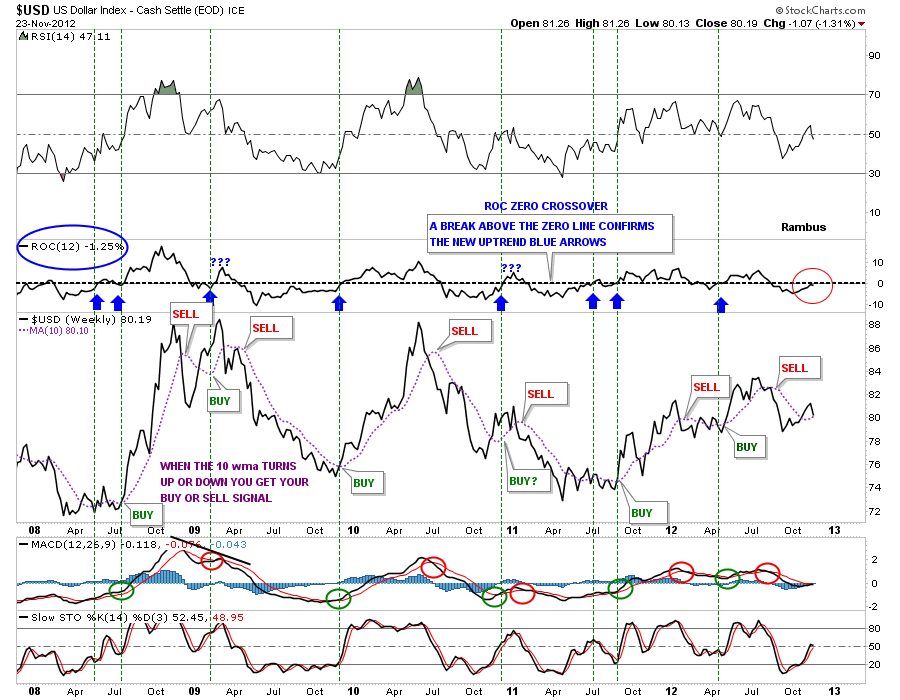
Lets take a look at the ROC indicator that was approaching the zero line, red circle on chart below. Its currently at a minus 1.25 which is still in negative territory. The 10 wma has turned up ever so slightly but with last weeks price action in the dollar there is a good chance it will start to roll over again. From this ROC indicator I still rate the dollar as on a sell signal.

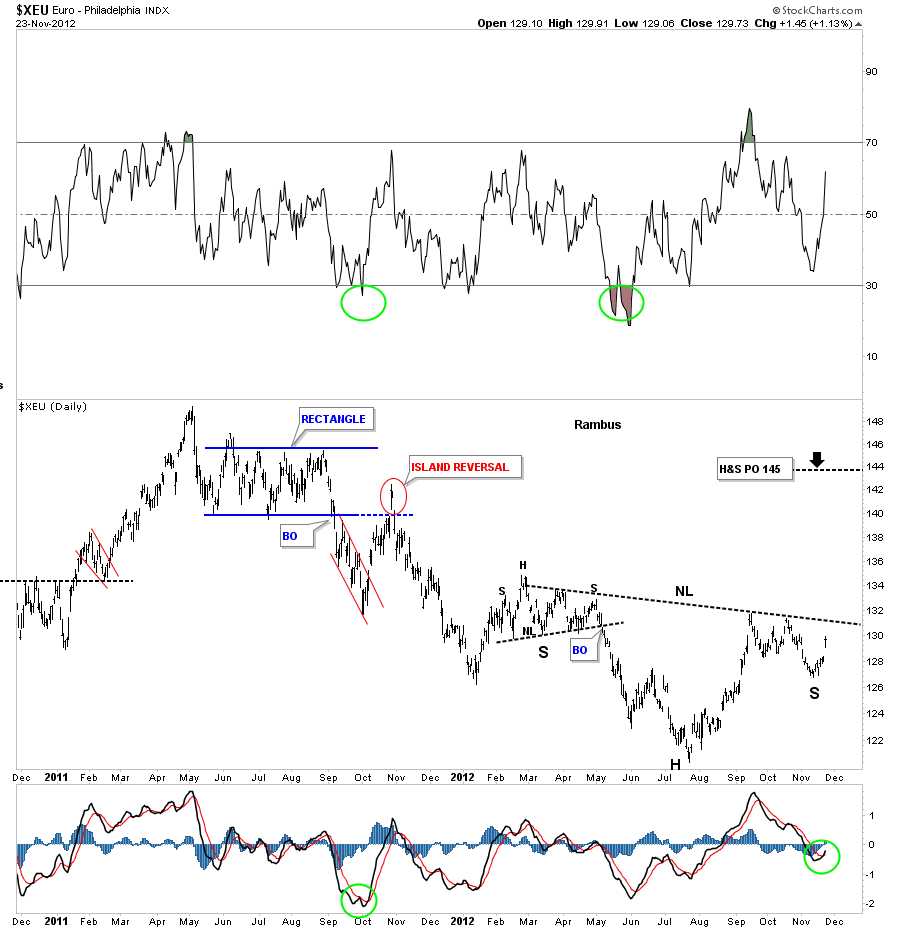
Lets now take a peek at the Euro as it should have an inverse look to the US Dollar. The daily chart below shows a nice inverse H&S bottom forming that has a price objective up to 145 or so as a minimum move. Note the MACD indicator at the bottom of the chart has now crossed and is giving a buy signal.

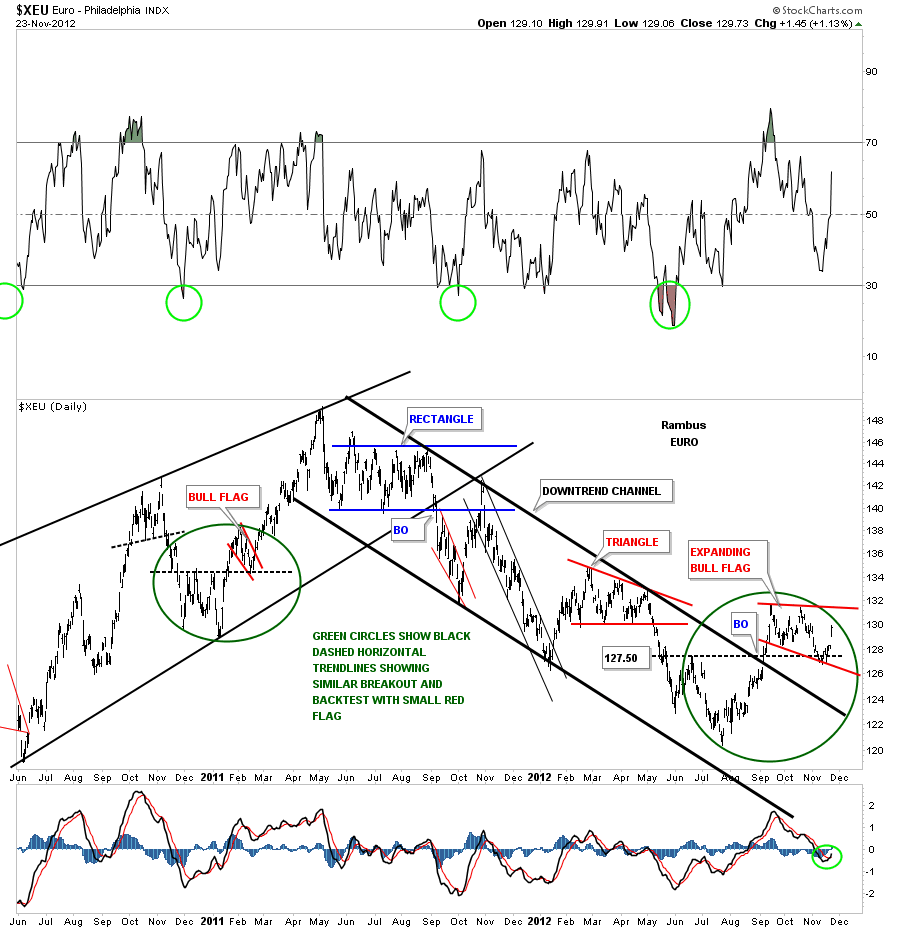
I used a slightly different approach looking for the bottom for the XEU (The Euro ETF).  Notice the big green circle on the left side of the chart and how the little red bull flag formed right on top of the black dashed horizontal rail that acted as support. Now focus your attention to the right side of the chart and the big green circle that is showing the same setup. After testing the black dashed horizontal rail as support the euro began to liftoff last Friday. That bottom is also the bottom for the right shoulder I showed you on the chart above.

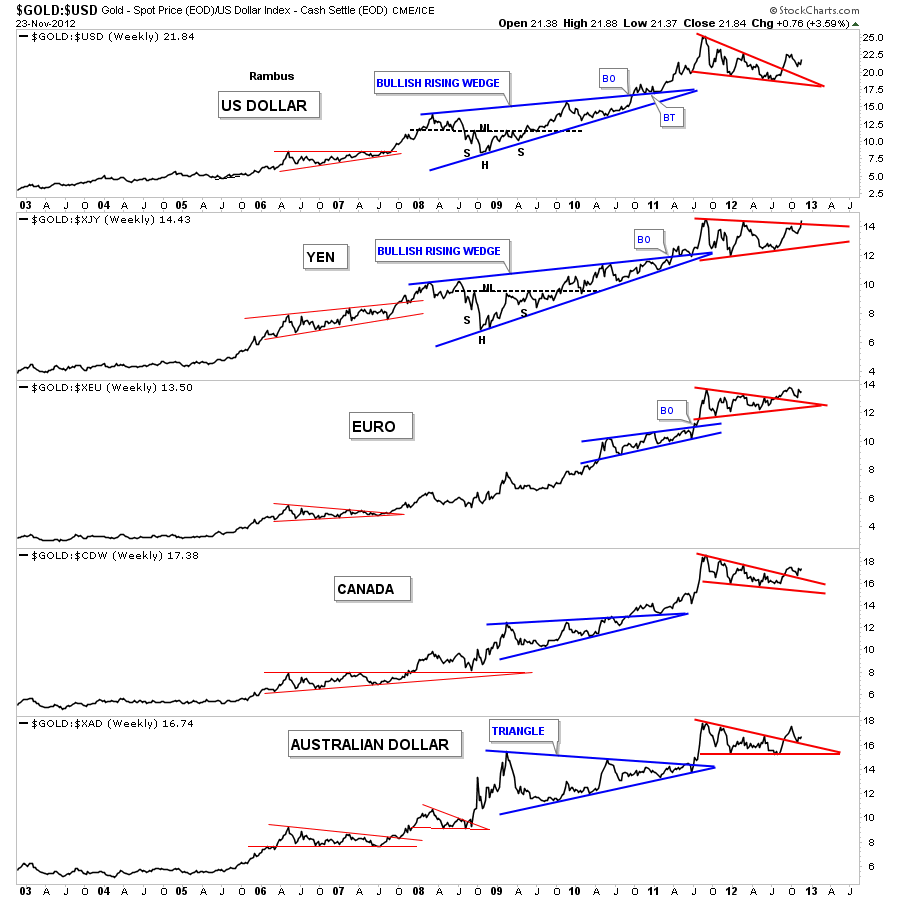
Lets see how gold looks from several different currencies. The chart below is a combo chart that shows how gold is trading against the US dollar and several of the major currencies of the world. As you can see gold has broken out of the red triangles and is in the process of doing some backtesting in some cases. The Yen to gold looks particularly strong in here as it will probably be the first currency to reach new all time highs with the euro right behind.

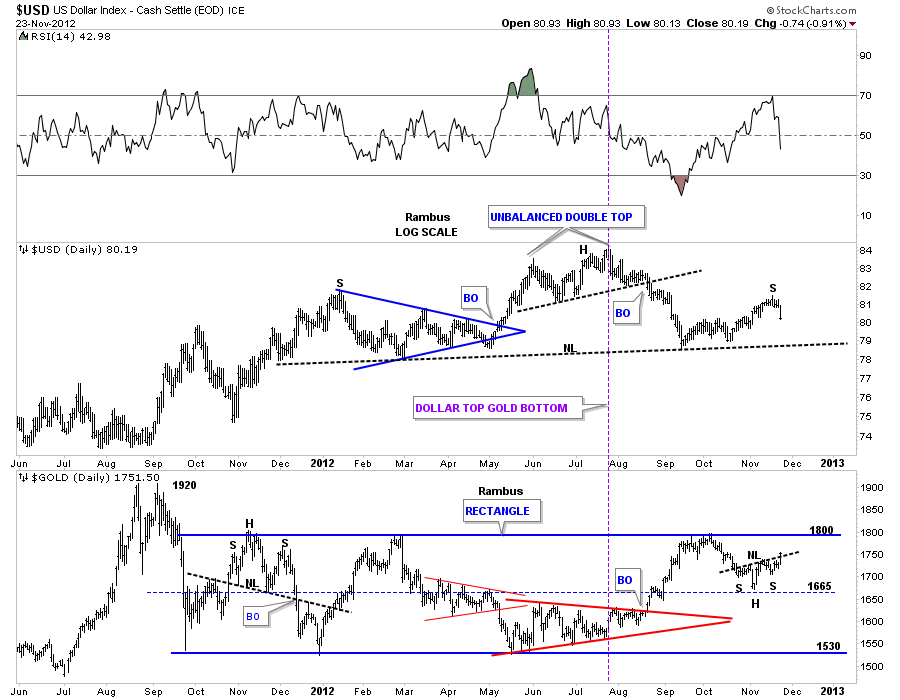
Lets look at one more combo chart that shows the US dollar on top and Gold on the bottom. This chart shows the inverse relationship between the two, purple vertical line. The most important thing to take away from this chart below is the neckline on the dollar and the top blue rail of the rectangle for gold. Those are both strong and hot rails. By the looks of it they will both hit their respective rails at the same time, the dollar the neckline and gold the top blue rail of it’s rectangle. That is what you can call an inflection point. I suspect they will both work through the breaking out and backtesting process together for their critical trendlines. Once the breakout and backtests are complete each trendline will reverse its role. The neckline once broken to the downside will act as resistance and the top blue rail of the rectangle will act as support when it finally gives way.

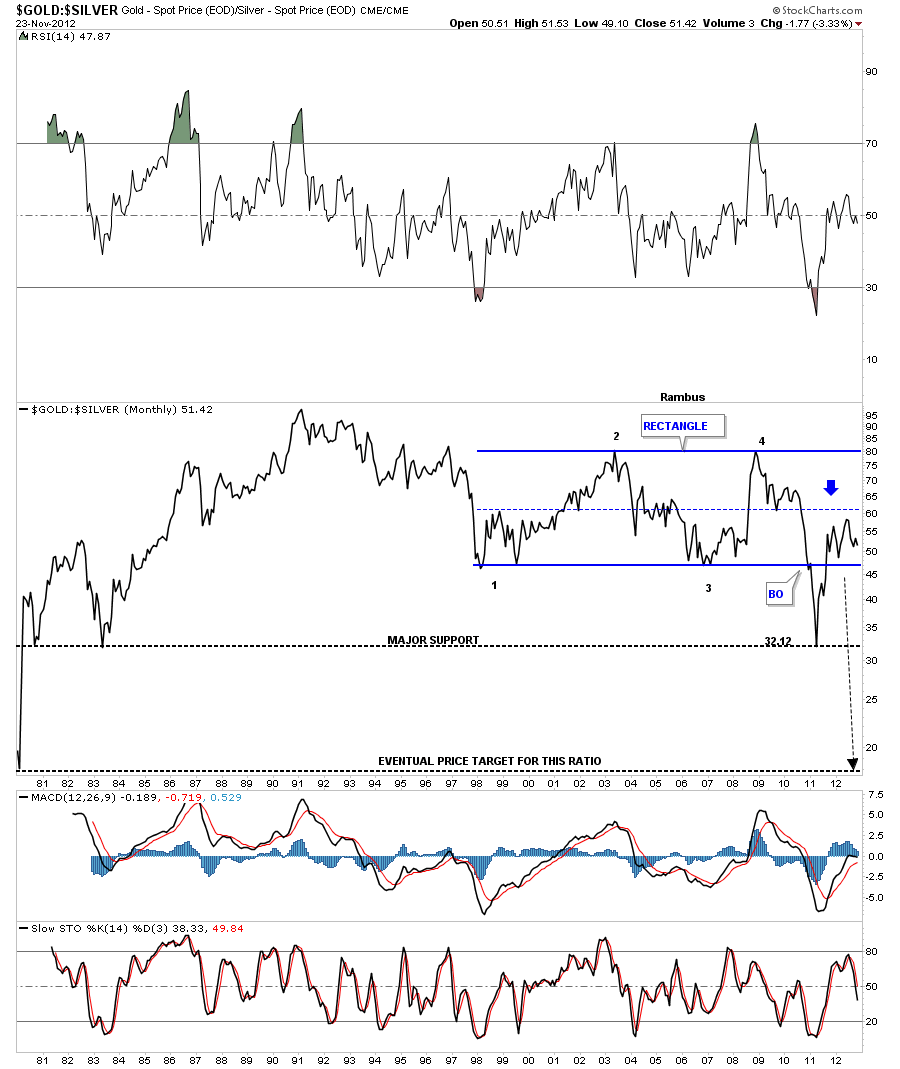
Lets look at one last chart that is the gold to silver ratio chart. When the price action is falling silver is outperforming gold. In a strong move in the precious metals I like to see silver outperforming gold. A break below the bottom rail of the blue rectangle will signal silver is the place to be for investments purpose. This would also be bullish for the stock markets.

OK,  one last chart of the gold to silver ratio that shows when silver is outperforming gold it’s good for the stock markets. Thats because its still looked at as a commodity. A strong stock market equals more demand for silver so the two go hand in hand. The SPX is above and the gold to silver ratio is on the bottom. As long as the black arrows point up for the SPX and down for the gold to silver ratio that should be a bullish setup especially for silver.

I’ve been working on a long term gold chart that will show you how beautiful this bull market has been. I still have a little more work to do but It should be finished for the Wednesday Report. So stay tuned as it will be one of a kind chart that you won’t find anywhere else on the net….All the best…Rambus


More at
www.rambus1.com

Wednesday Report… Positive Signs , Bottoms Up !

Tonight lets look at some of the positive signs that are beginning to show up that are showing a bottom might be close at hand or already in for the precious metals stocks. The first PM stock index to look at has been one of the most symmetrical in several ways. The XAU has bounced perfectly off the neckline symmetry rail and shows a nice rally maybe starting. We still can’t rule out one more test of the neckline symmetry rail as alot of times there are two test of an important trendline before the real move begins.  If you look at some of the other tops and bottoms on the chart below you will see what I mean.

There is another form of symmetry, on the chart above that most won’t see,  is both the left and right shoulders of the inverse H&S bottom are both expanding wedges. The left shoulder is a bearish expanding rising wedge and the right shoulder is a bullish expanding falling wedge. With the double headed double bottom for the absolute bottom and the two expanding wedges for the left and right shoulders gives us an awesome looking H&S bottom. If the neckline symmetry rail is showing us the low for the right shoulder we can expect at least a 100 point rally in the XAU when the neckline is broken to the upside.

The GDX is also showing a very similar setup in regards to the neckline symmetry rail. It also has two expanding wedges as it’s left and right shoulders. I would like to see the MACD crossover to confirm the bottom is in.

The HUI has a similar setup to the other PM stock indexes. I’ve added an uptrend channel that may or may not come into play down the road.

The GDXJ small cap PM stock index show a little different look to the bigger cap stocks. It still has a double bottom with a smaller inverse H&S base. It also has an expanding falling wedge that backtested the neckline last week.

The next chart I would like to show you is a daily line chart for the HUI that shows the double bottom hump still working as support. Line charts are good for showing where real hidden support or resistance is by taking out the spikes that a bar chart can show. As you can see on the chart below the HUI is getting a nice bounce from the lower area of the brown support zone.

This next chart of the HUI shows the backtest taking place to the top blue rail of the downtrend channel. So putting some of the pieces of the puzzle together you can begin to see why I think the bottom is in for the precious metals stocks. The right shoulder, of the inverse H&S bottom is finding support on the top blue rail of the downtrend channel, is more common than most realize.

This last chart for the HUI is a long term monthly look that shows the whole bull market from the big complex H&S base to our most recent consolidation pattern, a potential bullish rising wedge halfway pattern. I have taken alot of flack in the past for showing a rising wedge as a bullish  consolidation pattern but they are no different than any other consolidation pattern. If they breakout to the upside its a consolidation pattern regardless of what the rules say. Also the expanding rising and falling wedges are another pattern that most chartists miss because they are not in the book of Technical Analysis. Notice where our current inverse H&S bottom is forming, right at the 4th reversal point of the bullish rising wedge. The H&S is a reversal pattern that was needed to reverse the latest downtrend and to put in a 4th reversal point for the big blue bullish halfway pattern. Notice how much bigger the bullish rising wedge is compared to all the other consolidation patterns in red. This is a huge consolidation pattern and has been in consolidation mode since the 2008 H&S top. Big consolidation pattern equals big moves.

As the precious metals stocks are showing some bottoming action lets take a look at Silver and see if it is confirming a bottom also. This daily chart shows a nice inverse H&S bottom that has already broken out to the upside three days ago with some backtesting already taking place. The price objective is to the previous high at the 35 area.

The last chart I would like to show you is a long term look at gold that is showing a parabolic curve taking shape. If the PM stock indexes are bottoming and silver is bottoming then gold should also show a bottom. If you look at the last bar on the top right hand side of this monthly chart you can see that bar is finding support at the last uptrend rail of the parabolic rise.

From a chartology perspective there is alot of evidence that is suggesting the precious metals complex has bottomed. I know thats is a strong statement to make but that is what the charts are suggesting to me right now. The last monthly chart above is showing gold on the launch pad with the breakout and backtest of the blue triangle finishing up on the bottom black rail of the parabolic uptrend arc. This is the 5th large consolidation pattern for the 12 year bull market that is suggesting a multiple year rally lies just ahead of us.  The chartology shows 3 different methodologies used for analyzing the charts above that don’t show up in most text books.  The neckline symmetry rail, the expanding rising and falling wedges and the bullish rising wedge. Its a little unconventional but whatever it takes to see the picture the charts are trying to show us is what its all about.   All the best….Rambus.
………………

EDITOR’S NOTE :
Rambus Chartology is Primarily a Goldbug TA Site where you can watch Rambus follow the markets on a daily basis and learn a great deal of Hands on Chartology from Rambus Tutorials and Question and Answeres .
Most Members are Staunch Goldbugs who have seen Rambus in action from the 2007 to 2008 period at www.goldtent.org and now Here at Rambus Chartology since early 2012 .
To review his Work and incredible calls from the 2007-2008 period click on the top right sidebar in the “Wizard of Rambus” ….”What If !!” Post
To Follow Rambus Unique Unbiased Chart Work and participate in a Chartology Form with questions and answeres and learn the Art and Science and Mindset of a Pro Trader please Join us by subscribing monthly for $29.99 at
www.rambus1.com
We have many subscribers from all over the world who are glad they did as they enjoy the many daily updates and commentaries provided at this exciting new site
As you will see Rambus (Dave) has prepared us for this difficult period by being one of the only ones to see and warn about the incredibly debilitating PM smackdown as early as Jan 2 2012 …click on the” HUI Diamond in the Rough” Post in the “Wizard of Rambus” top right
More Recently Rambus called a Bottom in HUI in this post…and has had subscribers on board for a Powerful Run to the Upside
rambus1.com/?p=5651
BUT
What is he seeing Now ?
You will find Rambus to be a calm humble down home country tutor with an incredible repitoir of all the TA based protocols tempered with his own one of a kind style…simply put…He wants to keep his subscribers on the right side of these crazy volitile and downright dangerous markets
See you at the Rambus Chartology
www.rambus1.com

Weekend Report…Gold Versus Everything ! (Gold Ratio Chartology)

In this weekend report I would like to look at some ratio charts that compare gold to many different areas of the markets. If gold is going to lead the the charge I would like to see it rally against just about everything.

This is  where ratio charts come into play. The first set of charts I would like to show you is comparing gold to some of the different stock markets. These monthly charts go back to the beginning of the bull maket for gold, that shows without a shadow of a doubt, gold has significantly outperformed the stock market as the charts below show. There are periods when gold has consolidated its run up against the stock markets but it has not lost much ground through it’s 12 year bull market run relative to the stock markets.

The first monthly chart I would like to show you compares gold to the  INDU. When this ratio is rising gold is outperforming the  Dow Jones. You can see the nice inverse H&S bottom that formed back in the 2000 timeframe. That was the base that launched gold against the Dow that had been in one of the strongest bull markets of all time. As you can see the ratio chart has been rising in a very bullish fashion that shows the first big pattern to form out of the inverse H&S base was big blue bullish rising wedge. That big blue bullish rising wedge was made up of several smaller red consolidation patterns. The top blue consolitation pattern is showing another bullish rising pattern that is forming it’s 4th reversal point. Keep in mind this is a monthly chart and changes are gradual.

Gold to the SPX shows a very similar setup to the ratio chart above. As you can see this ratio chart is trying to put in its 4th reversal point where the current price action is now trading. This is where gold and the stock markets might start to part ways. We just need to see this ratio start to rise and the steeper the rise the faster gold is outperfoming the SPX.

Lets compare gold to one more stock market that has been a little weaker than the Dow and SPX. Again you can see another bullish rising wedge that is bouncing off the bottom rail. What these ratio charts are showing you is that we could be very well at an inflection point where  gold really starts to outperform the stock markets in a big way. That can happen in one of two ways. The first way is that gold and the stock markets go up together but gold goes up much faster causing the ratio to rise moderately. The other way is for gold to rally and the stock markets fall which would cause a near vertical move in the ratio.

The ratio charts  above shows gold outperforming the stock market in a big way and is possibly getting ready to accelerate it’s move. These next set of charts shows how gold is performing against a basket of commodities by looking at the gold to the CCI index. The first thing that will jump out at you is the massive 20 year inverse H&S bottom that finally broke out in 2008. You can see the pretty blue bull flag that formed on top of the  neckline as the backtest. Since the breakout of the blue bull flag this ratio chart is putting in another bullish consolidation pattern, a red triangle that is nearing completion. A breakout of the red triangle will probably lead to a vertical move where gold is really outperforming a basket of commodities.

Lets look at a very long term ratio chart that compares gold to the old  CRB index. The chart below shows a massively long term 25 year bullish falling wedge. Please note the vertical move once the top rail was broken to the upside. That built up energy, once released, signaled gold was entering a brand new bull market against a basket of commodities. Notice the smaller blue bullish rising flag that broke out to the upside back in July in 2011. The price action has been consolidating on top of the blue bullish rising flag as another bullish rising pattern, the red bullish rising wedge, that is just now starting to breakout.

Lets now compare gold to the WTIC, oil index. This long term chart shows another massively large inverse H&S bottom. The head portion is comprised of a 5 point bullish falling wedge reversal pattern. You can see there is some pretty nice symmetry taking place on the left and right side of the chart that is showing a left and right shoulder. Notice how vertical the move was on the breakout of the 5 point bullish falling wedge. That is what a breakout looks like after being confined in a narrowing trading range for so long. All the energy is released and a vertical move follows. This chart shows that this ratio should be bullish for the precious metals producers as their cost of fuel is falling as the price of the precious metals is rising.

Lets now compare gold to silver to see how this ratio has been playing out over the very long term. You can see this ratio formed a very large rectangle that took about 11 years to complete. It finally broke down through the bottom rail when in 2011 silver had its massive bull maket run up to the 50 area. Once the move was over, the countertrend rally took the ratio back up to the center dashed rail of the recangle, that often times signals the counter trend move is over. Then a resumption of the primary trend is back in force, in this case backdown. I think before this bull market is over the gold to silver ratio will fall below the 20 area.

This next chart compares gold to the XAU that shows you how undervauled the precious metals stocks are compared to gold. After finally peaking out at an all time high back in August of this year the ratio formed a small double top. It now looks like the ratio is in the process of backtesting the breakout from the double top hump at 9.84. This is a critical backtest taking place right now. If the backtest is successful then all the work should be done and the XAU should start outperforming gold with the ratio falling.

The last ratio chart I would like to show you is the TLT to GLD ratio chart. The TLT is the 20 year bond and when you make a ratio chart that compares the TLT to gold it can show you which direction gold may travel. Below is a combo chart with the TLT to Gold ratio on top and GLD on the bottom. It clearly shows when the ratio is falling gold is rising and when the ratio is rising gold is falling. There is an interesting setup taking place right now with the ratio chart on the top forming a bearish rising wedge and gold itself is forming a triangle consolidation pattern. They have both broken out of their respective patterns and are in the proccess of doing the backtest move. Once the backtest is complete gold should be ready to rise to new highs.

What these long term ratio charts are telling us is that gold is at an inflection point with just about everything related to the markets. This is a good setup for gold right now if it can break free from all those consolidation patterns that I have shown you above. I think it can win the Academy Award for best performance of an asset class at the next awards ceremony. All the best…Rambus
……………………

For More Rambus

www.rambus1.com
………………….
Site Features

http://rambus1.com/?p=7483