Wednesday Stock Report…DOLLAR DRAMA …and Why you should Care !

Its been a slow day so I thought I would get the Wednesday stock report finished early.

In this Wednesday stock report I would like to look at the US Dollar, as it plays a very important role to the big overall picture regarding so many markets. A strong dollar usually means a weak stock market or commodities. Its possible that the stock markets or commodities can move in the same direction of the dollar but in general they move in the opposite direction. So getting the big overall picture right for the US dollar helps us understand what we are up against in regards to the other markets.

Lets start with the daily look to see what has transpired over the last 10 months or so. The dollar carved out a six point symmetrical triangle consolidation pattern in the first part of this year. If you remember the last reversal point, #6, was a little tricky when it broke down slightly below point #4. That was a little false move that paved the way for the big rally that followed.  There is a possible bull flag that has been forming over last two weeks or so. It will either be a bull flag halfway pattern or the start of a bigger consolidation pattern that will chop around to the right side of the chart. If the dollar can take out the previous high then there is a good chance the red bull flag is the correct pattern.  If it fails we might see a triangle or rectangle or some other consolidation pattern form. Something to keep a close eye on.

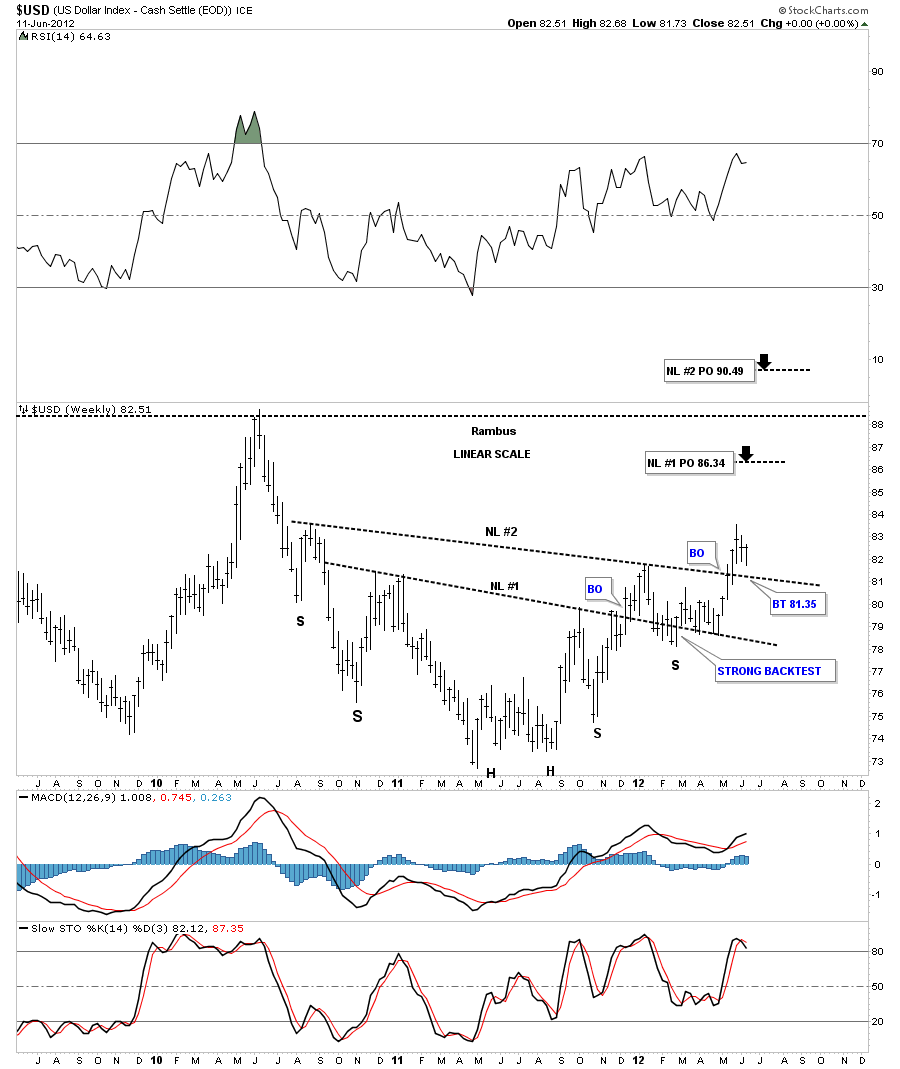
The weekly chart is the look to pay close attention to. I’ve been showing this inverse H&S base before we broke through neckline #1. As you can see on the chart below the backtest to neckline #1 was a long drawn out affair that planted a seed of doubt when the price action  dropped slightly below the neckline. Notice how the neckline came back into play, as support, once the price action got back above. For the last two months, after the strong backtest, the neckline never failed again and held support until the move higher began.

Also on the chart above you can see where the dollar has formed another inverse H&S bottom, neckline #2. The possible red bull flag that I showed you on the daily chart is part of the backtest to neckline #2. A complete backtest to neckline #2 would come in at 81.35.

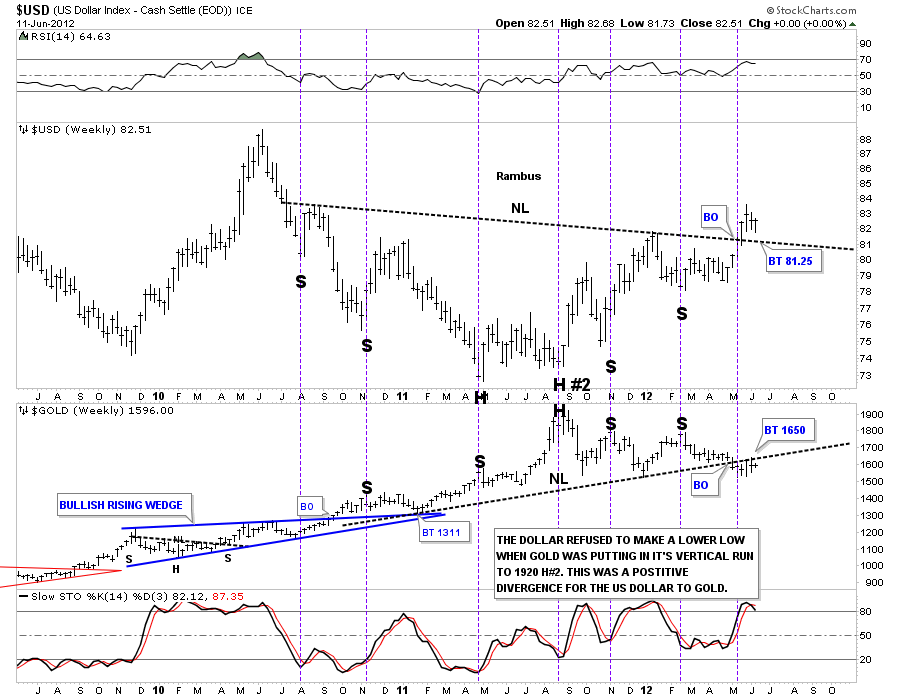
The next chart I would like to show you is a weekly combo chart with gold on top and the us dollar on the bottom. There are several important points on this chart that are worth noting. First you can see the big inverse H&S bottom on the dollar chart that matches fairly close the big H&S top on gold. You can see they both broke through their respective necklines about four weeks ago. They are both in the process of backtesting those necklines.

The other important feature on the chart above is where I have labeled H #2 on the dollar chart. That is the point where the dollar made a slightly higher low while gold was going near parabolic to it’s 1920 all time high. By the dollar not making a lower low at that point, while gold was making a much higher high, that setup a positive divergence for the dollar to gold. That was a strong inflection point for both the dollar and gold. As you can see on the chart above the dollar has been in a strong uptrend while gold has been trending lower.

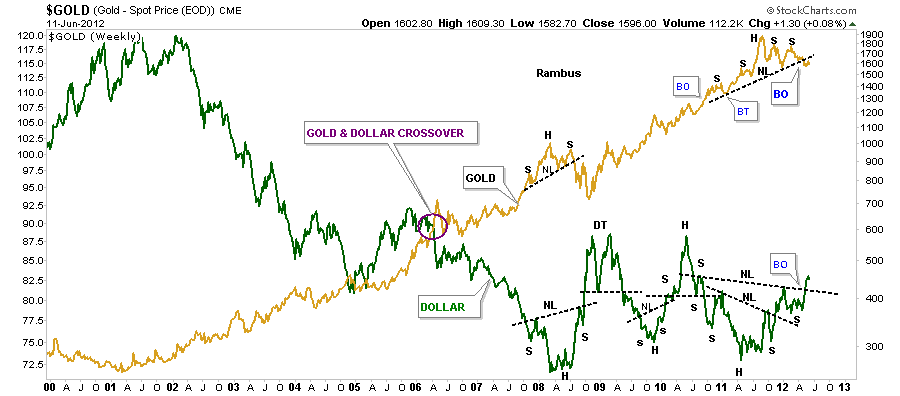
The next chart is a weekly line chart where I put the US dollar behind the gold price so you can see how they interact with each other. In April of 2006 is when gold crossed up and over the dollar and never looked back. What is obvious is that gold has been in a huge bull market as the dollar has been in a bear market. Since the dollar hit it’s low in 2008 it’s been chopping out to the right side of the chart failing to make lower lows as gold was making one high after another. What I find interesting right now is gold looks like it has a H&S top in place while the dollar has a H&S bottom. It will be interesting to see if the two start to trade back toward each other and close the huge gap that is as big as the large gap from the 2001 – 2002 period. One thing is obvious and that is the dollar has refused to make new bear market lows since 2008.

Understanding what the dollar is doing is critical to understanding the big picture. So far the dollar has been following the charts I’ve presented pretty close. If the backtest to NL #2 at 81.35 is successful then the dollar is headed much higher putting pressure on most markets. All the best…Rambus


…………………….

EDITOR’S NOTE :
Rambus Chartology is Primarily a Goldbug TA Site where you can watch Rambus follow the markets on a daily basis and learn a great deal of Hands on Chartology from Rambus Tutorials and Question and Answeres .
Most Members are Staunch Goldbugs who have seen Rambus in action from the 2007 to 2008 period at www.goldtent.org and now Here at Rambus Chartology since early 2012 .
To review his Work and incredible calls from the 2007-2008 period click on the top right sidebar in the “Wizard of Rambus” ….”What If !!” Post
To Follow Rambus Unique Unbiased Chart Work and participate in a Chartology Form with questions and answeres and learn the Art and Science and Mindset of a Pro Trader please Join us by subscribing monthly for $29.99 at
www.rambus1.com
We have many subscribers from all over the world who are glad they did as they enjoy the many daily updates and commentaries provided at this exciting new site
As you will see Rambus (Dave) has prepared us for this difficult period by being one of the only ones to see and warn about this incredibly debilitating PM smackdown as early as Jan 2 2012 …click on the” HUI Diamond in the Rough” Post in the “Wizard of Rambus” top right
You will find Rambus to be a calm humble down home country tutor with an incredible repitoir of all the TA based protocols tempered with his own one of a kind style…simply put…He wants to keep his subscribers on the right side of these crazy volitile and downright dangerous markets
See you at the Rambus Chartology

Weekend Report…Big Cap PM Stocks

In this weekend report I want to take a look at some of the big cap precious metals stocks that help make up the HUI, XAU and the GDX. What we’re basically doing is looking under the hood of the big cap PM indexes to see  what the individual components look like. By doing this we can see where these individual stocks are since topping out over the last one to two years. Big tops need time and price to reset sentiment. There are two ways to get back to oversold condition. First you can have a long drawn affair that takes alot of time to bring the price back down to oversold readings. The second way would be similar to the 2008 crash in the PM stocks that only took 3 or 4 months to get everything washed out so a new leg could begin.

The charts I’m going to show you tonight will be a weekly line chart that  takes the weekly close and adds the next weeks close to it to get your line. Line charts can sometimes show nice clear chart patterns that are hard to detect on a bar chart that may have some big price spikes.  A pattern may show up on a line chart that you didn’t see on a bar chart and vise versa. Using both bar charts and line charts can give one a much clearer interpretation of what is really going on when a stock starts chopping out a chart pattern.

Lets look at the HUI first, on a weekly line chart, so you can see the clear 18 month or so H&S top formation. From just a common sense symmetrical look it doesn’t look like the HUI has put in near enough time in relationship to the big H&S top formation. I think we could be in a more drawn out type decline that will take time to play out by moving 2 steps down and one step up like we are seeing right now. Notice the 2008 H&S top that didn’t waste any time going down once the neckline was broken to the downside.

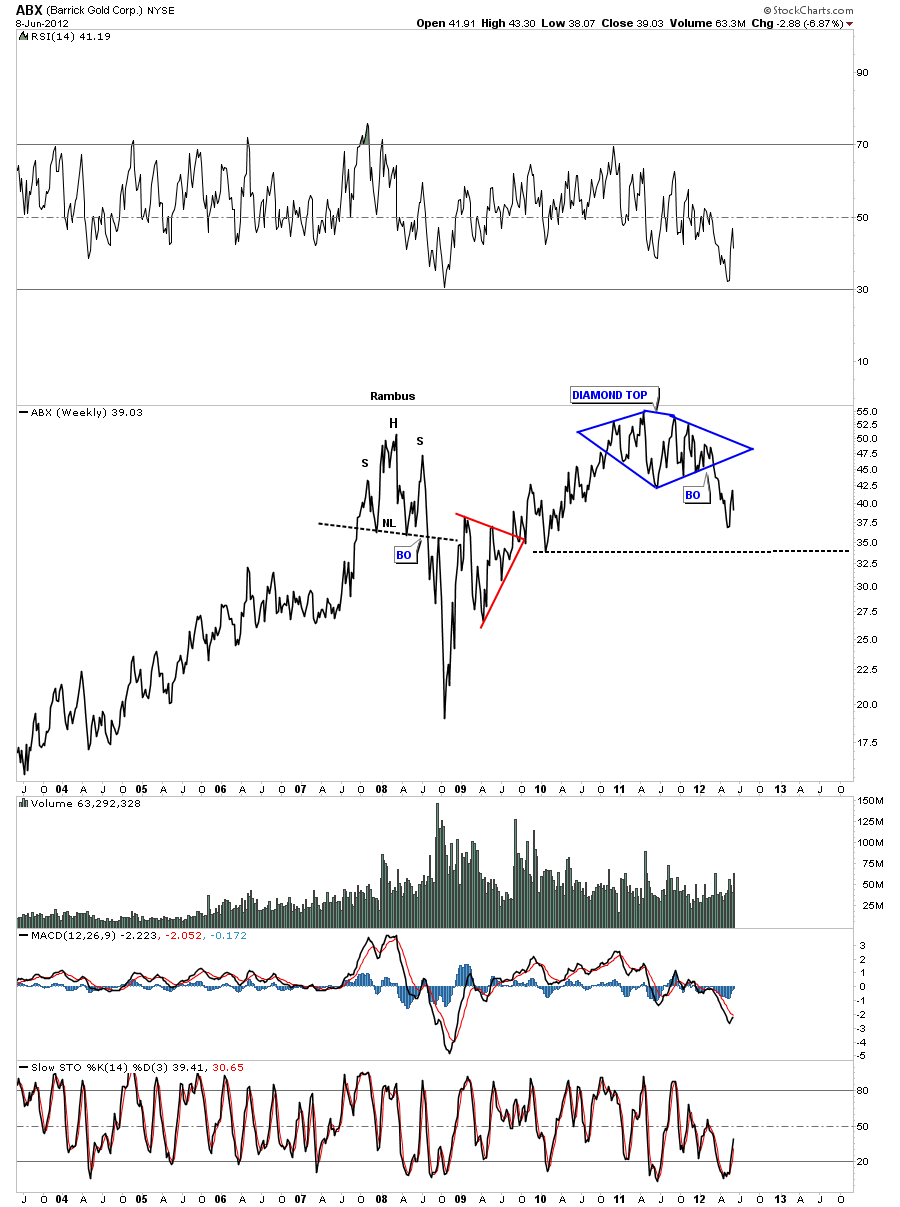
Lets now look at some big cap precious metals stocks on a weekly line chart and see what they look like. ABX has a big diamond top in place. Note the bottom blue up sloping rail of the diamond and how the price action dropped in a vertical fashion once it was broken to the downside. That’s what a breakout looks like.

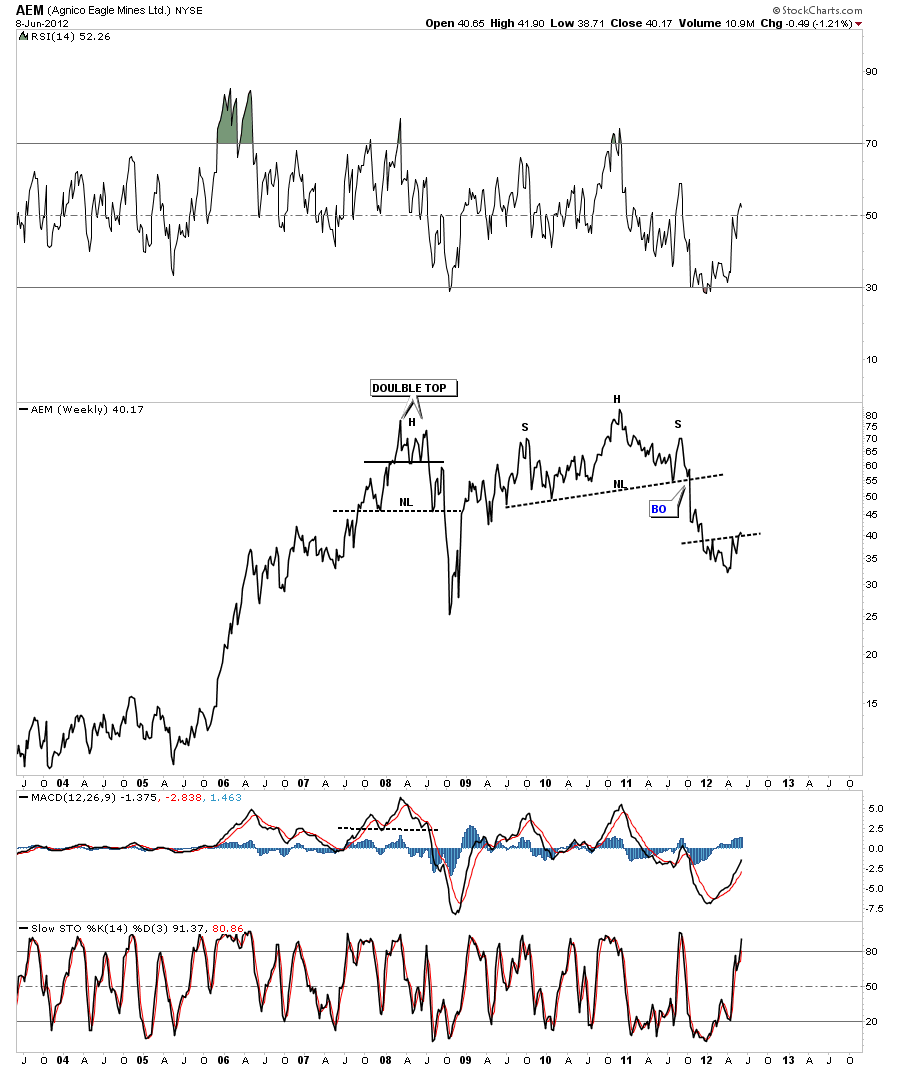
AEM was one of the first PM stocks to break down from it’s H&S top formation.

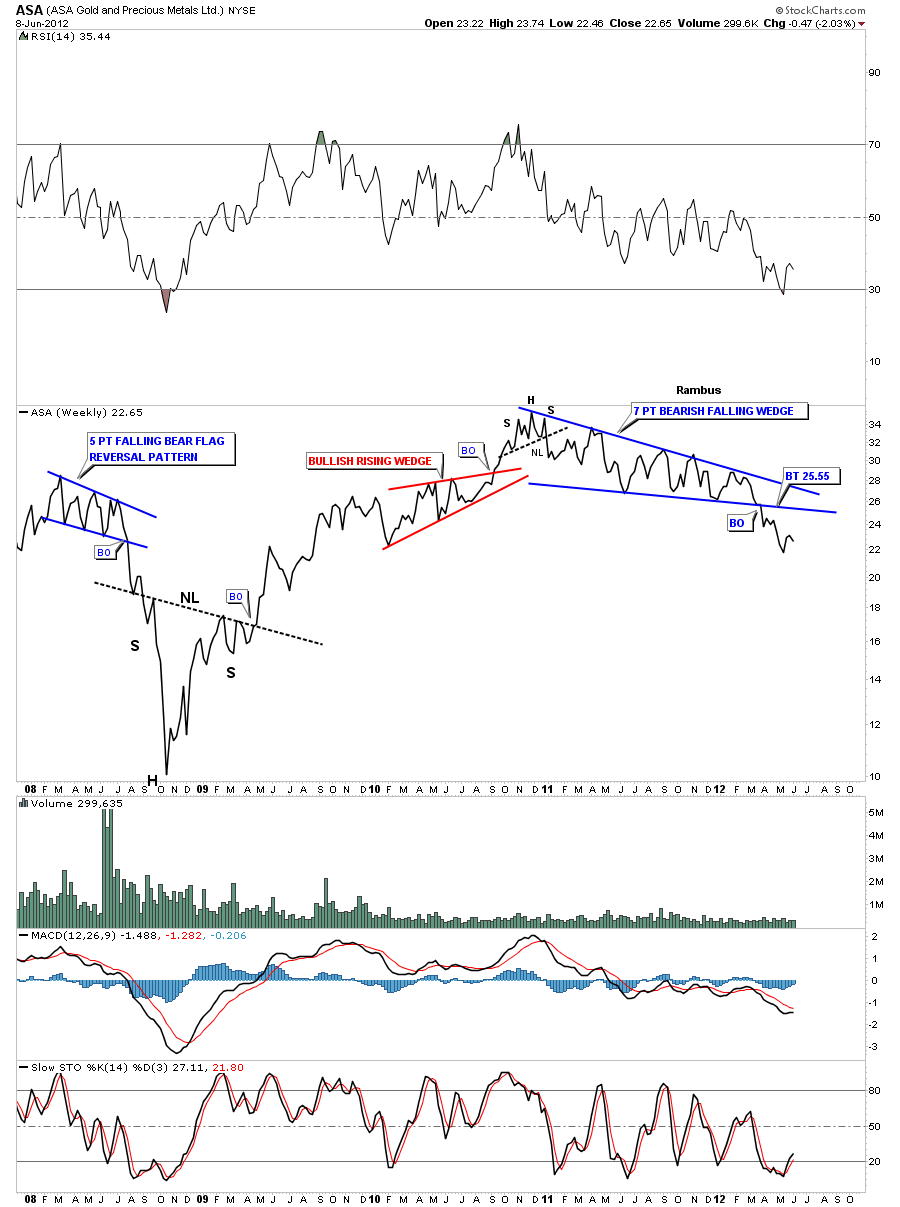
ASA topped out at the end of 2010 & 2011 with just a small H&S top pattern. The real pattern that is talking to us is the 7 point bearish falling wedge that broke through the bottom rail in the middle of March of this year.

AU has a diamond top in place. Note the bottom blue rail and how it supported the price action until it finally was broken to the downside. There were no more bulls left to buy the bottom rail so you get a breakout that is vertical in nature. On the weekly bar chart you can see a beautiful H&S top formation.

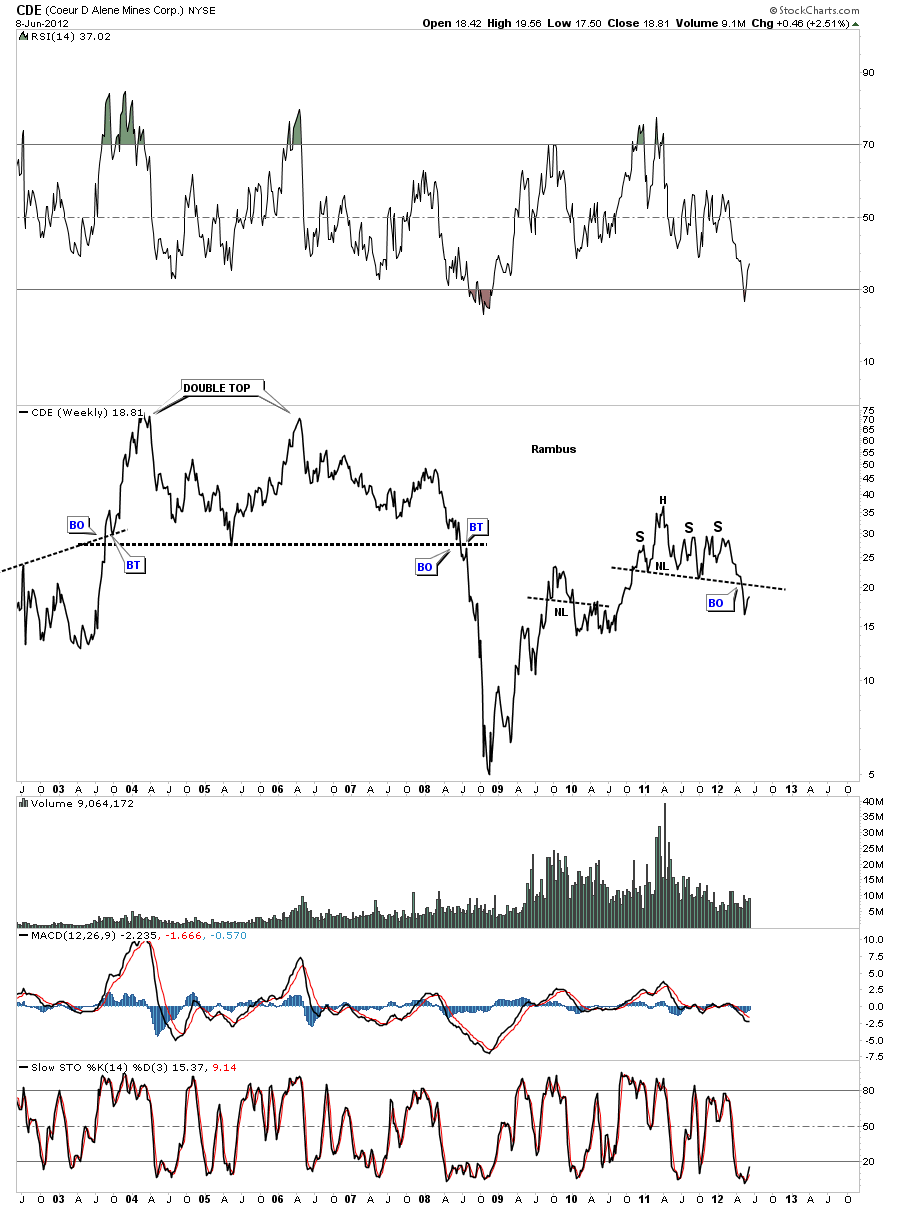
CDE has an unbalanced H&S top in place.

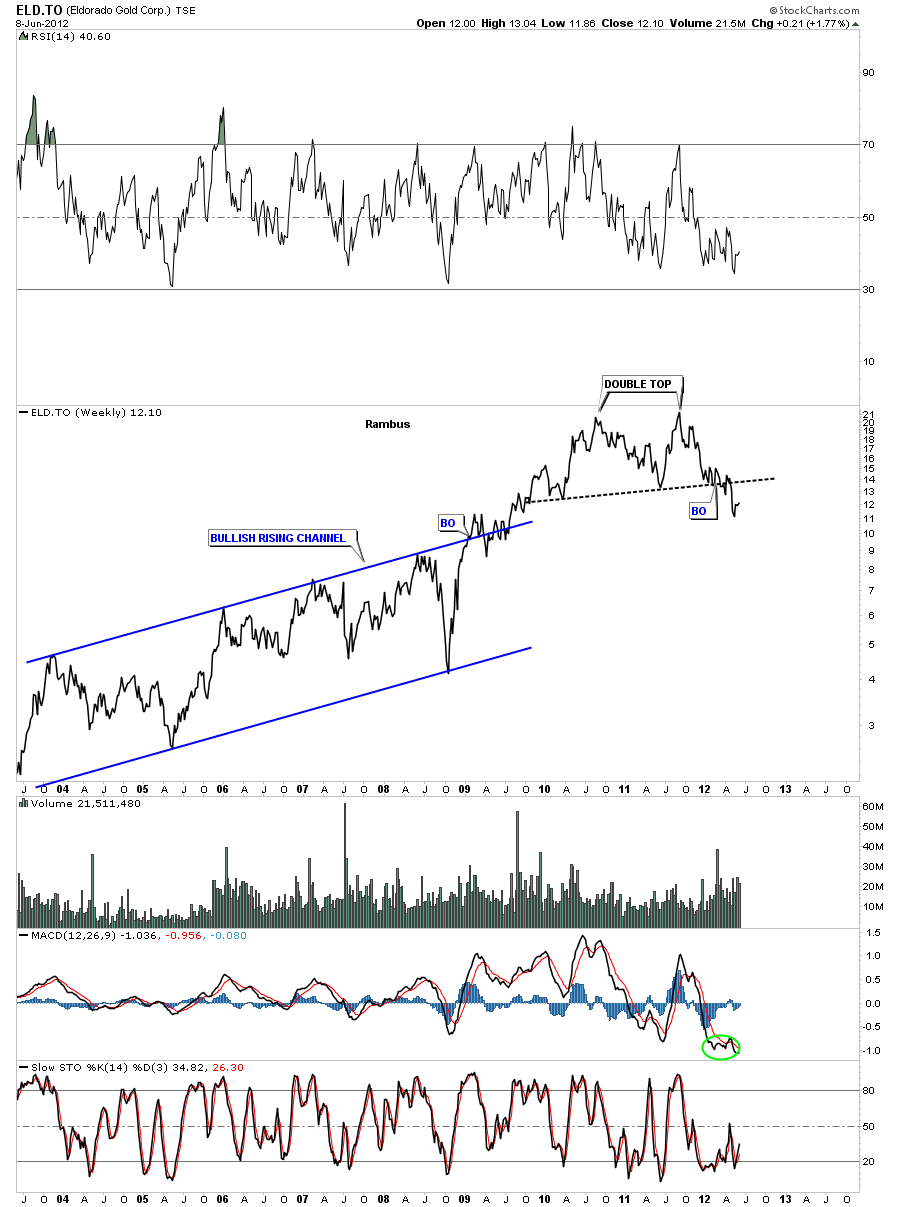
ELD.TO has a double top in place. You could make a case for a H&S top also but the bottom line is, the dashed black rail that is your support and resistance rail. That goes for all the charts I’m showing.  Regardless of what pattens are above the black dashed rails its the dashed black rails or the support and resistance rails that count. Just think of them as support rails turning into resistance rails once they are broken.

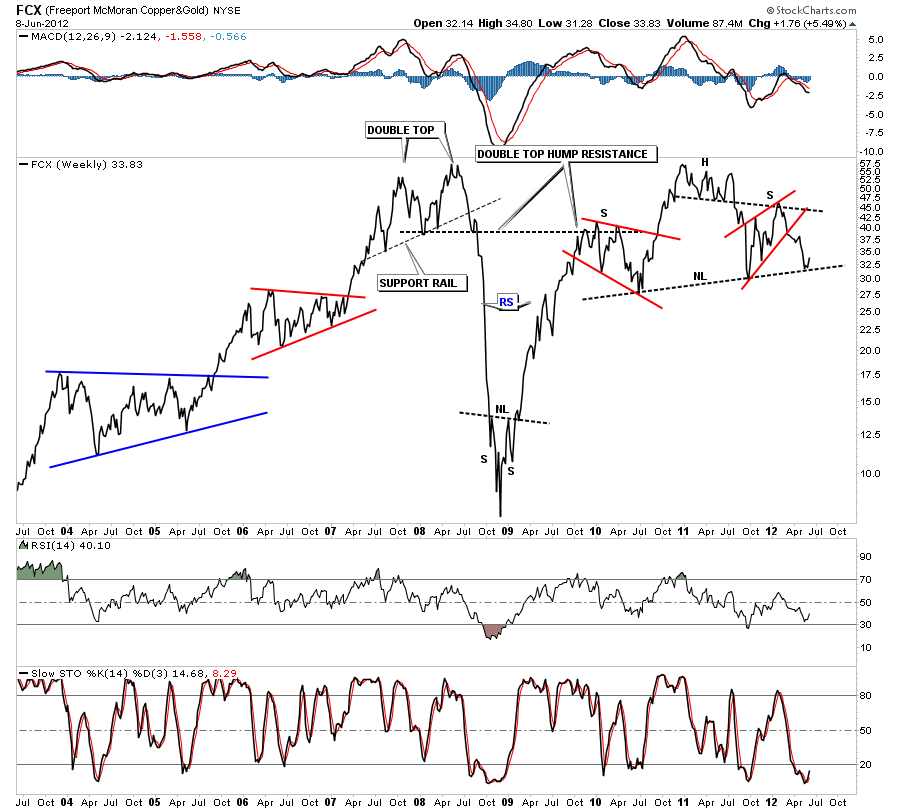
FCX has a beautiful H&S top pattern in place but is still trading above the all important neckline. Note the end of the chart and the little bounce we are getting off the neckline. That little bounce is telling us that neckline is hot and when it gets broken to the downside it will then reveres it’s role and act as resistance on any backtest.

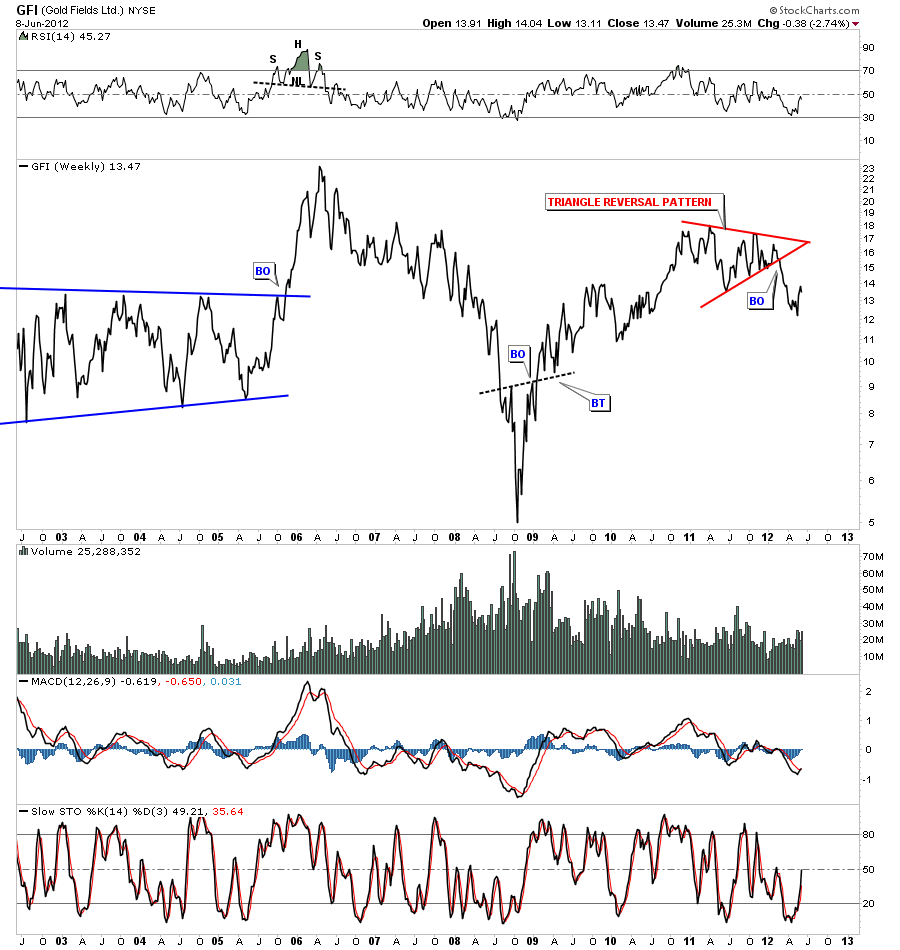
GFI has a triangle reversal pattern as it’s top. Again notice the bottom red rail of the triangle and how it held support and then once broken prices fell in a near vertical move until it can find some support.

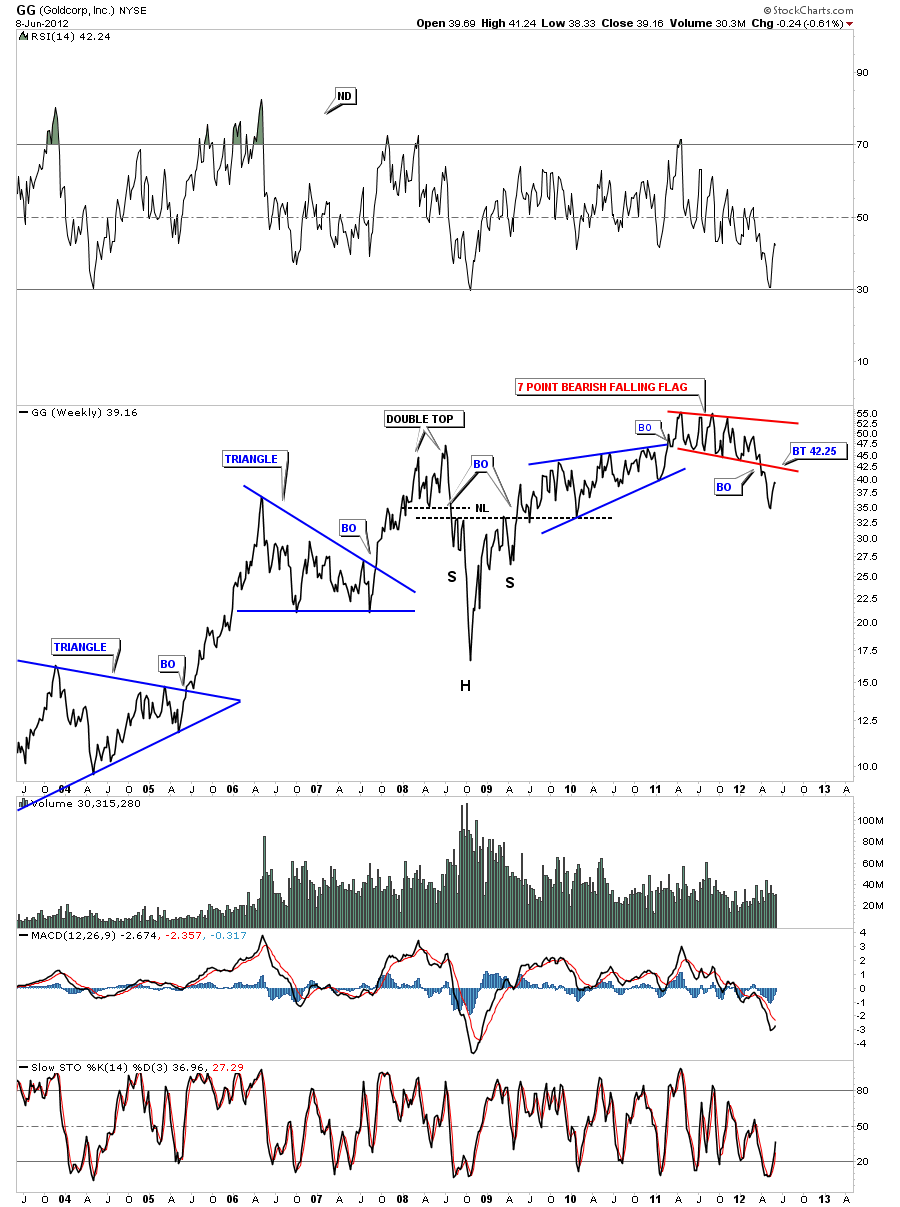
GG has a 7 point bearish falling flag in place. It got to within a point or so of doing a complete backtest this past week at 42.25.

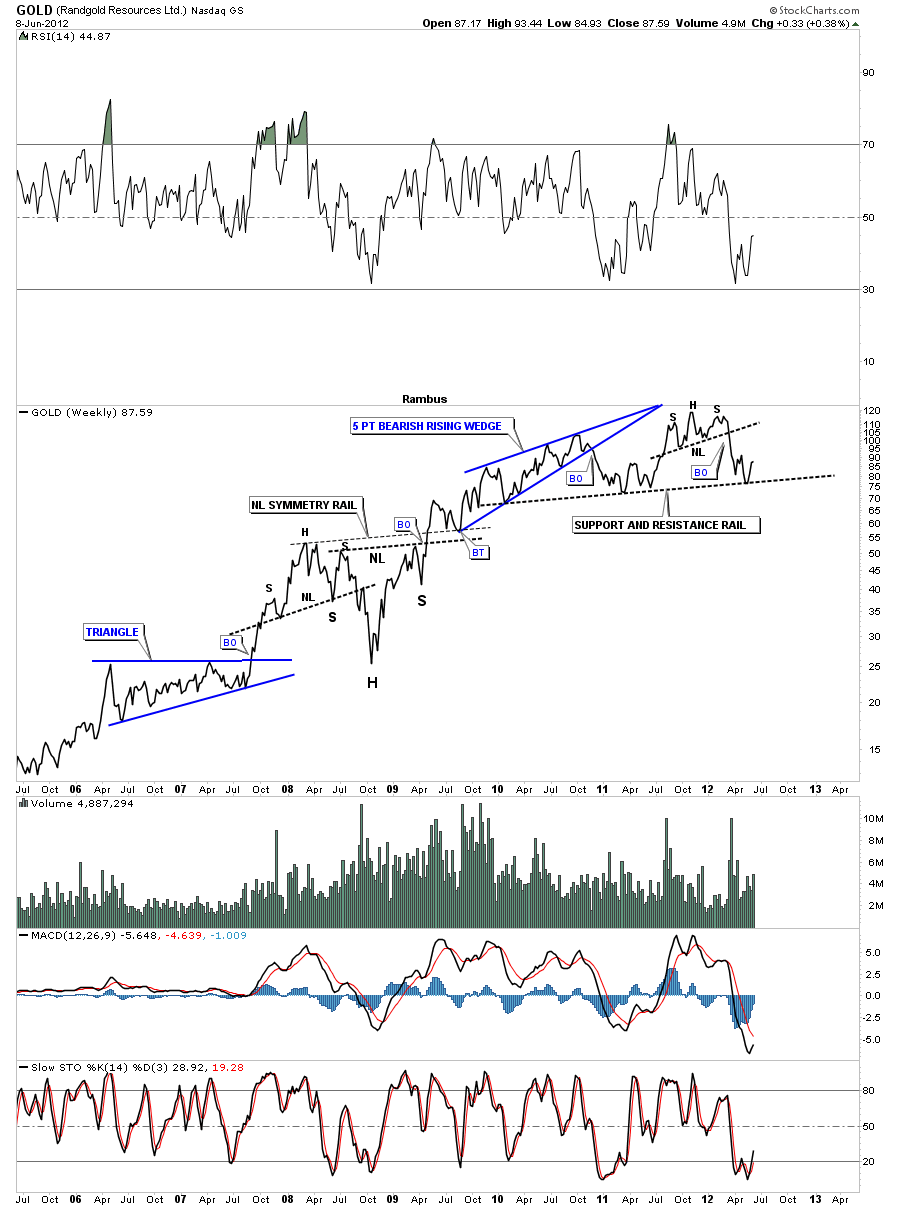
Gold, Randgold, is bouncing off it’s support and resistance rail. Note the small H&S top that started this latest move down. This stock could be building out a bigger H&S top formation before its all said and done.

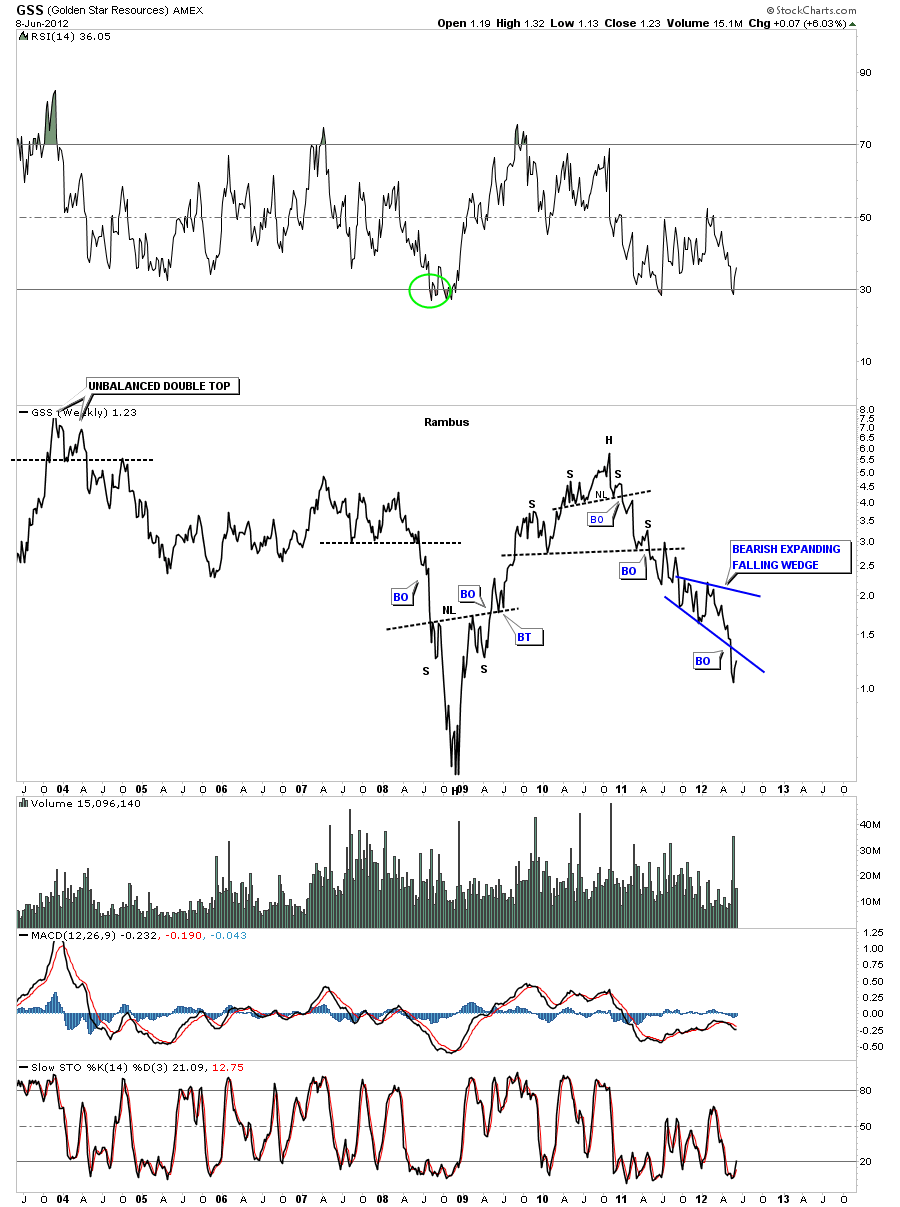
GSS built a H&S top and more recently broke out of a bearish expanding falling wedge consolidation pattern.

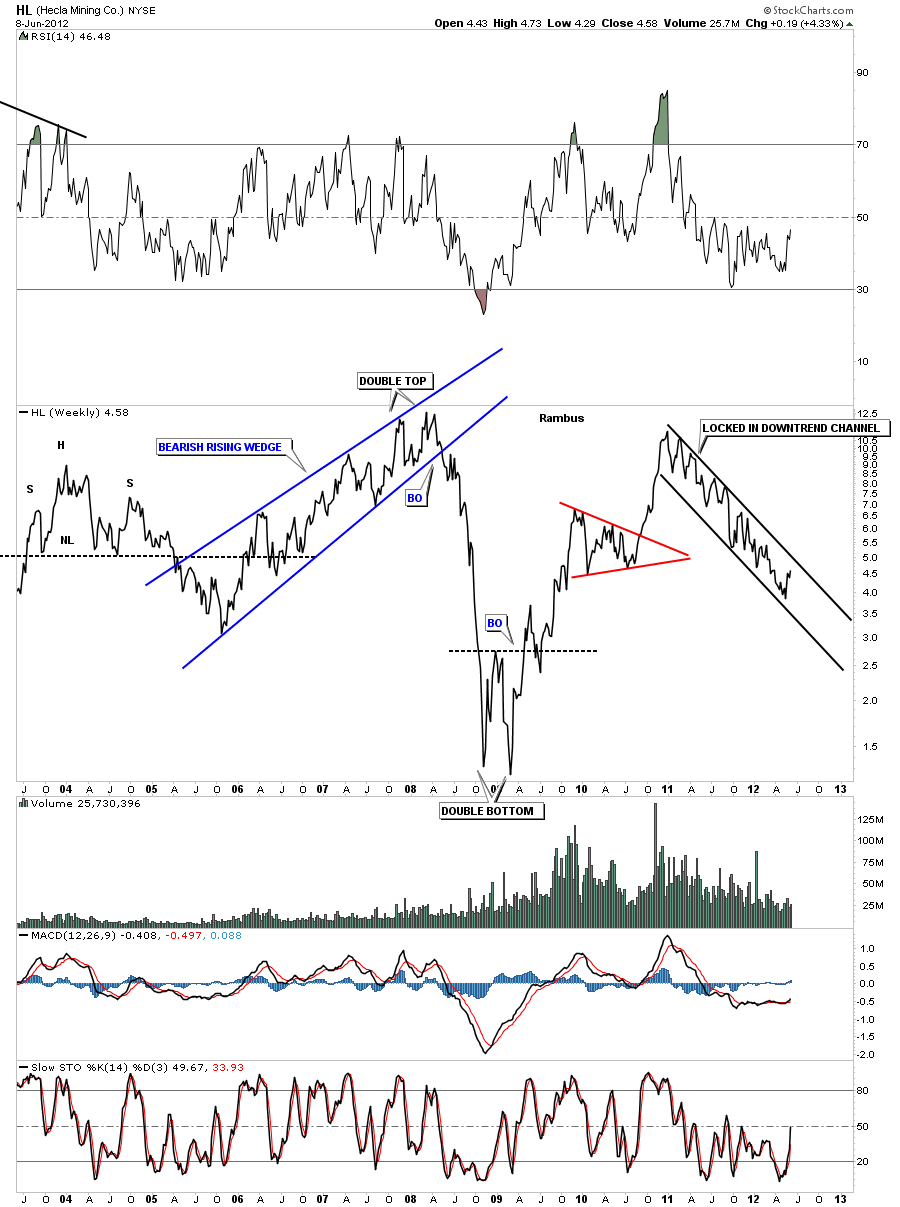
HL has been locked in a downtrend channel for well over a year now. Anyone trying to pick a bottom in this stock has been disappointed so far.

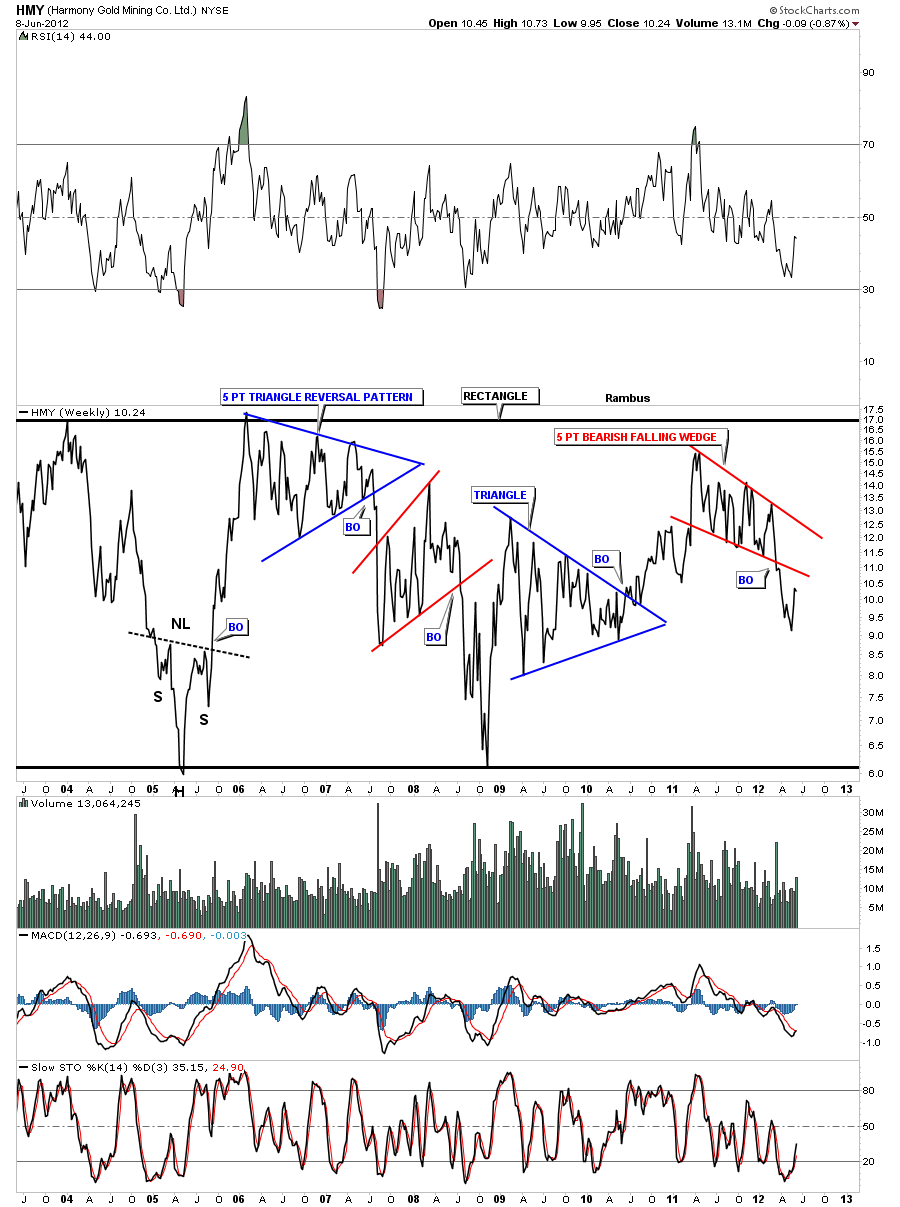
HMY has a 5 point bearish falling wedge that has broken down.

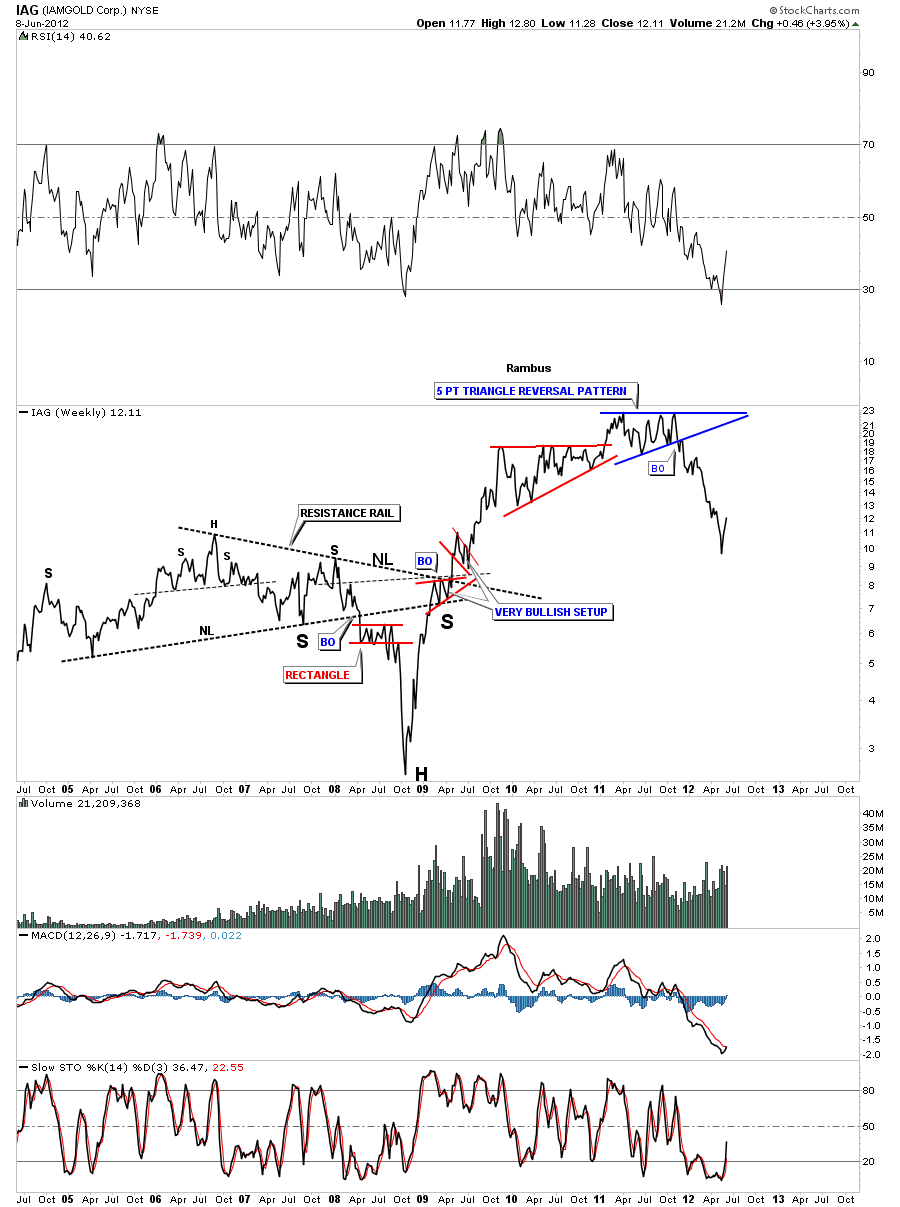
IAG had a 5 point triangle reversal pattern for it’s top. It wasted little time in falling to it’s most recent lows where it may start to form some type of consolidation pattern.

NEM has a small H&S top in place but the real pattern is the expanding uptrend channel. Note the price action once the bottom blue rail of the expanding channel gave way.

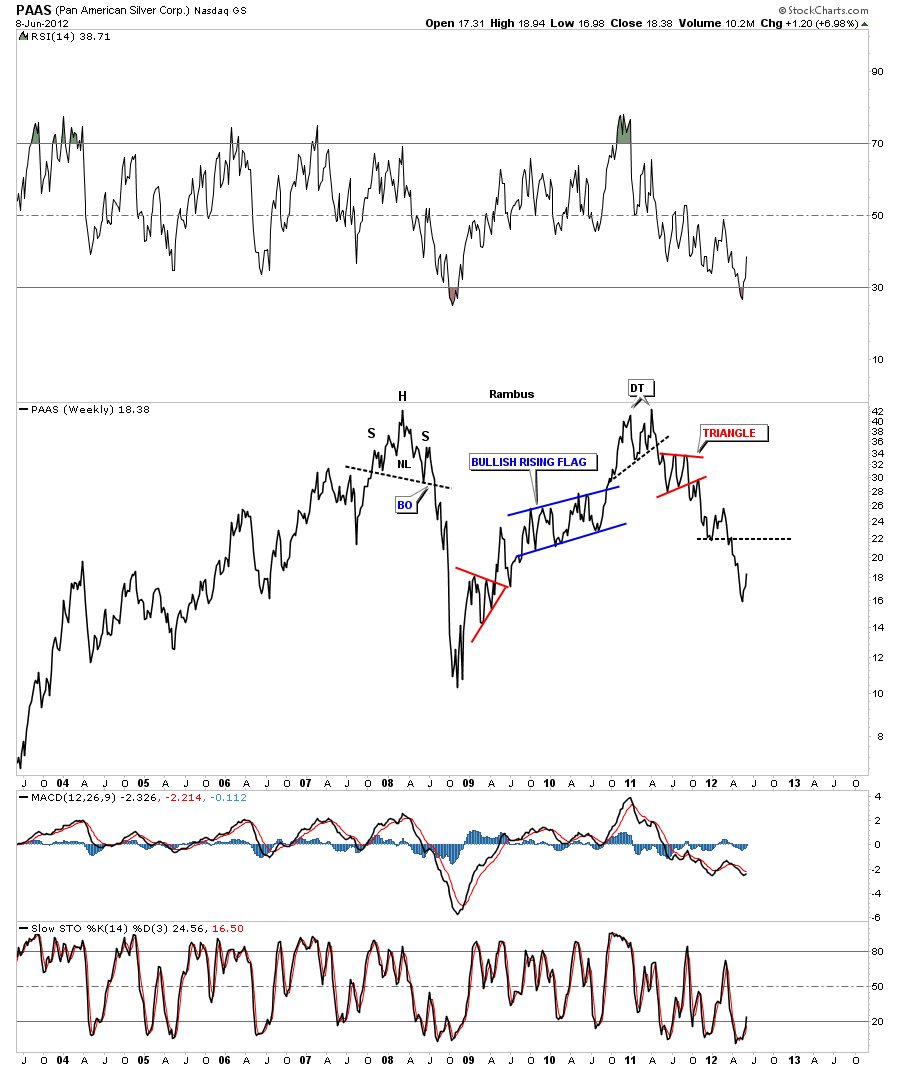
PAAS was one of the PM stocks that broke out earlier than the rest. It had a small double top that started the decline you see on the chart below.

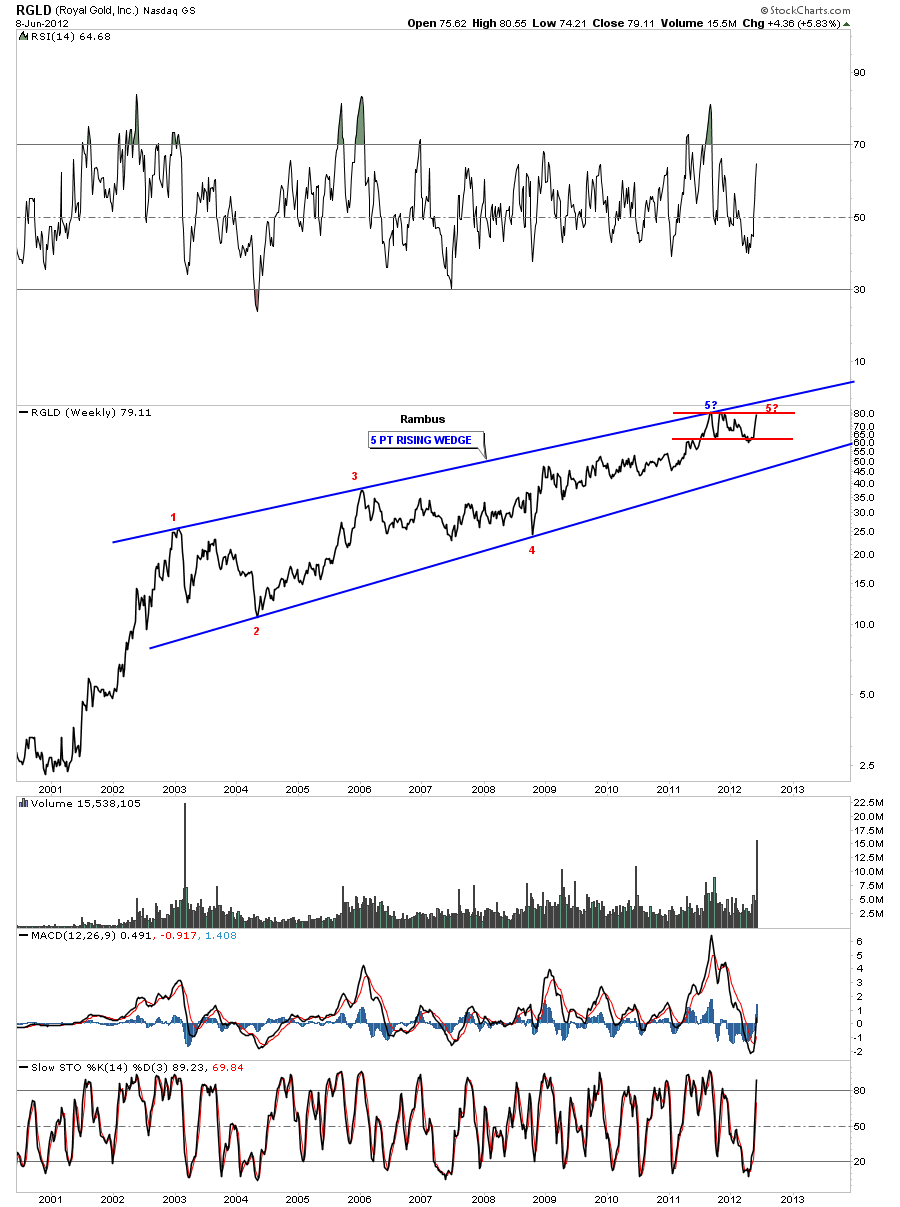
RGLD has been one of the stronger PM stocks. It has an interesting setup as there are 5 reversal points in the big blue rising wedge and we now are working on a possible 5th reversal point on the red rectangle. If RGLD can take out the top blue rail that would be a very positive development.

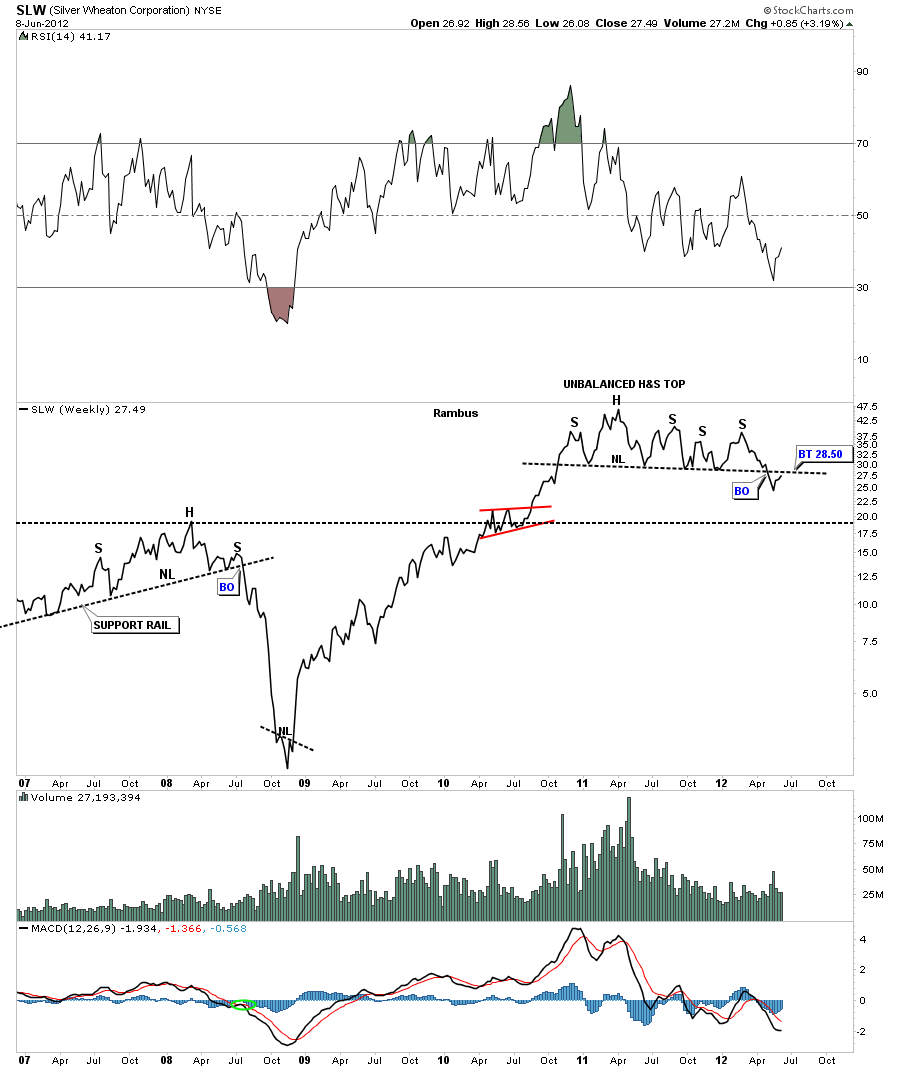
SLW is showing an unbalanced H&S top in place. It’s in the process of backtesting the neckline at 28.50 on a weekly closing basis. Note how many times the neckline was tested before the breakout came.

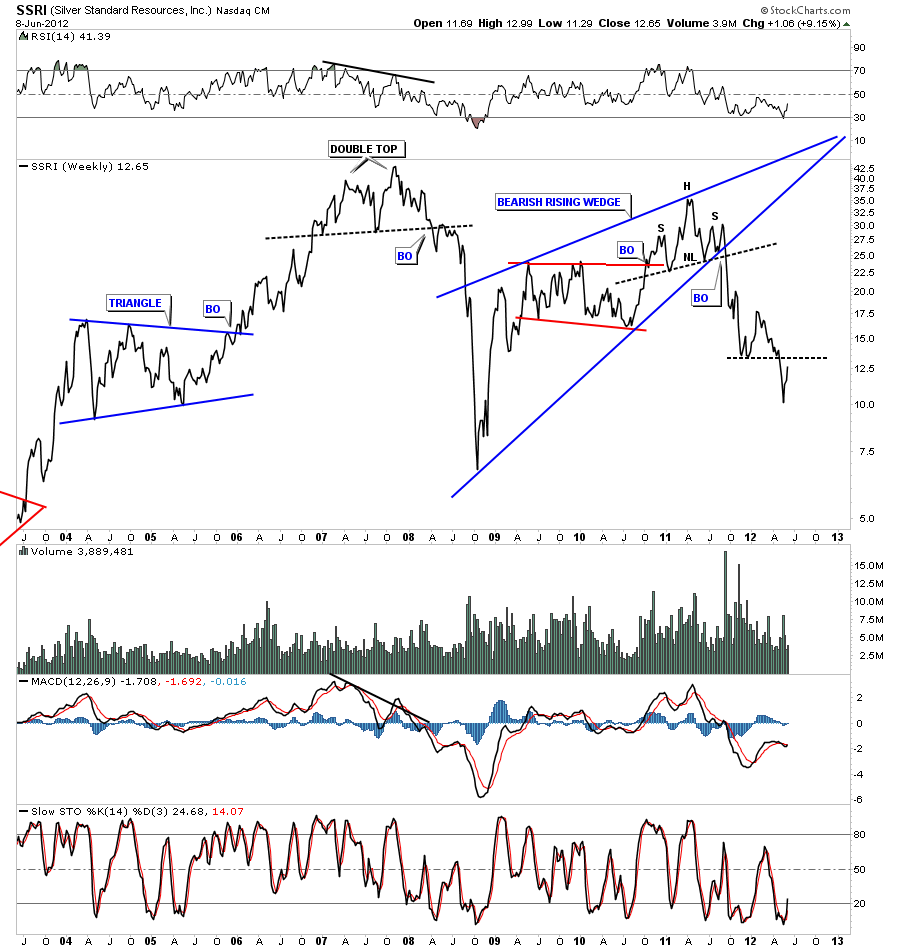
SSRI had a nice H&S top that was built at the apex of the big blue bearish rising wedge.

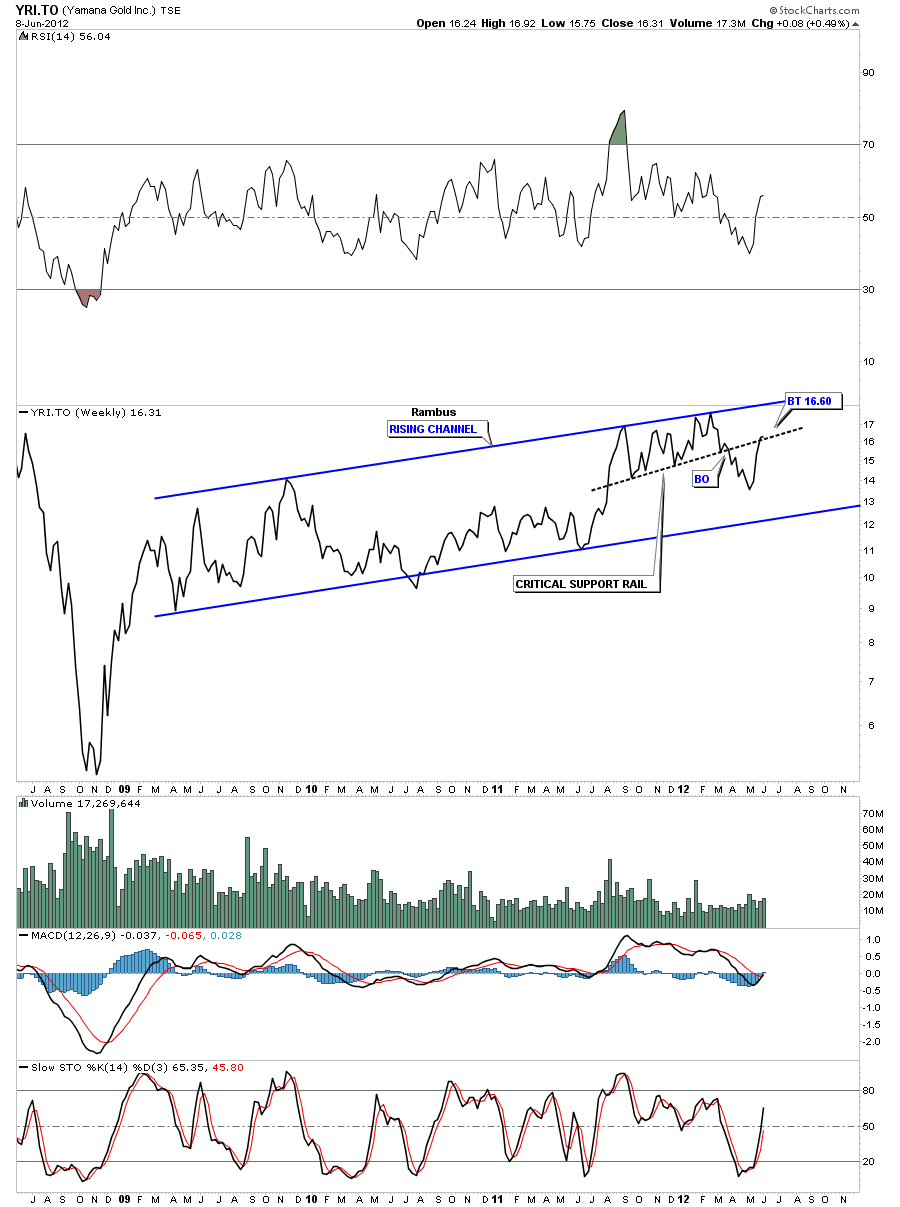
Lets look at one more chart. YRI.TO that has been one of the stronger PM stocks. Notice the black dashed rail that I have labeled as a critical support rail. Note how many times it was touched as support and now its having a critical backtest from the underside.

Now that we have looked under the hood of the precious metals indexes it looks to me like we still have alot of work to do before these stocks are ready to launch a major rally. I Know how hard hard it is to be on the sidelines right now waiting for the opportunity to buy the PM stocks but I can guarantee you that it would be more painful if you bought in and watched your favorite PM stock go against you. Cash is king right now and the opportunities will present themselves if we have patience. We had a successful backtest to the neckline, on the bar chart, this week for the HUI. We could still go up and test that big neckline several more times before its all said and done. As always I’ll be on the lookout for any bottoming formations to form from which the PM stocks could launch a major rally. As of right now we still seem to be in an impulse leg lower with some backing filling to be expected along the way.   All the best…Rambus

EDITOR’S NOTE :
Rambus Chartology is Primarily a Goldbug TA Site where you can watch Rambus follow the markets on a daily basis and learn a great deal of Hands on Chartology from Rambus Tutorials and Question and Answeres .
Most Members are Staunch Goldbugs who have seen Rambus in action from the 2007 to 2008 period at www.goldtent.org and now Here at Rambus Chartology since early 2012 .
To review his Work and incredible calls from the 2007-2008 period click on the top right sidebar in the “Wizard of Rambus” ….”What If !!” Post
To Follow Rambus Unique Unbiased Chart Work and participate in a Chartology Form with questions and answeres and learn the Art and Science and Mindset of a Pro Trader please Join us by subscribing monthly for $29.99 at
www.rambus1.com
We have many subscribers from all over the world who are glad they did as they enjoy the many daily updates and commentaries provided at this exciting new site
As you will see Rambus (Dave) has prepared us for this difficult period by being one of the only ones to see and warn about this incredibly debilitating PM smackdown as early as Jan 2 2012 …click on the” HUI Diamond in the Rough” Post in the “Wizard of Rambus” top right
You will find Rambus to be a calm humble down home country tutor with an incredible repitoir of all the TA based protocols tempered with his own one of a kind style…simply put…He wants to keep his subscribers on the right side of these crazy volitile and downright dangerous markets
See you at the Rambus Chartology
…………………….

All Subscribers

Note the new Category on the Sidebar

“Chartology Watch ”

Watch this space for important short term trade set ups and developing situations

currently

1….HUI Million Dollar Line

2….SLV Mother of all false Breakouts ?

3…Stock Market Developing Trade Set Up

and dont forget to choose the automatic e mail notification on the bottom of the sidebar to keep current in these wild markets

Whats Rambus Chartology ?

EDITOR’S NOTE :
Rambus Chartology is Primarily a Goldbug TA Site where you can watch Rambus follow the markets on a daily basis and learn a great deal of Hands on Chartology from Rambus Tutorials and Question and Answeres .
Most Members are Staunch Goldbugs who have seen Rambus in action from the 2007 to 2008 period at www.goldtent.org and now Here at Rambus Chartology since early 2012 .
To review his Work and incredible calls from the 2007-2008 period click on the top right sidebar in the “Wizard of Rambus” ….”What If !!” Post
To Follow Rambus Unique Unbiased Chart Work and participate in a Chartology Form with questions and answeres and learn the Art and Science and Mindset of a Pro Trader please Join us by subscribing monthly for $29.99 at
www.rambus1.com
We have many subscribers from all over the world who are glad they did as they enjoy the many daily updates and commentaries provided at this exciting new site
As you will see Rambus (Dave) has prepared us for this difficult period by being one of the only ones to see and warn about this incredibly debilitating PM smackdown as early as Jan 2 2012 …click on the” HUI Diamond in the Rough” Post in the “Wizard of Rambus” top right
You will find Rambus to be a calm humble down home country tutor with an incredible repitoir of all the TA based protocols tempered with his own one of a kind style…simply put…He wants to keep his subscribers on the right side of these crazy volitile and downright dangerous markets
See you at the Rambus Chartology
HUI Update

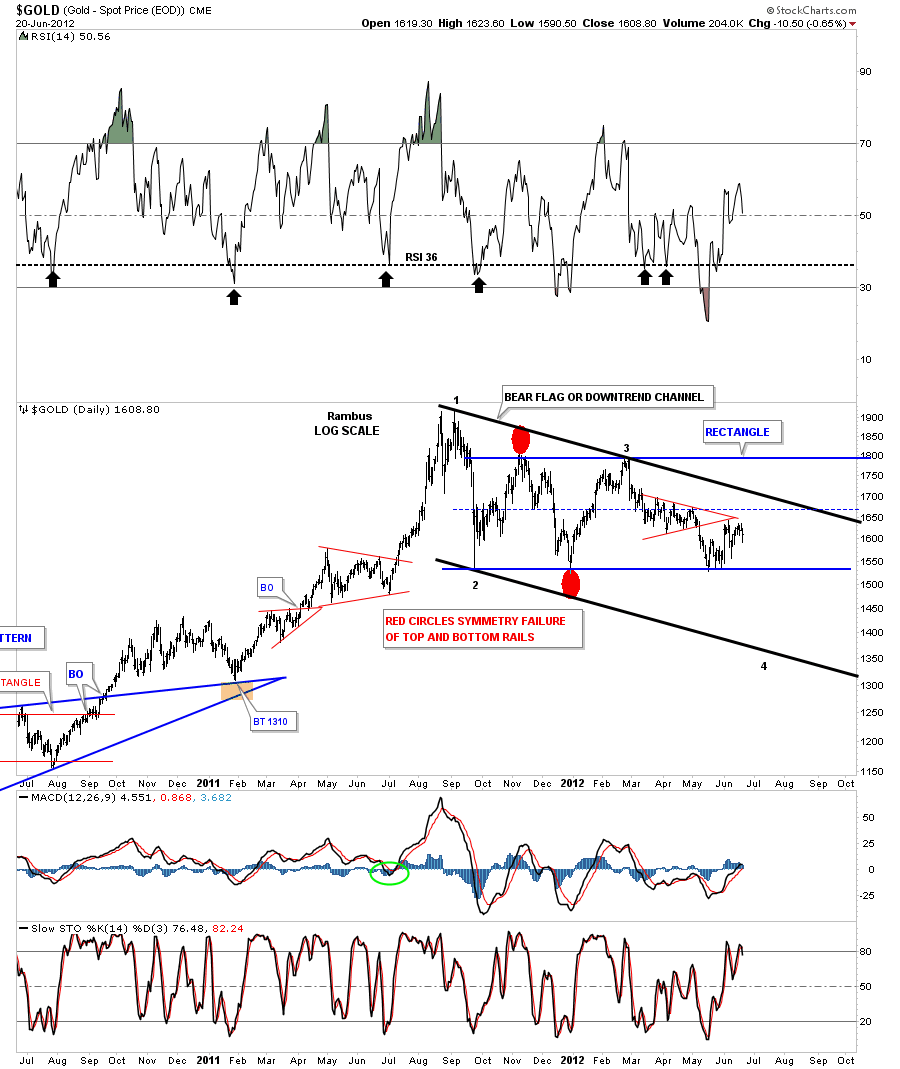
The first chart I want to show is the divergence chart that compares the HUI to the SPX. You can see the divergence is taking place over the last 3 weeks or so, yellow vertical zone. Today the SPX is up and the HUI is down. If the Dow rallies up to the 12,650 area, that I showed on the last post, we could see some weakness in the HUI and at that point is where things will get interesting for the HUI and PM stocks in general. If the negative correlation continues to play out and the stock markets top out over the next few days or so the PM stocks maybe bottoming out. Its something I’ve been watching very close.

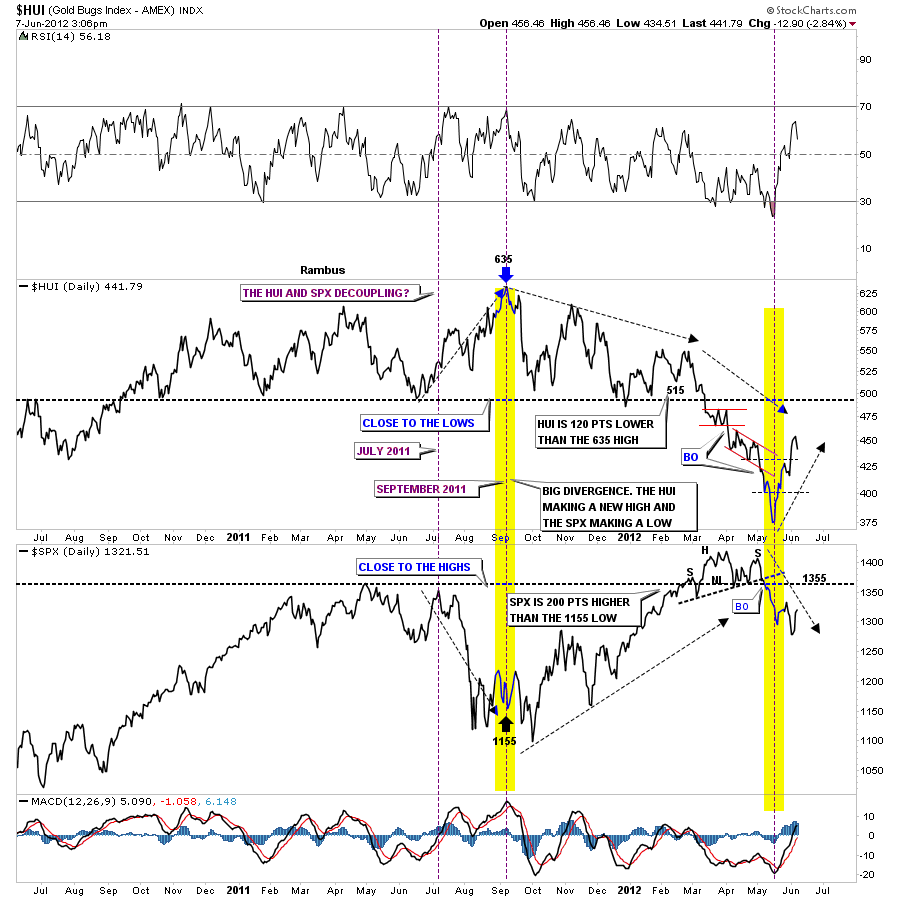
The next chart is a daily bar chart that shows a 5 point bearish falling wedge that had a beautiful backtest yesterday to the bottom rail. This tells us the bottom blue rail is hot and to pay close attention on how the price action interacts with it.

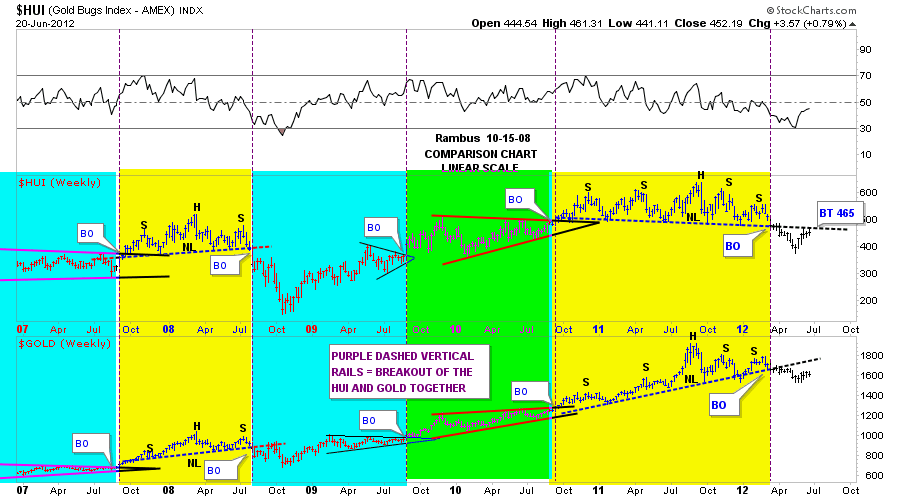
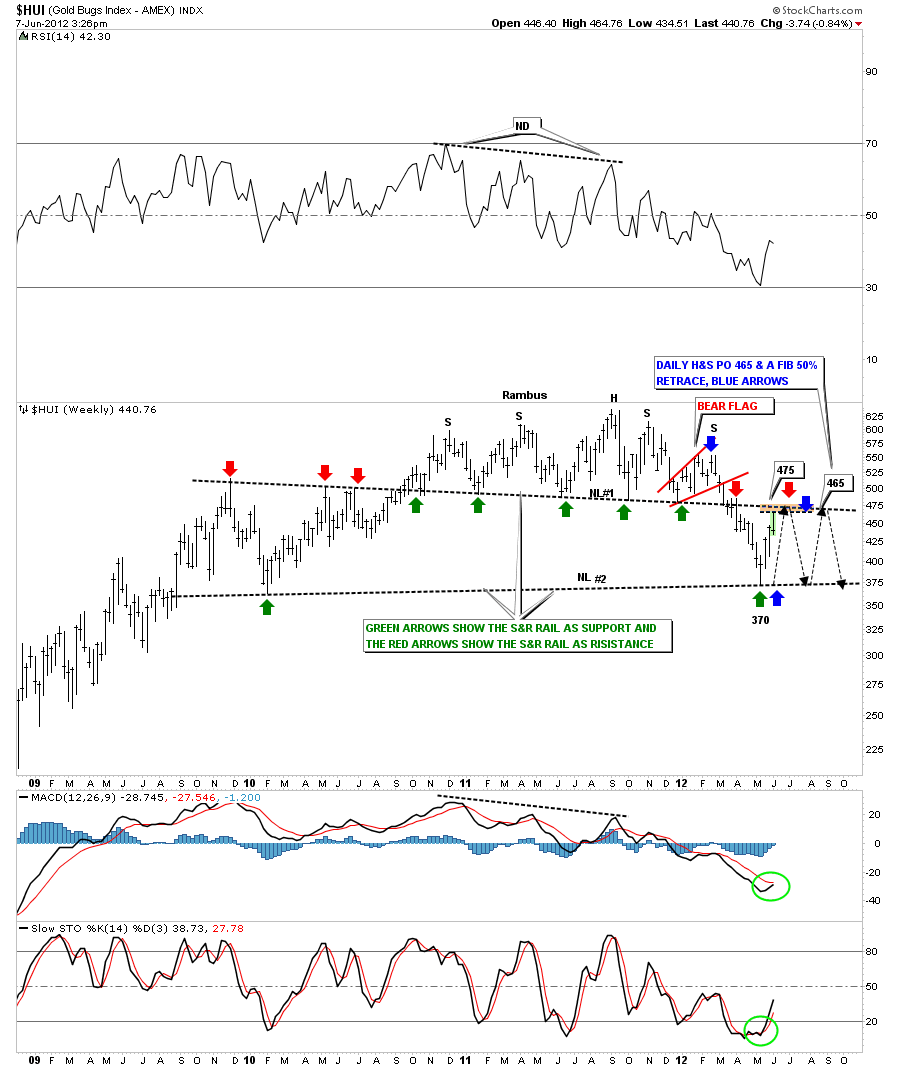
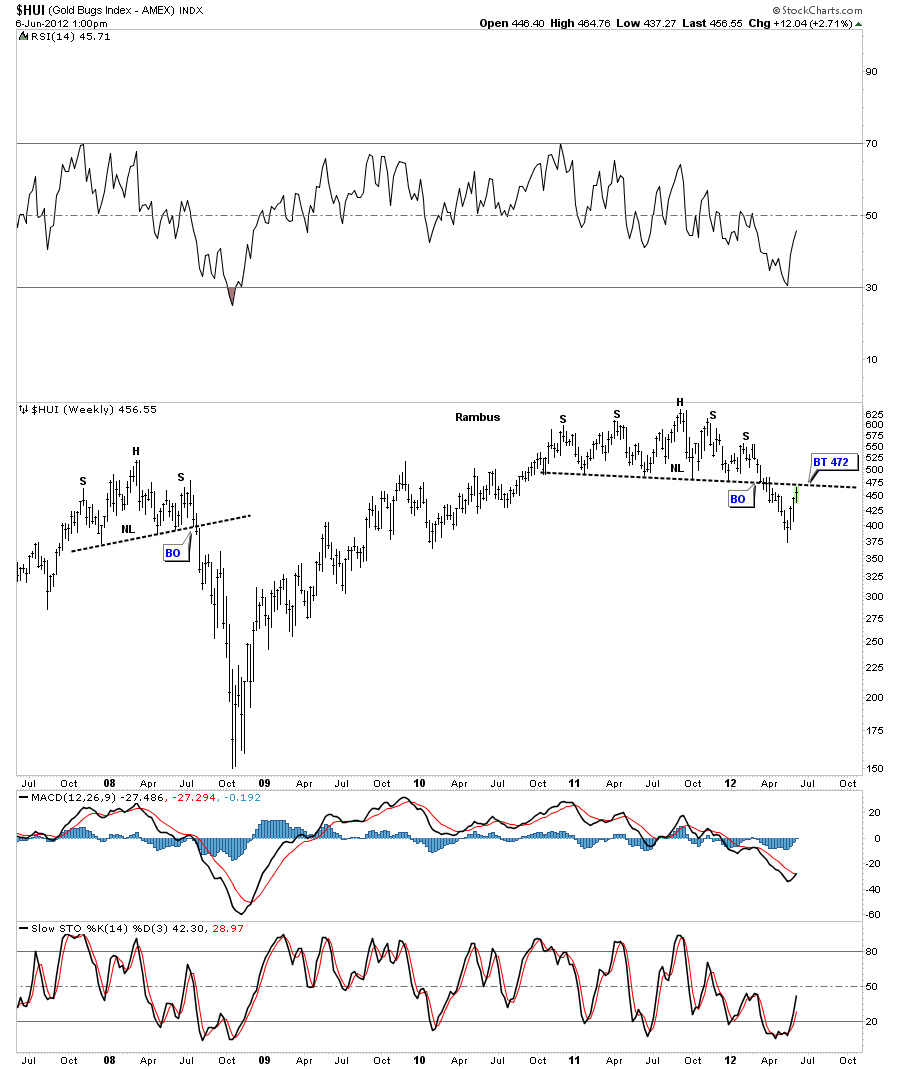
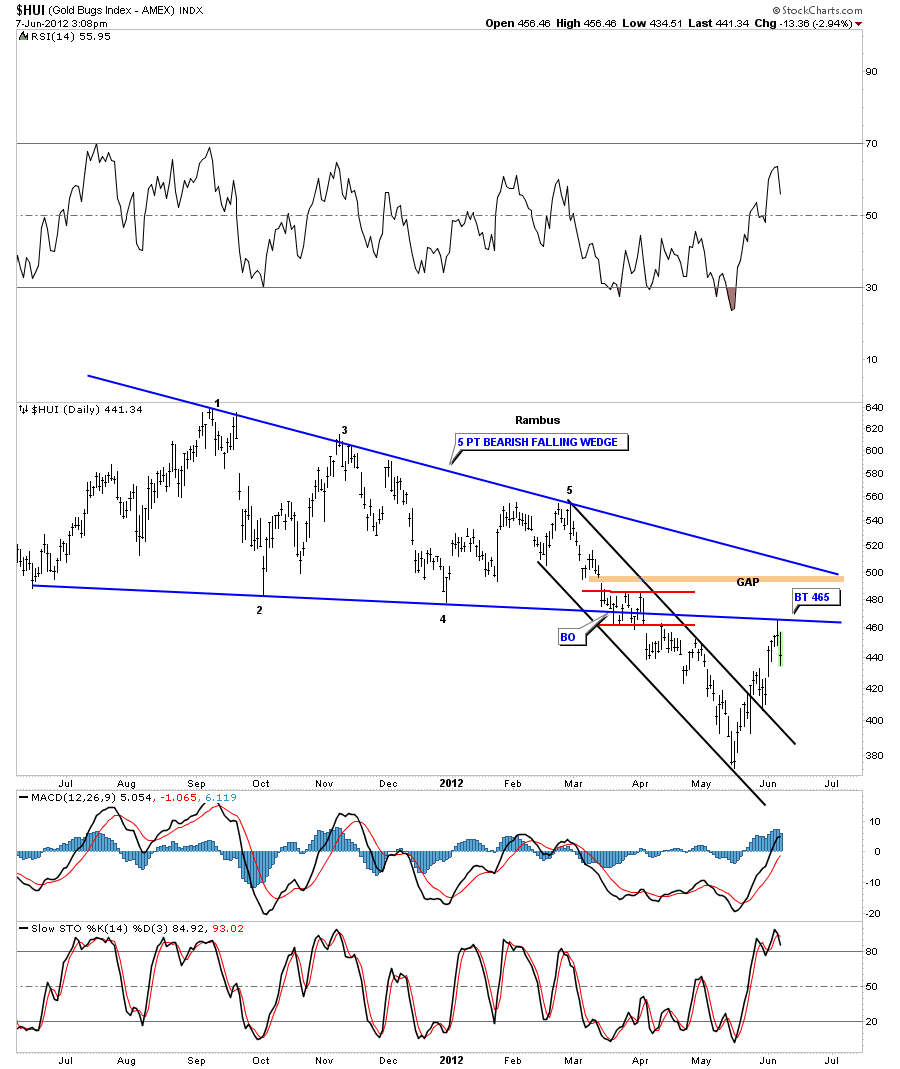
The next chart is a weekly look that shows the big H&S top pattern with the backtest to the neckline yesterday at 465. That’s a million dollar neckline. If the HUI can ever trade above it, that would be showing much strength that would suggest a strong move up for the PM stocks. On the other hand as long as it holds resistance the PM stocks will not be able to rally any higher than this current move higher. I also put on a possible trading range if the HUI stalls out right here, between neckline # 1 and neckline #2.

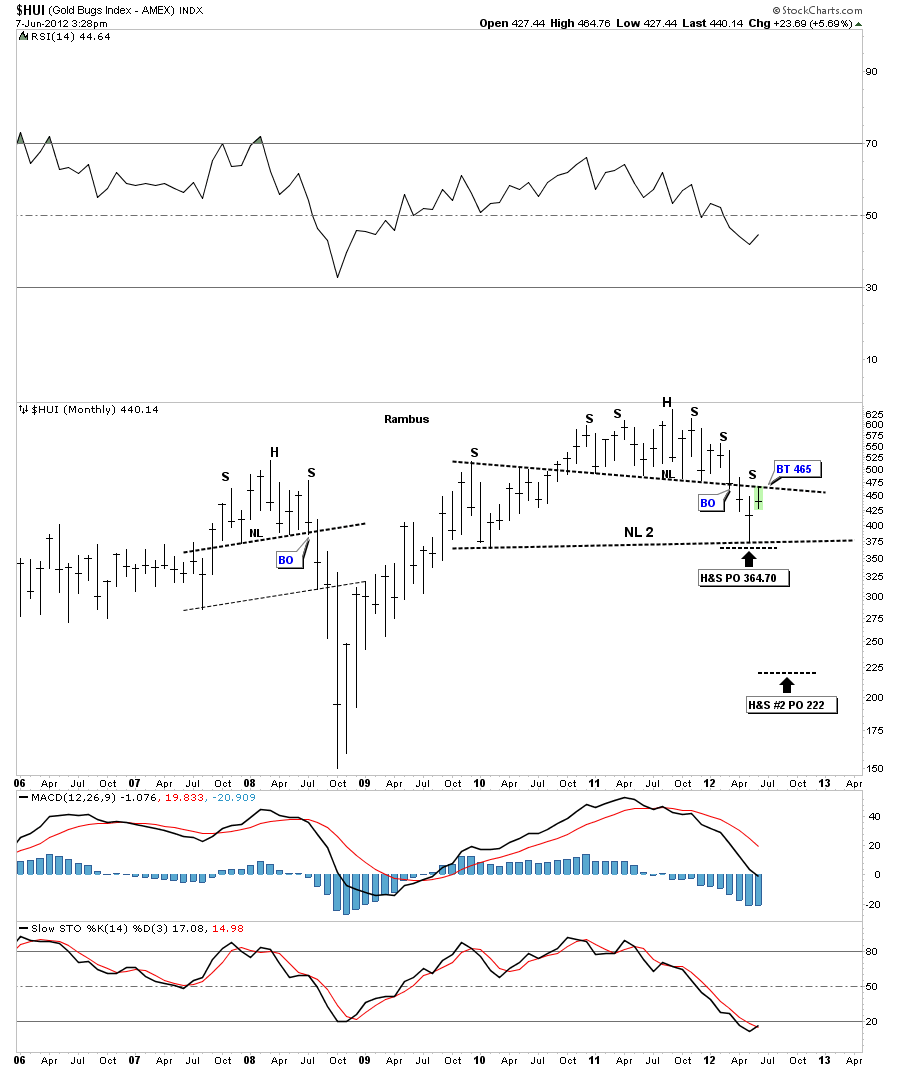
I want to show you one more chart that is a monthly look. Its easy to see how the neckline is working as support and resistance. Above it has acted as support and below it has acted as resistance so far.

The bottom line is how is the HUI going to act if the Dow tops out at 12,650? Will it rally up and break through the neckline? How long will the negative divergence last? We’re definitely at a critical area right here where anything can happen quickly.

I’ve been working on the PM stocks and if the HUI can take out the neckline to the upside I’ll be ready to post a model portfolio. So lets see what happens over the next day or two and take it from there.

HUI Update ..Important Backtest ?

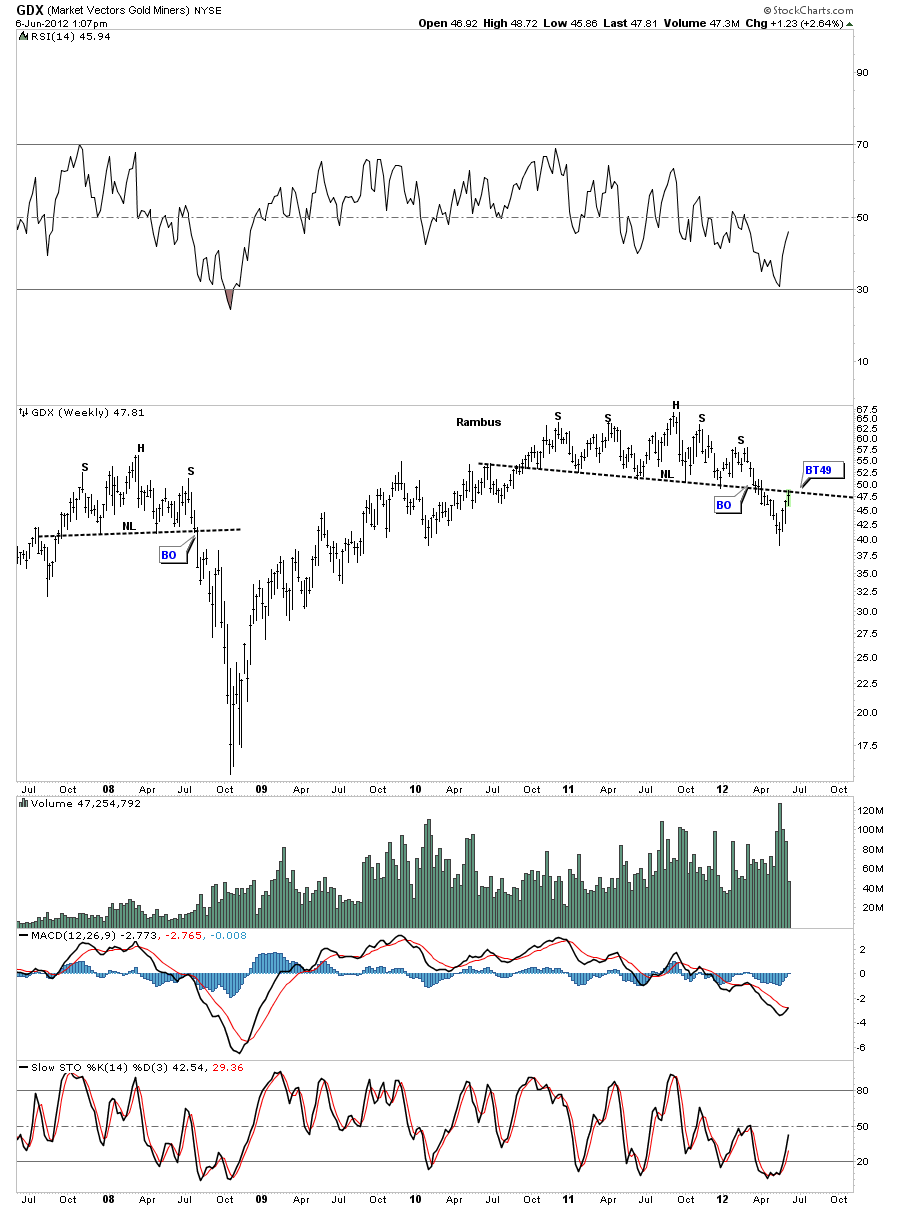
All the precious metals stock indexes are starting to reach into there respective resistance zones from the big H&S top patterns. The HUI touched the lower end of resistance at 465 this morning. The top end of the resistance zone comes in around the 480 area.

GDX is also approaching its neckline around the 49 area.

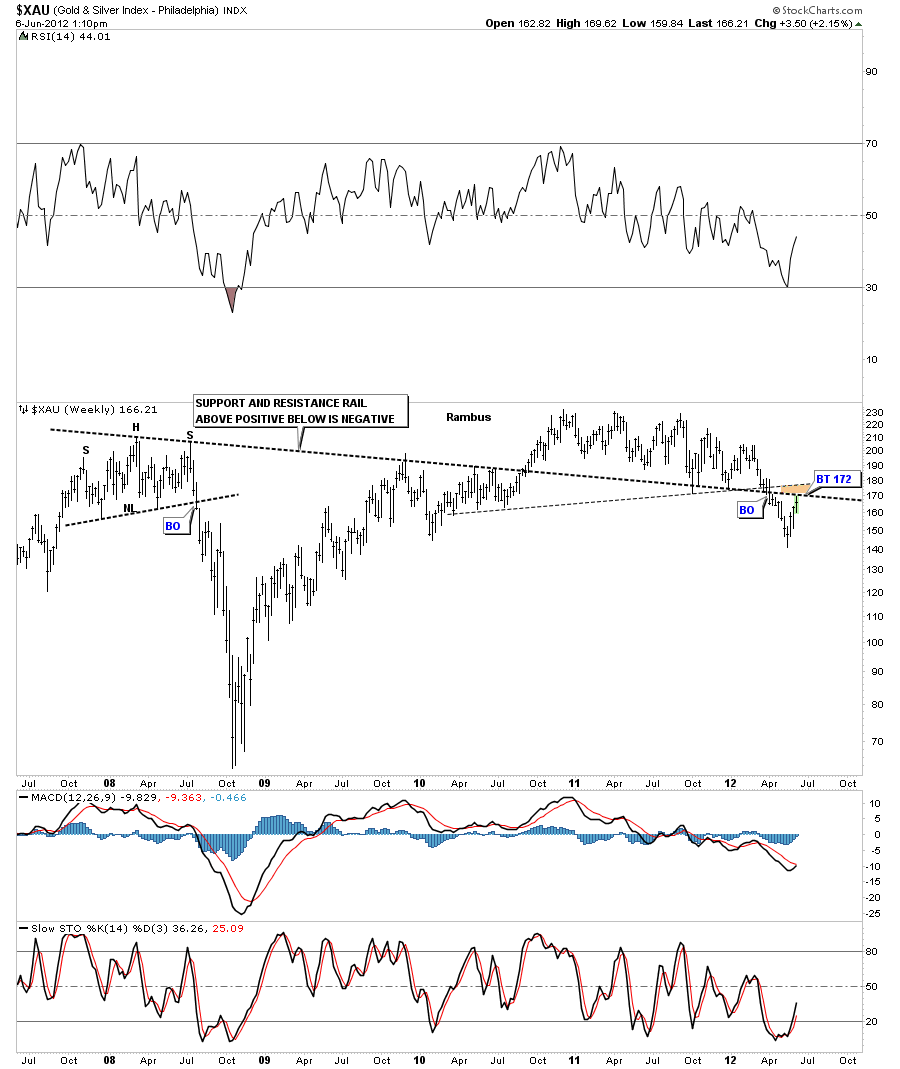
The XAU is approaching it’s resistance area in the 172 area, brown zone on chart below.

If this precious metals stocks rally is for real then these critically important resistance rails will be taken out to the upside. For right now, sitting on the sideline and observing the price action, seems like the prudent thing to do. You can call this area an inflection point as this area will determine the next move for the precious metals stocks. If it fails then we go back down and if the PM stocks show some serious strength in here and break back above the resistance rails that would be very positive. There is nothing wrong with having a big cash position at this juncture to deploy when we get alittle more clarity.

Attention Subscribers

A World of H & S Tops Part 2….Rambus latest work including where the PM Indices fit in all this

As Posted below will remain for Subscribers only

THIS IS WHAT WE SIGNED UP FOR IMHO

Stunning !

Enjoy your exclusive look at this fascinating work and its implications ….

Weekend Report ..A World of H&S Tops.. Part 2

In this weekend report I want to expanding on the Wednesday Stock Report that dealt with many of the global stock markets that have H&S tops that are in play right now. The global stock markets are telling us something is very wrong and we should pay close attention to what they are saying. In part 2 of this report I want to focus in on some other areas that are showing a contraction taking place such as oil, and many different commodities that are breaking down right now. Putting all of these different categories together is painting a deflationary picture on a worldwide scale.

Lets start with oil that is a very good indicator of market strength for the most part. The stock markets and oil generally rise and fall together. Its only when oil goes on a parabolic run does it affect the stock markets, like in 2008. When the economy is strong demand for oil is strong and when the economy is weakening the demand side of the equation is falling. So oil is a good gauge for economic strength or weakness.

Long term oi chart in log and linear scale.

Below is a another look that shows our H&S top pattern zeroing in on the neckline. A break of the neckline will send the price of oil all the way down the low 40’s at a minimum. This would suggest a very slow global economy.

The next chart is a chart for gasoline, the GASO. As you can see below it has been falling like a rock. It has been reverse symmetring down, meaning how it went up is how its coming down. It has formed a second H&S top pattern that has a price objective down to the bottom of the big trading range at 2.49.

Next lets look at the XLE which is an energy etf. After chopping out a complex H&S top pattern it is now in full retreat after breaking out of a bear flag last Thursday.
I would like to show you one more chart for the energy sector before we move on. The XOI  doesn’t have a H&S top but its close to breaking down from a 5 point triangle reversal pattern. As you can see on the chart below its a huge reversal pattern that suggest, when the bottom blue rail is broken, there is going to be a very big move lower.
Copper is a very good indicator of a strong or weak economy. As the weekly and monthly charts below show copper is working on a 2 1/2 year H&S top. This is a big topping pattern that is reversing the bull run off the 2009 lows.

The weekly look.

I just want to show you the monthly look to put this H&S top pattern into perspective.

If the world economies are slowing down the demand for coal should reflect that slowdown. Below is an etf for coal, the KOL,  which shows a very large H&S top in place with the breakout and backtest now finished.

Steel is another commodity that is affected by  the global economies. As you can see on the chart below there is a nice H&S top pattern in place that is still maturing. A break of the neckline will usher in a move down to the 2008 crash lows.

Below is a monthly chart of US Steel that is showing a double H&S top pattern. The price action is sitting right on the neckline.

If the base metals are showing weakness then the companies that mine them should also be under pressure as well. Lets look at three of the very  largest miners.

RIO has a beautiful H&S top that is on the verge of breaking the neckline on the monthly look.

Below is a weekly and monthly look at BHP. The weekly look show it breaking the neckline 3 weeks ago and doing the backtest last week.

The monthly look show a very nice tight H&S top formation on BHP.

FCX is another big miner that is showing a similar H&S top formation that is approaching the neckline.

Next lets look at the NLR which is a Uranium etf that is showing a H&S top pattern in place. Its been testing the neckline for 3 weeks now.

Lets take a look at the rare earth etf, the REMX, which doesn’t have a H&S top in place but it has been falling hard after breaking down from a morphing triangle pattern. Note the little red bear flag that is ready to break to the downside.

Lets now look at a couple of agriculture etfs. After topping out in 2011 with a H&S top RJA has been in decline mode. It has just broken out of a smaller H&S consolidation pattern about 4 weeks ago.

Below is a weekly line chart for MOO which is another agricultural etf that is showing a very large slanted H&S top in place. It just recently broke out and had a small backtest to the neckline.

Lets finish off this report by looking at some precious metals stock indexes. The PM stocks have been leading the way down by breaking out of their H&S tops long before most of the charts above show. They also got a good bounce while everything has been decline over the last several weeks. This counter trend rally is working its way back up to the necklines that once held support. This is going to be a critical backtest. It will tell us if the recent move off the bottom is just a short covering rally or something more like a flight to safety. We won’t know the answer to that question until we can take out the necklines to the upside. The Monthly look at the HUI shows where the price action will encounter the neckline at 475 or so. This will be a big deal as to how it interacts with the neckline.

GDX is getting close to backtesting it’s neckline at the 48 to 50 area.

I want to show you a slightly different look to the XAU. I could draw this support and resistance rail on the HUI and GDX as well. This support and resistance rail has been key in determining support and resistance points since the 2008 H&S top. The rule of thumb is, above the S&R rail is positive and below is negative. Until these PM indexes can trade back above these critical lines in the sand we have to be on the cautious side for the time being.

It looks like just about every area of the markets are being affected by some type of deflationary event that seems to be well on its way. All the fundamental news is tied up in these chart patterns. These chart have been telling us now for about 3 months or so that something is in the wind. What exactly that something is will present itself when the time is right. If you add  part 1 of the article, Global Stock Markets H&S tops to the charts above, I believe they paint a very clear picture of what is coming our way. For right now we wait, positions taken, for the event to come to light.  All the best.. Rambus