Rambus Chartology Website Update

First.. Thank you all for your patience , understanding and messages of support  ..We are now back to Subscriber Only  View of Rambus Posts . Shortly we will have a new secure email alert for Rambus Posts which will be set up for all subscribers automatically . Email… gmag@live.ca …. if you wish to be taken off this feature .

PASSWORDS : Please change your password upon logging in for the first time . To do so click on “My Account” on the right…then click on “generate password”… a long auto generated password will appear….if you wish to use this password copy it and email it to yourself…then click on “Update Profile” on the bottom left .  OR  Choose your own new password ..(.preferably a strong one with numbers letters and symbols) by erasing the auto password and typing in your choice..then click “Update Profile”

FORUM : The Chartology Forum is still under construction . ETA > this weekend or next. For now go to Goldtent      www.goldtadise.com    (for some who don’t have access to goldtent from their location…use a proxy server…… https://www.proxyserver.com/  )

Archives and Sidebar and more will be added back in the near future .

Fullgoldcrown

LABU Trade Setup…

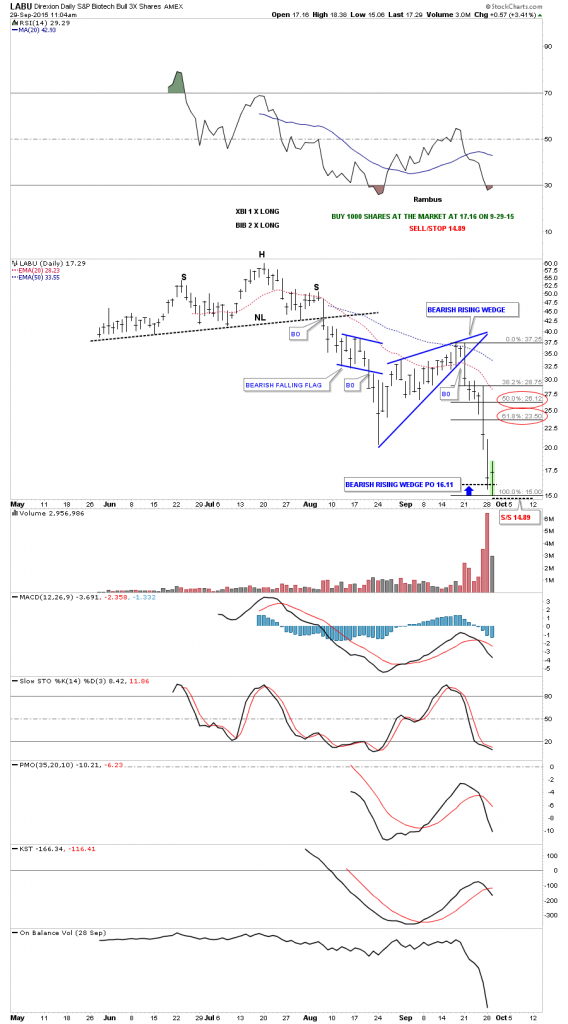
LABU reached my price objective yesterday at 16.11. This is an area where we can expect to see a reversal or consolidation pattern to begin forming. I’m going to buy 1000 shares at the market at 17.16 with the sell/stop at 14.89 just below today’s low. As of today I’m just expecting a relief rally of some kind to one of the fib retracements.

labu bu 2

HUI & GLD Combo Chart…

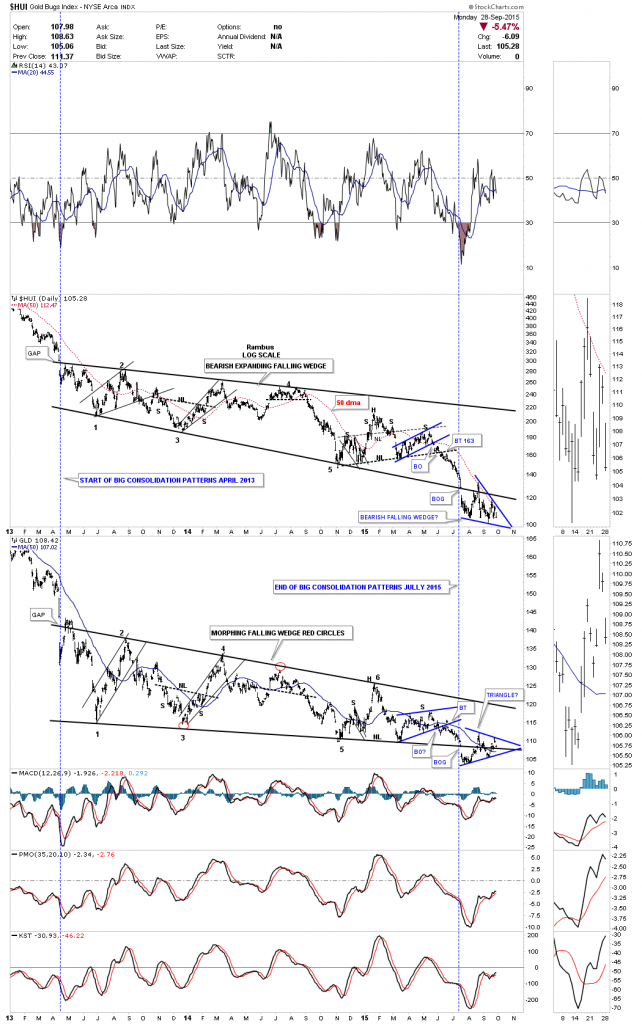
Below is the combo chart we’ve been following very closely that has the HUI on top and GLD on the bottom. This charts shows the big 2 plus year consolidation patterns for each stock. On the left side of the chart you can see how they both began building out their big consolidation patterns with a big gap down in April of 2013. Then they both broke below their respective bottom rails in July of this year also with a huge breakout gap. Since the big breakout in July of this year they both have been forming smaller consolidation patterns at their breakout points. As the HUI has been weaker than GLD it’s forming a small blue bearish falling wedge just below the bottom rail of its 2 plus year consolidation pattern. GLD on the other hand has been stronger and is forming a blue triangle consolidation pattern right on its bottom trendline of its 2 plus year consolidation pattern. They’re both working on their fourth reversal point within their small blue consolidation patterns. It wouldn’t surprise me if we see them both break below their bottom blue rails on the same day which will be confirmation that the next impulse move down is truly beginning. It has been a long time coming but we’re ever so close.

boy

SPX Update…

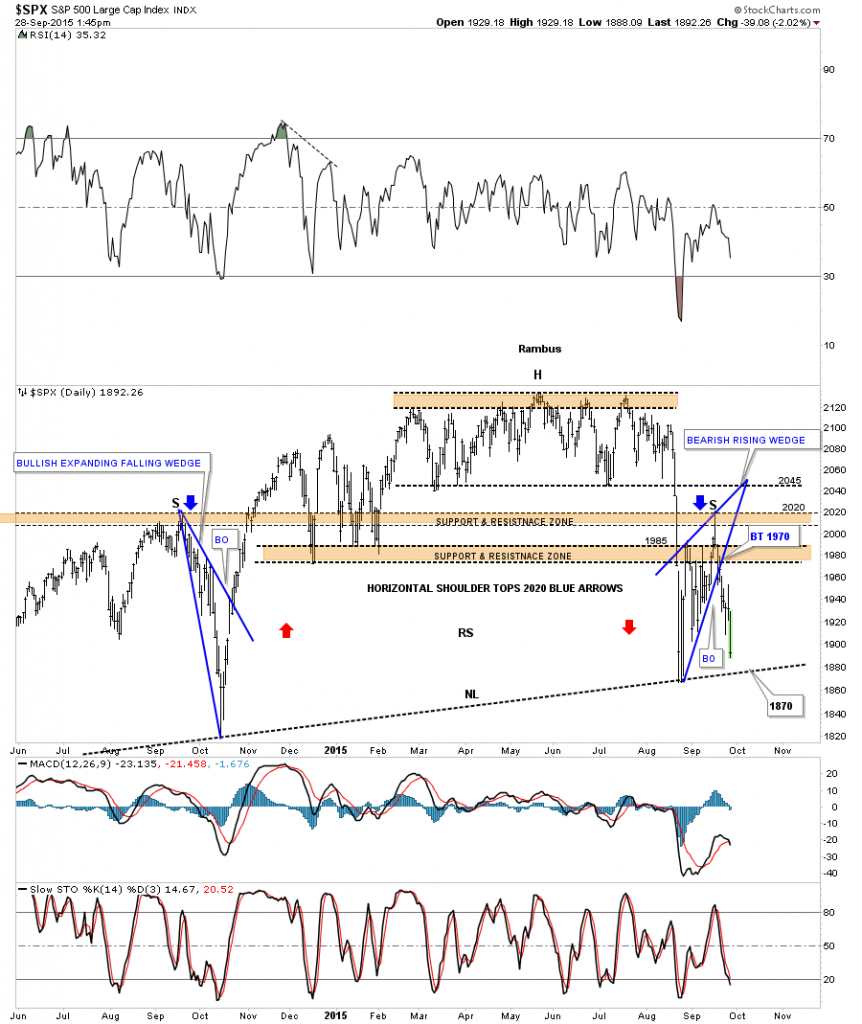
Below is the daily chart for the SPX we looked at last week that is showing the potential H&S top. What I’m most interested in is how the price action inter acts with the possible neckline around the 1870 to 1875 area. If the neckline is valid we could see an initial bounce followed by a break below the neckline or we could see a gap below the neckline without any bounce. The potential neckline is the most important trendline on this chart right now.

spx