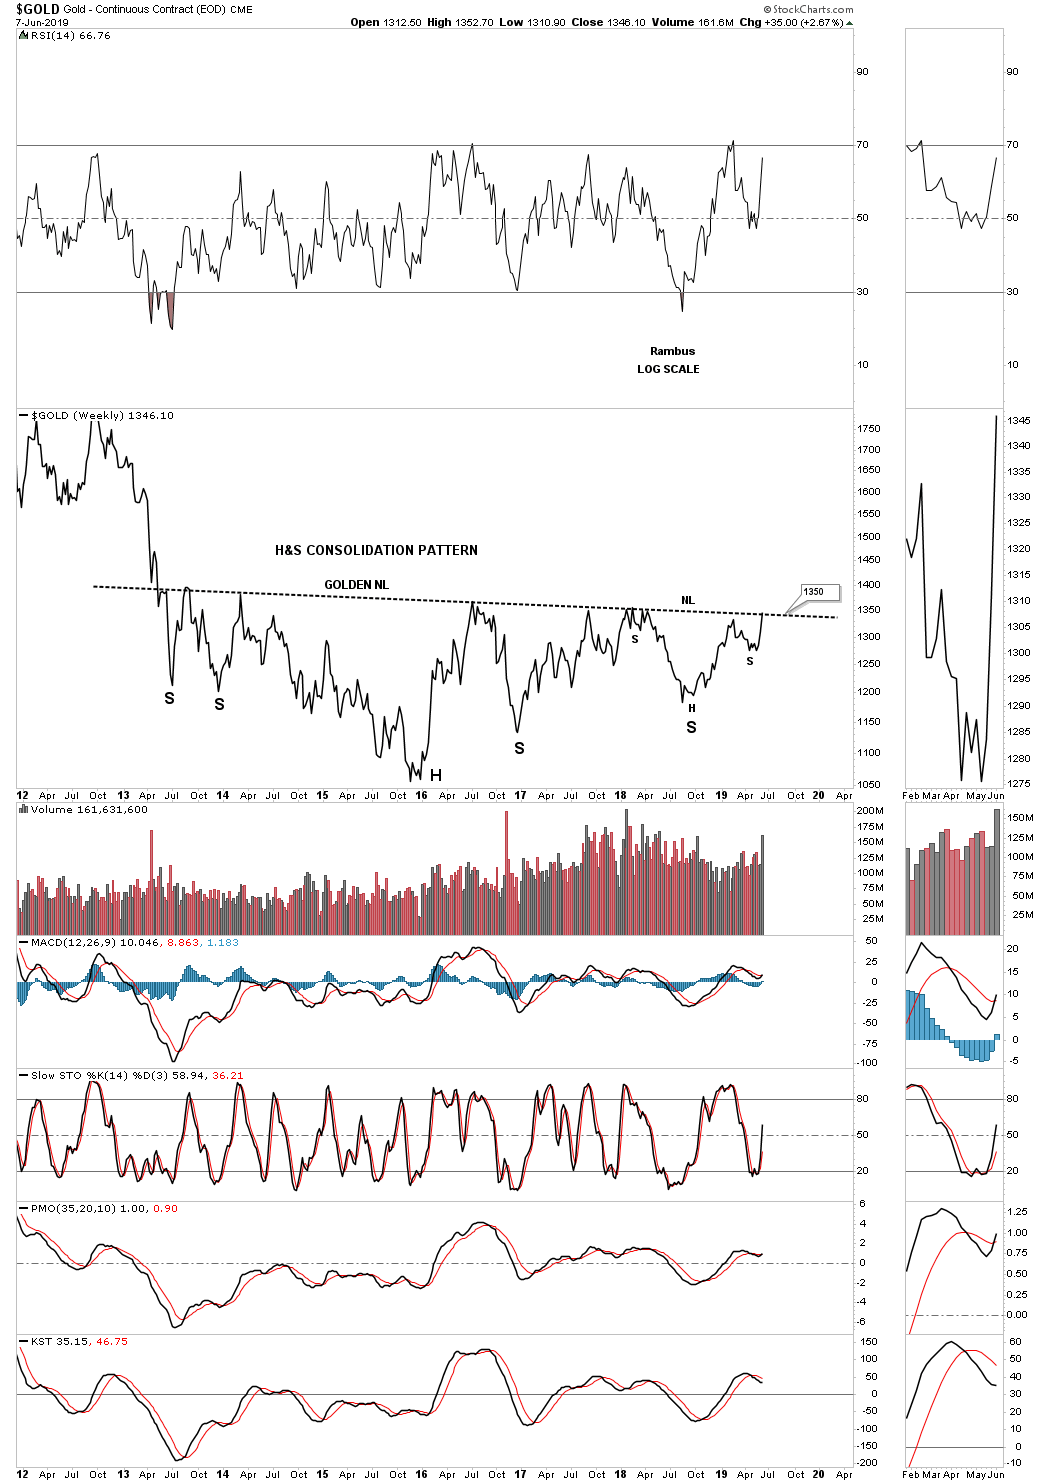
It’s hard to believe that the massive H&S consolidation pattern we’ve been following for several years began to develop all the way back in 2013 during the initial crash off the 2011 high. This weekly line chart shows the price action closing this week right on the neckline at 1350. Note how many touches the neckline has experienced from below with each one backing off. Now the question remains, how may bears are left to defend the 2013 neckline? There is a good chance that if they are exhausted that the price action could just spike right through the neckline this time around completing the massive H&S base which would be long term bullish. Big patterns lead to big moves.
This monthly chart shows how the H&S consolidation pattern fits into the bigger picture.
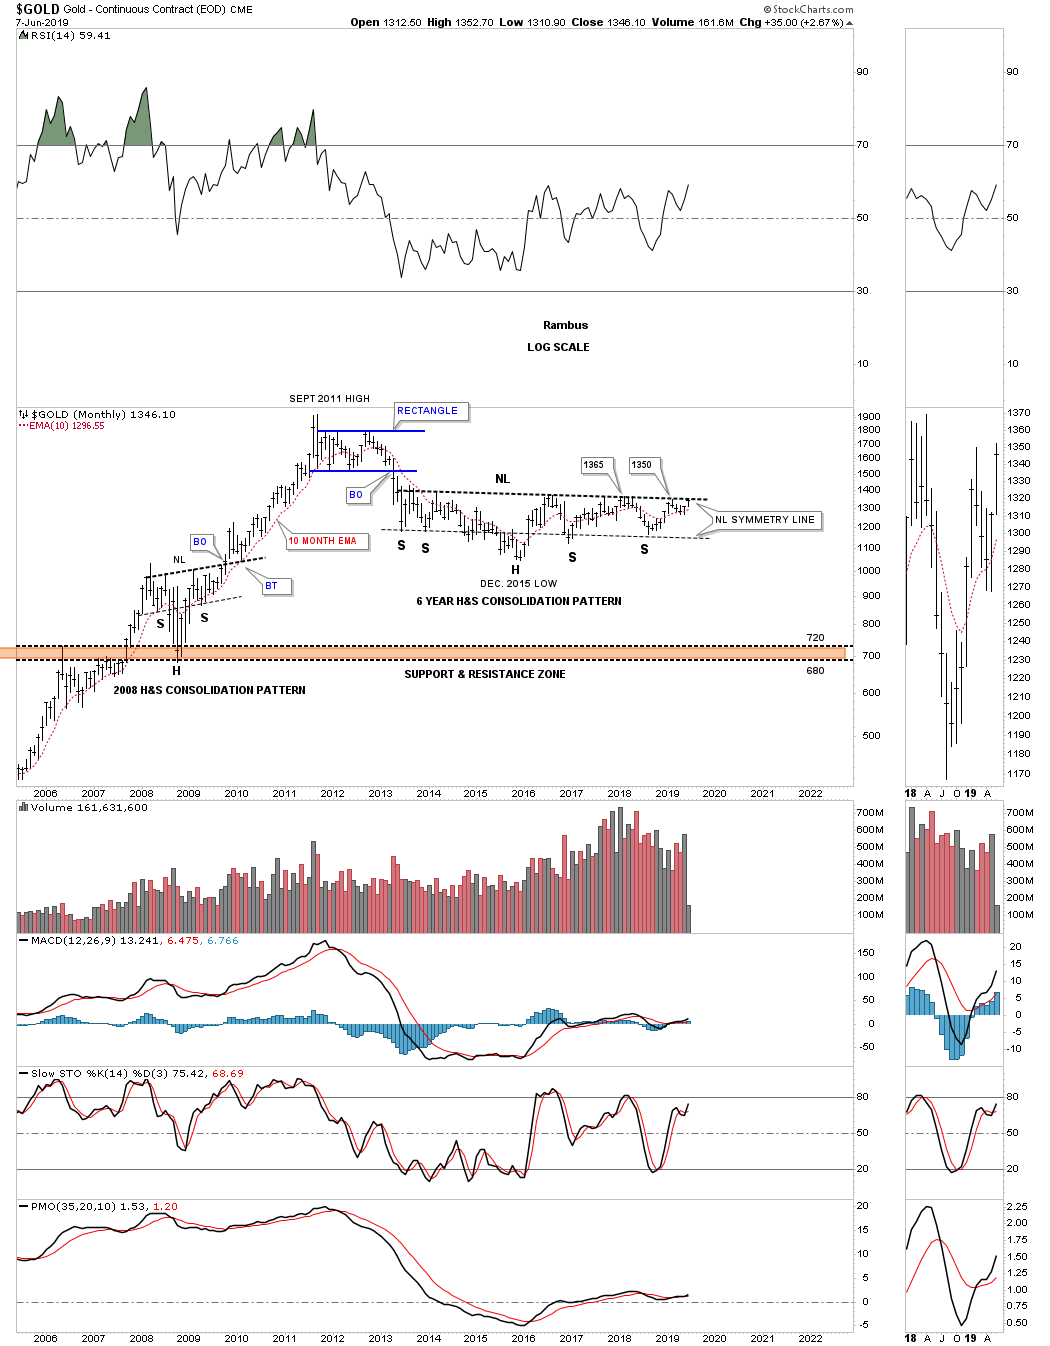
The reason I call this H&S bottom a consolidation pattern is because of the way it fits into the major bull market uptrend channel.
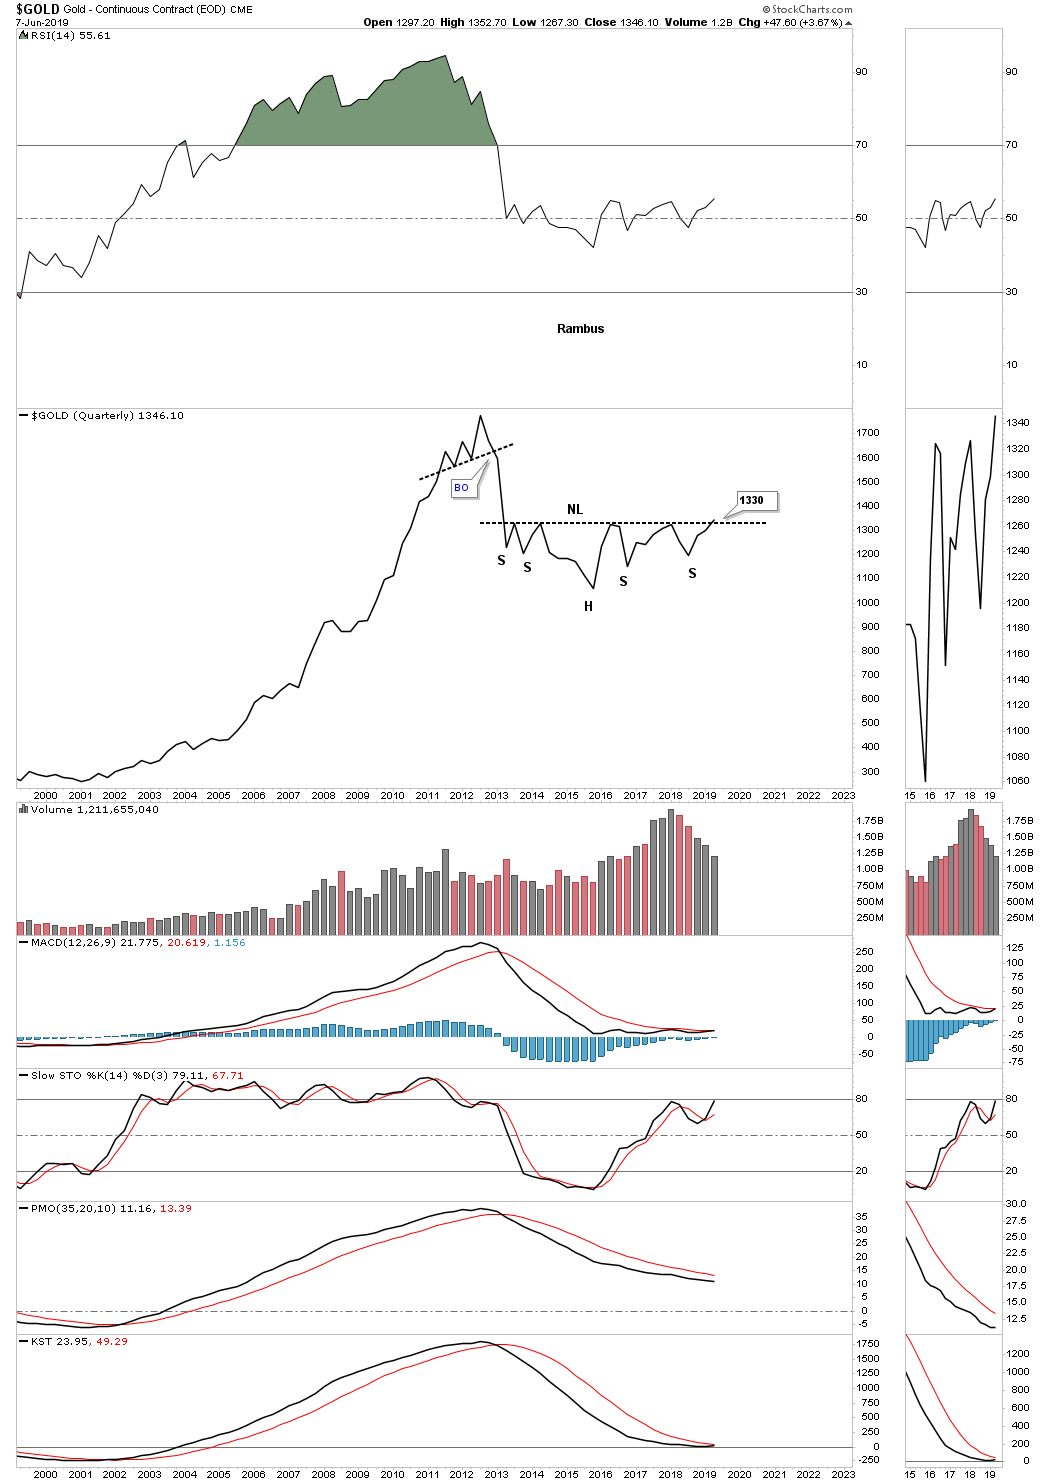
If gold can closeout the month of June, on this quarterly line chart above 1330, it will show a breakout above the neckline.
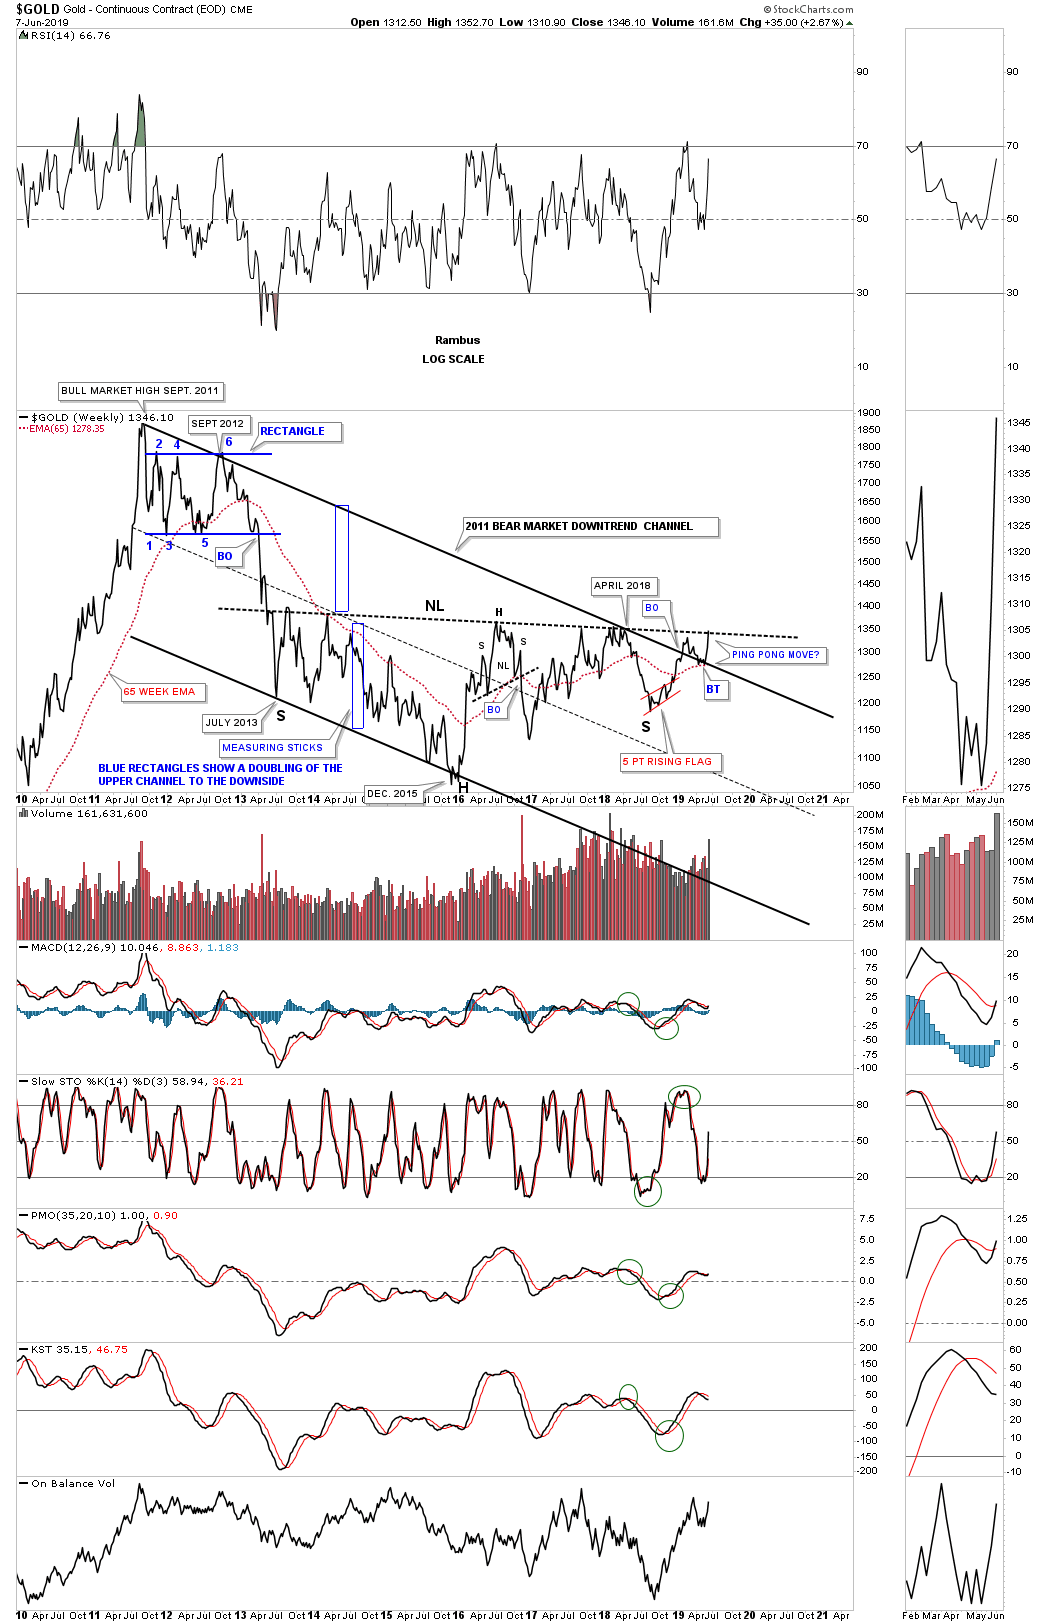
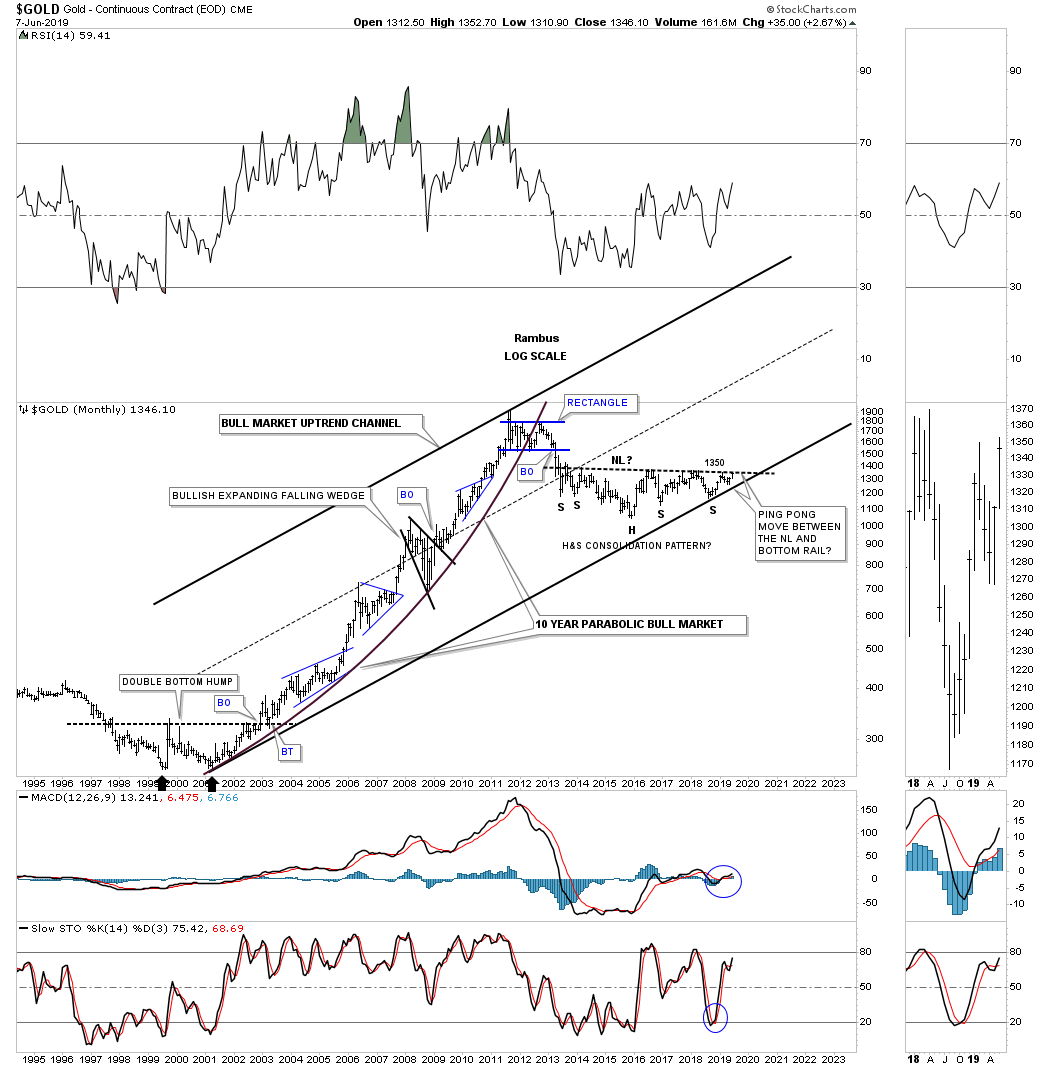
It’s been awhile since we last looked at this long term weekly line chart for gold which shows its 2011 bear market downtrend channel along with the 65 week ema. It is common to see a rectangle or triangle form between the top and bottom trendlines of an uptrend or downtrend channel. Here we can see the massive 2013 H&S consolidation pattern doing the same thing between the top and bottom trendlines of its 2011 bear market downtrend channel.
The breaking out and backtesting process looks a little cleaner on this weekly line chart. It was last April of 2018 that the price action touched the top rail of the 2011 downtrend channel and the H&S neckline. It was disappointing that the price action couldn’t takeout those two very important resistance lines which led to one more year of sideways chopping action. Gold is ever so close to establishing the start of the next bull cycle and by the size of the H&S base it should last for many years.
Sir Plunger will be doing the Weekend Report so stay tuned. All the best…Rambus