The Following Is a List of Unsolicited Comments from Analysts , Newsletter Writers and Rambus Chartology Members :
……………………….
Reading Rambus is like sipping on fine high-altitude Argentine Tacana wine. You let it roll over your tongue and mind, and it sinks into the creases of your subconscious and starts lighting up new synapses.
Plunger dives into the subject like a Stuka and drops his bomb(s) square on the target every time!
Rambus gets to the Winner’s Table like an old-money Aristocrat who knows the value of generational wealth. Like the late Sir John Templeton. “A third in Land. A third in Art. A third in Gold.”
Plunger is the North American version of Japan’s “Sword Saint” Miyamoto Musashi. At some point he (and I) will “Think only of the cut.”
Your blood cringes when you read his analyses. He calls out the animal spirits. I who have waited since 1980 to “get it right” – maybe in a way that’s even bigger than my biggest picture can envision. That’s what I see happening with Buffet’s volte-face. I hold a number of Plunger’s picks here as “Pareto Principle” picks, where I anticipate that 20% of my holdings might payout to me 80% of my winnings, with as Sprott’s Peter Grosskopf says, “the other 80% will more or less subtract from that total.”
This too is my last metal’s sector investment rodeo, and I’ll spare no effort to correct and override all the investment mistakes I’ve made since I first bot physical silver at $4.23 in the early 70’s and had my fire lit by Harry Browne, Jerome Smith and Doug Casey, and held on through the Hunt Brothers’ debacle.
Plunger:
My view is this is the opportunity I have sensed for my entire adult life. All the mistakes I have made, all the accumulated knowledge I have, all the market cycles I have witnessed have prepared me for this moment. If I play my cards right, I can move into a different economic class. I’m not into rap music, but Eminem got it right in his song Lose Yourself:
“If you had one shot or one opportunity to seize everything you ever wanted in one moment would you capture it, or just let it slip? You got one shot- Don’t miss your chance to blow, this opportunity comes once in a lifetime” (my bold, DS)
I get a bit emotional reading this from Plunger, because, verbatim, THIS IS EXACTLY WHERE I AM! ?
David Smith Senior Analyst Morgan report
………………
The value and learnings we are all getting from Sir Rambus’ analysis is beyond compare. The gent is ruthlessly objective, transparent, and does not let ego affect his analysis…and his record speaks for itself. Let’s all be grateful.
Sir Rambus, keep doing your thing and ignore the noise. Cheers!
IBW
……………………….
As you know, I regard Rambus as the world’s leading chartist. That’s right, I am saying that no matter where you go or how much you pay you are not going to find a better product. I challenge you… go find it…it doesn’t exist
Plunger ( Resident market Historian)
………………………………………..
I have been here for years reading the great work that Rambus, you, and the ever vigilant and faithful Fully post on this site.
I thank you all for sharing your experience, wisdom, and insights into the markets during the PM bear years to now the awakening of the bull.
Compliance limits me to almost no posting, but I know Russell Napier and when I read Plunger attended his courses, well it confirmed for me he was for real. Not least his attending PM conferences and reporting just how bad sentiment was!
Anyway Sir Plunger, I for one will never ever forget you standing alone and shouting from the mountain tops that the gentleman’s entry was here. I will not forget when your decades of experience culminated into standing up and making a huge call when no one else was to back up the truck.
Perhaps I am biased because Silver Wheaton was the horse I road in the last bull run, but all I can say is thank you for your initiative, guts, and kindness to teach the rest of us and augment the work of a great technician and his tireless mule.
Doom arigato
NThompson
……………………………………….
Sir Plunger …you provide all a very good mix of: Macro, historical, technical, and “street smarts” to the markets. This combines with Sir Rambus incomparable Chartology is a very potent combination in my opinion. Thank you both very much…
Obi Wan
…………………
I’m always amazed at the depth of reports provided by both Sir Rambus and Sir Plunger. It takes lots of time putting those together. Im super glad i found you guys. Thank you gentlemen!
Anty0601
……………………………………………………………………………………
I mostly lurk but I will say this, Rambus , Plunger and I’ll add Fully are a Godsend ..Always professional, respectful and rare in their analysis…and a shout out to all the member contributors..also top notch..I love the fact that there is diversity in the analysis..There are more ways to skin a cat..
What a tremendous service this is. One more comment..There are many good analysts out there but nobody outworks Rambus
Lou M
………………………………………………………………………………
Dave:
You truly are the Vivaldi of technical analysis – Or Mozart – take your pick!
It really goes beyond technical analysis. It is a bit like watching Jim Hendrix play the guitar. It is divine intelligence flowing through.
…………………Catherine Austin Fits……………………………………………………………….
Rambus. World’s best chartologist. Period.
jonny cash
……………………………………………………………………………………….
Yes, I agree, a very worthy weekend report by Sir Plunger. I started investing in 1985, but some of the
points that Sir Plunger makes, I have never seen or
heard before.
I also believe that his views can be used in conjunction with Sir Rambus’s chartology. Having such invaluable resources gives one a more thorough understanding of what is going on in the market.
Renegade
……………………………………………….
Since joining Rambus Chartology approx. 2 years ago my trading account has certainly been going in the right direction. I want to thank everyone here with a special mention for Rambus, Fully and Plunger.
I checked the exact figures in the portfolio report and it is up 313.4% in 2 yrs.
I have mentioned it in the past but for me getting a subscription here was game changing and I´m very grateful for that.
Thanks everyone ?
ps. I should also mention the 2 yrs prior to subscribing I lost money.
Sir Marty
I think the product Rambus puts out is the best value on the market. He has a skill set un-matched by anyone else out there and for him to share this with us is very blessed. If I had his level of chartsmanship I would be marketing it to some hedge fund up in Connecticut. I am just grateful to be exposed to his work.
Believe me I know my TA doesn’t hold a candle to what Rambus puts out, but I try to deliver some actionable information and not just puff.. For instance the part on Novo at the end of the report is actionable info. Where else can one find that? Rambus needs a break every now and then, putting out a weekend report every week is simply insane. Those who don’t realize that ought to try it. So for any out there who who would just have Rambus you are already getting what I regard as more than full value with what he does put out. Hopefully I have identified what I see as a rolling market top and the value of the reporting of this will become evident later.
Plunger
……………………………………………………………………
FYI ….agree that it appears to me that a ton of Rambus subs don’t even pay attention to Rambus trades outside of Gold/Miners …IMO they are missing the boat …blinded by the glitter of gold ….I know what that’s like, my partner and I as kids in our early 20’s made, and lost, a few $$ Mill in the 1980 run up …its addictive …Rambus has all kinds of great trades outside gold …all kinds …Just look at the stinking basic QQQ, Dow, SPY, over just the last year, let alone since ’09 …gee …and you have the Fed protecting your behind, on your side no less …Of course it’s potentially insane what the Fed has been doing, as Rambus may agree…but a ton of $$ has been made …
Rambus is under appreciated…he calls is as he sees it, regardless what others think…
That is the type of individual thinking I want …
Anyway sorry for the rant, but as a “silent” subscriber, this observation has been bothering me for some time and I didn’t know how or where to post it …
Jim-
………………….
Hi FGC,
I just want to express a great big thank you to Rambus, Plunger and you.
Thanks to Rambus for his talent and and sharing it with us all.He is undoubtly the best chartologist I have ever known.
The best part however is the fact that he is so emotionless in letting the charts speak for itself.
This year the market have been really good to me, thanhs for the insight from Rambus.
Mostly I don’t invest in the stocks you trade in as I am in Australia. However your insights especially in the big picture has helped me tremendously in my investing. Thanks again.
Thanks to the greatest historian in investing who of course is Plunger. Priceless article from you Plunger and so easy to read,
And of course thanks to FGC for his great work as and editor and chartist too. This site cannot exist without you and Audept.
Thanks again and looking forward to 2018
tuckchan
……………………..
indeed amazing write up!
Rambus – Great chartist and technician. Utmost wizardy and focus on price action.
Plunger – A mix of fundamental analysis with chart action. I like the commentary on why a chart is trending a certain direction.
Sank
……………………………………………
Thanks Coach! Yes, i got tired of losing money….I lost over $100,000 a year and 1/2 ago following TraderMC’s advice which was 100% my fault….I kept thinking there was someone out there who knew all the answers and all I had to do was blindly follow his advice and wait for “his” call to know what to do next–that’s what I wanted to find so I wouldn’t have to take responsibility EVERY day for every trade and open my accounts NO MATTER how scary the news might be and with Rambus’ charts and all the great traders at the Rambus site and Goldtent owning everything and taking full responsibility and paying A LOT more attention things have gotten a lot better and I have learned SO MUCH…things that will last the rest of my trading days….so again thank you so much!!!!!!!!!!!
C
……………………………………………………………………………….
Hey, I know this is a joke to most but want to pass on that i was able to make 24K solid profits trading for 2015. Never bought my 1st position until the end of June when I found and signed up for the Rambus service. So 24K in 6 months aint too bad for a newbie methinks. Felt good to short gold and miners and get back some of what I lost prior to April 2013 when I was caught up in the gold to the moon BS. Took me since then to get a grasp on trading and last year was a major breakthrough due in large part to chartology wake up call. Thanks!
Gary
……………………………………………………………………….
I have only been here a couple of months, but I have learned so much and made so much more $$! Even played this counter-trend for a win. Of course I’m back on the right side now and will be able to sleep again!
Your story is much like mine. I would have gone broke had I not awoken from my slumber that I was actually paying others to be in. Now it looks like my kids will have a college fund and I may actually be able to enjoy retirement one day.
I can’t even begin to thank Sir Rambus and ALL members of this roundtable enough! Even if I don’t reply I check this site multiple times every day and am in awe over the cooperative spirit around here
Stugots
…………………………………………………..
I am finally on a much needed vacation from the world of finance and I thought to myself tonight that finally after so many years of voraciously reading anything and everything on the PM’s and the miners (in what behavioral finance is called confirmation bias), I am finally confident and content to just be here.
I have found your work and the community you Fully and Audept attract (domo Arigato Plunger-San) to be truly excellent.
I acknowledge the truly special talent you poses and that posting your market analysis ,brings a Heavy price to bear as the markets move and adjust on an hourly basis, so thank you for daily efforts, keeping the big picture in site, and may you all at Rambus Chartology have the summer break for you and your families deserve.
domo and arigato
nthompson89
………………………………………………..
found Rambus yesterday — I was reading the comments to a Zero Hedge article and saw a link to a posting by Plunger on goldtadise … went there and saw a reference to Rambus.
Boy, do I wish (and I mean REALLY wish) that I had found Plunger and Rambus back in 2010/11 !! Stunning to realize that what I thought I knew about the markets was either flat out wrong or skewed like a carnival mirror …
I was always strictly a fundamentalist when considering gold (and I might should say “simplistic fundamentalist” now after reading Plunger and Rambus) … I basically accepted the argument that imbalances in the fiat system could only be allievated by TPTB bringing gold back into the monetary system and that would happen sooner or later. Thought it was in the works so to speak all through the 2000’s as gold made what some were calling a “managed” ascent … oh, so wrong!
…………………………………………………………….
Thank you Rambus
For all your hard work, teachings, and consistent effort over the year (you to Fully)
I have learned a lot, become a better trader, and best of all I think I am a happier person because I have a much better idea of what is going on with the trades I put on.
I could have done none of this without you and your site.
All the best over the holidays to you and your family.
Regards
………………………………………………..NT
Sir Fullgoldcrown,
Thank you for the welcome. I must say this is a sharp crowd. A great deal of valuable information and sharing. Chartology has some very sharp insights. My account has grown by 85% in the past two months, due to it.
I S
……………………………………………
Ok – first let me say that the Chartology of Sir Rambus far exceeds any other method of analysis I have come across in my 30+ years of investing. For those of you who are new members, it is based in large part on the book “Technical Analysis of Stock Trends” by Edwards, Magee, and Bassetti. I would suggest you buy a copy, read, re-read, and then re-read this book over and over and over. I have, and the analysis Sir Rambus produces fits lockstep with the material in this book. OK, enough said.
There has been a lot of Elliott Wave talk here lately. I tried that method for ~10 years and lost more that I made.
KenS
……………………………………………
100% gain since May 22, 2013?
On October 22, 2014 ·
”
That was the day I started following chartology, learning chartology, and taking Sir Rambus’ advice.
Been a heck of a roller coaster! Hope it’s all uphill from here! 
I figure if I can average just 50% per year I’ll be set for life in about 10 years…
Thank you Sir Rambus and everyone else here!! This is the best site on the planet… Keep up the good work chaps ”
Parabolic Chuck
…………………………………………….
Also I would like to say I came round to Rambus after many years of research.
I joined because Rambus is the best market commentator I have read, surpassing the impressive Charles Nenner.
One of the many ways Rambus leads the field is that instead of making big calls he simply observes the probability of a move and takes the risk with his own portfolio.
Of course mistakes will be made, but your website has helped clarify my thinking and allowed me to see beyond the golbugs weekly predictions of ‘the bottom’, which always seem to be forgotten as the next low sets in.
I suspect some have come to your site, like me, nursing heavy losses from positions we could have sold or hedged if we had factored in the Rambus view point well over a year ago.
Simon
………………………………………………..
have been a successful share market trader for 30 years. Its my living now.
Rambus Chartology is Rare. A diamond in a rhinestone world.
Keep up the excellent work Sir Rambus. Thankyou
Classact
…………………….
Like he said, everything is clear in hindsight. I have been watching and following for the past 3-4 months. These are great trades. He gives me confidence even though I use my tools for entry and stop points. Those points are very close to his calls anyway. I learn a lot from his way of looking at the big picture and zooming in. Also, I learn a lot to build the full position size using small bites. Great learning and confidence building last few months. I am very thankful. First time I am making good money since I started trading 9 years ago
urdancing
………………………………………………….
Btw. This forum is worth the price of the subscription fee itself. Some amazing AMAZING chartist here.
Reply
Parabolic Chuck says:
April 17, 2014 at 6:41 pm (Edit)
Give that credit to Sir Rambus! Most of us couldn’t chart before joining his site… He’s a great teacher…
Reply
PK says:
April 17, 2014 at 6:49 pm (Edit)
Oh trust me, I know. I haven’t had this much success trading ever before. Feel lucky to have come across Rambus… it’s simplified everything
………………
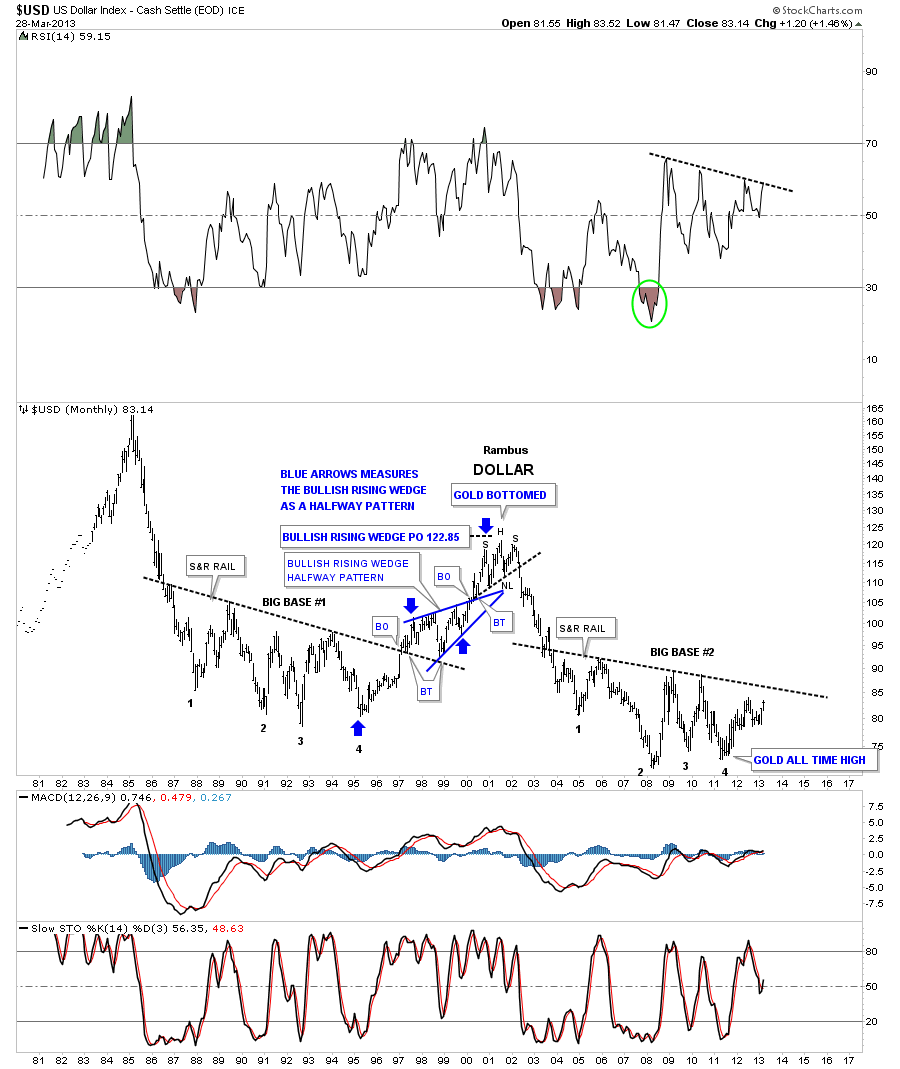
Wow. A 30 year 4 point bullish consolidation.on the Dollar
Everyone is effectively short the USD, both international corporate and worldwide governments in the form of debt borrowed in USD. When it all has to be unwound, USD needs to be bought back. So there is effectively a huge short squeeze about to happen in USD.
Even without that knowledge, the chart says it all. Everything else is noise.
You said it nicely. Charts have been telling the future for decades. I have been chartoholic for all my life. Chartology took me to new level and am excited.
Bikoo99
………………………………………………………………
This is what is so powerful about chartology. You can sit a room, with no outside information apart from the charts, and see what is happening and where trends are heading, without any fundamental news or advice from any source. Just the charts
I’m relatively new to the site but really like the way Rambus trades. Thing is he’s got big balls…so it’s up to us to exercise more caution than he does. I’ve viewed many opinions last week that saw this coming and opted for caution. I sold out with nice profit but then got hyped up at the thought of it reaching way up…up to 1430 and didn’t want to miss it. Should have stayed out. Still love the simplicity of his charts and way of thinking. No criticism of him at all but when so many others are chickening out so will I next time and keep the profits
RL100
……………………
Hello
i would like to get the 5 day free trial for starters.
I was referred to Rambus directly through an email exchange i had with Jim Sinclair
I am an investment advisor in Alberta, Canada, and asked jim for guidance as we head into 2015-2018 troubles and how i get through it for my clients.
He is an obvious help now for 10 years for me, but wanted more
Rambus was one of his recommendations to search out and follow
Ryan
………………………………..
Sometime last fall I stumbled across a public article of yours and my jaw basically hit the floor. I had over the past couple of years discovered the great usefulness of trendlines in trading, especially the all important backtests, and was continually amazed by how especially well they worked in the PM market. I had never seen anyone anywhere using this kind of analysis. So I was extremely surprised to see your work.
I am thankful for what you have shown as I have learned things even from your public articles. I am far from a seasoned pro and still have much skill development ahead of me on improving my execution and holding onto winners.
I’ve been impressed by what I’ve seen, especially your transparency when it comes to losses and stop-outs. Pretty much everyone I’ve ever seen tries to sugarcoat everything after the fact, and relies heavily on armchair quarterback hindsight analysis. Or they make a call but never say how they came up with it, as if it’s just a random guess. But you have the guts to put your neck on the line and unambiguously commit to positions in real time, and give a methodology to it. That is what real traders do and is seemingly nonexistant among educators. I remember thinking to myself wow this guy is for real!!
I would love to read a market wizards style bio/interview of you. I have so many questions but won’t ask them all… what was the hardest part of successful trading for you to master? Was there ever one thing that put you over the hump into sigificant profit making? How has your trading changed over the years, if at all?
What are your plans for the site? You don’t seem like the kind of guy who desires a large public presence. Hopefully I can learn as much as I can from you before you decide to disappear back into the mountains again! So far I haven’t subscribed because I have learned to isolate myself from all other opinions in order to keep a clear head. For now I just read the public articles and see how they match up to my own analysis but maybe will sub later.
Best to you
Dave
…………………………………….
Hello Mr. Rambus: As an avid follower of Kitco I want to say your weekly articles are by far the most interesting. You have made some great calls. Cheers Robert Stiles
…………………………………
Thank you all for some truly epic posts this weekend … this forum is genuinely something special.
Holy-Grill
……………………………………..
One of the few guys who gets it right, and has been right (bearish) for the better part of 2 years. Refreshing to see work like this instead of the sobbing and wailing “manipulation” drama queens
Soarrows 456
……………………………………………………
All I know of TA or Chartology I learned right here!
And yes, Ive been playing poker for a living for about 6 years now.
I got interested in economics when the Euro crisis got rolling. Trading is just the perfect combination of pattern recognition, competition and psychology to one day replace poker. And what is offered in Rambus’ analysis plus this forum is just mind-boggling
Sir Marius
………………………………………..
CATHERINE AUSTIN FITS (THE SOLARI REPORT)
https://solari.com/blog/thanks-rambus/
Rambus is the on line handle of one of the all-star performers in navigating the precious metals markets over the last two years. Rambus is the proprietar of Rambus Chartology, along with colleagues, Sir Fullgoldcrown and Sir Audept.
My partner Chuck Gibson put me on to Rambus. Chuck’s skills at technical analysis are serious. He thinks Rambus is the charting equivalent of a Kung Fu Master. I think Rambus writes in language that even I can understand which explains why I became a subscriber.
Funny how frustrating things can turn into blessings. I had password trouble and the next thing you know I was e-mailing with Sir Fullgoldcrown, only to discover that Rambus lives in the Ozarks. The Ozark Mountains encompass one of the most beautiful areas in North America and are close to my route traveling back and forth to Tennessee. So I invited Rambus and his wife to dinner and, what do you know, they said yes!
Sure enough, we had dinner at Gaston’s White River Resort last Tuesday in the Ozarks. Here is the report from Rambus himself. What a time! It is inspiring to meet and get to know someone who has spent a lifetime taking responsibility to understand his world and has created a successful business to help others do the same.
There is nothing quite like Southern hospitality. There is a sweet soulfulness to life in the rural South that is wholly unique. Dining with Rambus and his lovely wife reminded me that I was home again.
Thanks, Rambus! Thanks for taking the time to have dinner. Thanks for all that you do for your readers and subscribers
Rambus and Fully and Audept, this Thanksgiving, I am thankful for the work you do. This site truly is a blessing. The consolidation zone since I joined this spring has been frustrating but at least I understand what is happening. I really appreciate the guidance I receive here. Wishing you all the best during this holiday season.
Sir Chap
……………………………………..
Dear Sir/
Michael Campbell is one of Canada’s most respected business analysts. His familiarity as host of the long-running Money Talks every Saturday (30 years), Mike also produces a daily financial commentary. Money Talks is an immensely popular program that has everything to do with money. How to make it, how to spend it, how to grow it, and how to avoid letting it get away.
I am the editor of Michael’s http://moneytalks.net and would very much like to know if I could publish the articles that appear on GoldSeek from time to time. While t is my nature to publish a couple of paragraphs then link to your article on your own site, it would be very nice for our readers is they could read the occasional article in full as GoldSeek’s readers do.
Please let me know. I think your work is exceptional.
Regards
Rob
Robert Zurrer for Money Talks
…………………………………………
First off, I would like to acknowledge the incredible gift we all have at our disposal with the charting skills of Sir Rambus. Since I have become a member of this group the analysis and charting of other newsletter writers and analysts have simply become amateurish to me. We have the insight, expressed through charts, of a higher order than any other single source that I know of. In return, I hope I can contribute any knowledge I have picked up from the school of hard knocks and study of markets
Plunger
………………………………..
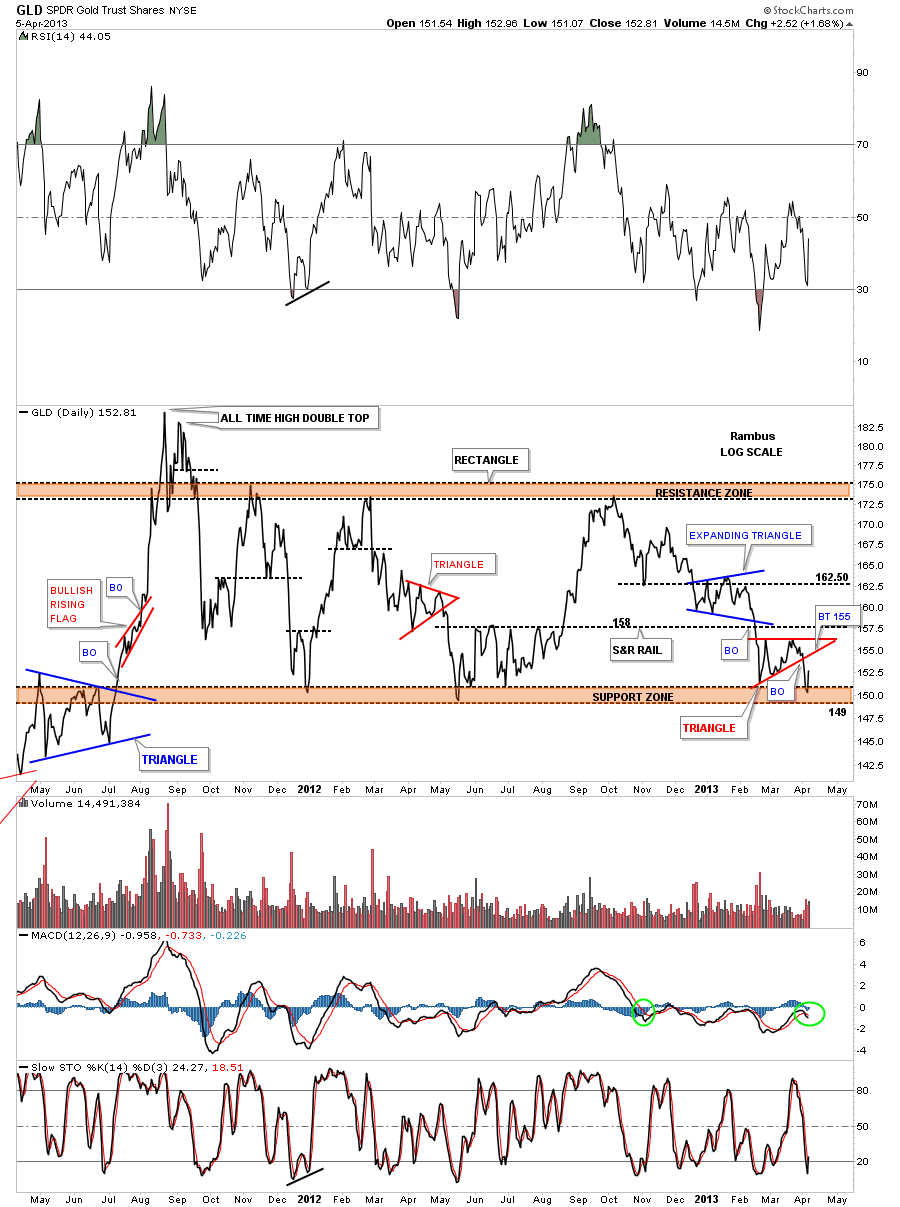
Crisp & Clear…that’s how I would characterize Rambus’ latest analysis. The S&R lines so accurately communicate what the market is telling us. This is the key I have learned from watching markets. One must listen to the language of the markets. Rambus’ quote:
“Whenever you see a gap that trades above an important support or resistance rail listen very carefully to what the market is telling you. Its talking to you but you have to understand the language and with enough time and experience you will be able to interpret what she is saying.”
This is a nugget of gold! Penned by a well seasoned observer of markets. How valuable this line is as opposed to the junk one constantly reads from other newsletter writers who carry a preordained view of where the market must go
Plunger
……………………………………….
Hi Gary
I accept that Rambus is prone to understate his achievements, and maybe joke sometimes about his contributions (“my two cents worth” re US$) but I cannot let it go without comment, that in his Friday night report he only gives his HUI Reverse Symmetry Chart prediction a B+
It was his original report & prediction (made public) that altered the course of my PM investments. As I kept on buying, I (like many others I am sure), became convinced that I was buying a “falling knife” despite all the media & “expert” commentary that suggested PM equities were nearing a bottom & the fundamentals for purchasing remained convincing! I searched high & low, read as much as I could, looking for someone that gave some sort of guideline or road map for the way forward.
My last purchase prior to reading the Rambus HUI report was NCM at AU$16 (which eventually reached AU$9 at the end of June).
After reading the original report many times, and being so impressed with the authority & conviction that lay within I joined Rambus Chartology. It has become one of the smartest & wisest decisions of my life. Since joining there has not been a morning here in Australia that I have not woken up early to access the words of wisdom from Rambus and the many other contributors via the forum.
But the HUI symmetry chart has always been my guide. So here we are approaching the end of October 2013 (which seemed a lifetime away when I first read the report), and we can now appreciate the insight of the original work.
I hope, with the aid of his continued insight, and rare TA skills, we can all profit (an in my case recover some lost ground).
Please pass on my appreciation to Sir Rambus & the team and maybe, just maybe, suggest that his HUI symmetry chart is worth an A+
Regards & thanks
Malcolm
………………………………………………………
The work found here is exceptional, best I’ve seen, for sure. Would like to know if anything is published on determining were the various lines are formed to construct a wedge, triangle or diamond that Rambus uses
Tristate
Go to Timeless tutorials on the sidebar…you have homework
Fully
…………………………………………….
Thank you very kindly for your updates, I think your work is exceptional
and I sincerely do appreciate receiving them when I do..
Warm regards,
Bill Hodges
…………………………………….
Rambus is the mutts nuts, the bees knees, simply the best. I’m surprised at how few people subscribe, I would have subscribed earlier if i’d realised how reasonably priced the service is. I recommend advertising the price a little more.
Most probably assume it is 600$+ like many of the gurus i looked at
Max
…………………………………….
Hello Gary,
I’m currently in Chicago visiting a couple currency buddies who traded for 1st Chi-Chi, while we were at the martini bar within the Nickerbocker Hotel my friend mentioned Rambus focused on the US$ action with his weekend report. I just read the report…..nice to see the ol’guy still see’s the $ as a key driver regarding gold and everything priced in US$’s…
I have great respect for Rambus ……as a true trader will be 100% short Monday yet will be 100% long come Fri if the chart action suggests….I’m sure the blog is lively with what the H is Rambus doing??…..yes some % gains will be lost during the flip from short to long but its the price of having the correct position.
I’ve had drinks with traders in Toronto, Montreal, Boston and Chicago these past 4 weeks and we all agree these are the most difficult markets ever to trade with full positions as the main interference has been the banks of which the Central banks use for intervention…NY based….in the gold and currency markets……nobody is willing to hold large positions and these are very seasoned traders….that speaks volume!!
Continued success to you and Rambus!
CHEER$!
Matrix
…………………………………………….
Hi Gary
A pleasure to meet you. I have “spoken” to you before a couple times where you have helped me out navigating the website.
My forum user id is muslhead.
Anyway, I would like to pass along my appreciation to you and Rambus for what you do. It’s a great service and very educational. As a person enrolled in the CMT program, getting real time experience (and quit a different view as compared to what you are taught in books). I am especially grateful for the furthering education.
Best Regards,
Chuck
……………………………
SA Viking says:
September 10, 2013 at 11:49 am (Edit)
Wasn’t making money until I started following Rambus .. At Home Depot now looking for a wheel barrel ..
…………………………………………………
Rambus – EYE OF THE TIGER!: You are a true “artist” and “stock operator”
September 10, 2013 at 11:33 am / Patty Lowey / 5 Comments
Edit
My hat’s off to Rambus:
the ability to recognize trend changes—————–CHECK (Note: When most others won’t or can’t – sorry MATRIX)
acting on this recognition (and quickly)————-CHECK
identifying targets and risks (BT’s) of existing trends………………CHECK
adding to positions when individual confirmations levels are reached……………..CHECK (Note: while MOST are selling today!!!!)
saludo! Patty Lowey
……………………………………
Personally, I appreciate the respect that the vast majority show to their fellow investor/trader on this site and what I think is Rambus’ superior ability to navigate through very difficult markets using his stepped up brand of technical analysis. His analysis is not obvious for everyone to see which gives this site a distinct advantage. For we all know what can happen when everyone is talking about the same thing in the markets. The unexpected. Simply put, it’s just better here.
gallo
…………………………………………..
I am a new subscriber as of 2-3 weeks ago. I just wanted to let you know that I REALLY appreciate your work. Sir Plunger and I are friends and co workers. He is the one who discovered your site. I have been on the wrong side of the gold stocks since this Spring and it has been very discouraging. So far because of the trades you have posted, I am on my way to being whole again! I ordered the book that was in your bio and plan to learn about the patterns you mention so I can recognize them on my own at some point. Thank you so much for what you do and I look forward to watching your work as we strive to navigate these very tricky waters!
Regards,
Scott (Sir Chapgolf)
………………………………
……………………………..
Thanks, and fantastic gold update Sir Rambus. I continue to be amazed by the symmetry and your analysis. you’re a gem.
Max
……………………………….
Thanks kindly for your detailed reply! Much appreciated. I realize how dangerous the 3x ETFs are for a variety of reasons. Unfortunately I got myself into trouble using these vehicles and am stuck now trying to recoup my losses. I missed NUGT at 5.30 where I was about to buy and as it continued upwards I became frozen unable to buy higher. Big mistake I know. I’ve been an emotional wreck since the crash and haven’t had the confidence being on the long side. Fortunately my large USLV position has given me confidence and a much needed lifeline after this past week. Rambus is incredible. I’ve scoured his previous calls and he is one of the best it seems. I’ve subscribed previously to Gary savage/Toby Oconner (he lost me a fortune), Radomski, and SKI (Jeff Kern). Rambus it seems has been better than all of them. So I am hoping he continues to be successful in his calls because I’ve had the worst luck this past year and need some hope.
Thank you again for your information and advice.
All the best,
John
…………………………………………
RAMBUS CALLED THE BOTTOM– AND GOT DOWN!! AND HE’S NOT WHINING ABOUT THE CARTEL, ABOUT THE ALGOS ARE GONNA COME AND HAMMER GOLD ETC–HE IS FOLLOWING HIS INDICATORS–I GIVE HIM CREDIT
R640
………………………………………..
I was at Jim Sinclair’s meeting in Chicago yesterday and he talked about Rambus charting as something he follows. If it’s good for him I need to look into it.
Thanks,
Kris
………………………………………….
Thanks Fully. Quite a story. When I first joined the Chartology site, my instincts told me this guy is different. Dave’s attention to detail and his methodical presentation of a story told via price charts are unlike anything I have ever seen before. That combined with his low-key (no rah rah pom-pom waving) commentary I found very refreshing for a chartist/analyst in the PM sector. But then I’m a CPA, and most CPA’s could claim to be from the show-me state and everybody would believe them. We work and live with facts and numbers our entire lives.
Numbers
…………………………………………..
If you have a little space for this – which would you currently consider a better play: DUST or DSLV..? And, to also use this opportunity to say that your charts and tutorials are in a league of their own – and I have been through too many various subscriptions to count… none come close.
Pegasus
………………………………………….
Dear Rambus, I have read some of your free articles and value your teaching clarity and attitude. Thinking of signing up, but would like to try the 5 free days first. thank you. R True
Hi Gary, thanks for the access. I read Rambus’ article on Kitco, and was intrigued. I was hooked when Rambus said he felt sorry for people like me that followed GLD up and down. I bailed this am, bought some DUST, and hope I can regain some of what I lost. I had way too much faith in gold, and not enough in the wisdom of the market. I hope I can learn enough from Rambus to keep from going broke. I want to listen to the market and not my own fantasy. Randall
R. True
……………………………
I love your site. I love how you love to teach. You’re a tremendous Captain guiding us in treacherous waters. I happen to be a pilot. Currently a first officer hoping to soon be a Captain like yourself one day:) With your guidance and instruction maybe one day I’ll more aptly steer through the treacherous waters of the investment world as a captain myself.
Chuck6877
……………………….
rambus is tip top and by the looks of his picture, he looks like he can kick ass much ass in a fight as he can with the markets. rambus is my hero and when i grow up, i wanna be like him!
Sir John
………………………………………
Yes, I am willing to keep an open mind and give Sir Rambus a “run.” I’ve already made more in gains (although unrealized) in the last 6 weeks than I did following a GoldBug for 2 years whom I left after he drove me deep into a hole. But it’s not just the gains that have me excited, it’s that they seem to be showing that Rambus’ Chartology is the real deal. I’ll keep watching…
Best,
Lady Zoho
…………………………………………………….
DEREK E
A colleague forwarded me a link to Rambus’ article at Safehaven.
To put it mildly, it was a stunning piece of charting.
Please sign me in for the 5-day trial!
Thanks, Derek
………………………………….
…”Re Delayed Post from Rambus…Thanks I see it now–hey its Arkansas, they are about 5 years behind us anyway-lol
Are you sure Rambus is from Arkansas–didn’t think they could read ,much less be the home of the best chartist around .”
xxx (Name witheld for obvious reasons)
…………………..
JL
Gary,
Please pass along to Rambus/Dave that I continue to be amazed at the clarity with which he sees charts and explains them to us. I feel that I am starting to learn a few things.
……………………………………………………………..
AA…CHUCK
I’ve followed other analysts and so called Chartists since 2004 and I’ve learned more here in a couple weeks than everywhere else combined!
All one has to do is read the tutorials. Rambus is a genius. Seriously. And he’s not afraid to call what he sees. I love it. He’s been so right so many times. I think he’s right this time too and has said from looking back that what we’re seeing was a ossibility.
Everyone is just scared. Understandable.
Even if dust turns into a bust I know I’ve found the right guys to follow into battle For years to come: You Sir Fully and Sir Rambus.
……………………………………
A : Aspengold
Gary:
Although we have never met in person, I’m so proud of what you do and provide to many people like me. Please thank Sir Rambus also. You both are incredible, selfless people.
I don’t read the forum much, but today I did and noticed people were picking on decay of triple etf’s. Your reply on the forum was priceless. Yes, they might decay, but the gains are epic! This is from one of the first Rambus Subscribers.
You Both are the Best!
Sincerely,
The Anderson Family
………………………………………….
B :Hi Gary (Fully),
Saw Rambus mentioned about a month ago by a poster on a message board, but I was too busy with tax season to look into it. After watching my pm portfolio get decimated this last month, I saw his name mentioned again a few days ago and signed up for the 5 day trial to read his writings. Even though I do not have a chartist background, Rambus’ writings are easily understood as are his actionable. Maybe it is because we are both Arkies. *:) happy
Now I need to determine how to start changing over my portfolio from heavily long pms.
Thanks,
David
…………………………………………
C : “Being a new and appreciative subscriber/student to Rambus, I have been studying Chartology eagerly and diligently; learning new and augmenting the old. Having been a student of Edwards and Magee and now of Rambus, I have the following important and consequential dilemma and QUESTION
VV Cephie
………………………………………………………………………
#1…JOSEPH RUSSO (Elliot Wave International) :
http://www.safehaven.com/article/29259/the-fiat-cliff
…………………………………………………
#2…JEFF KERN (Skigoldstocks.com) :
Hi Fully,
I developed and write about the SKI indices for the gold stocks and gold. Your site has probably registered a lot of recent interaction from my website (www.skigoldstocks.com) because some of the SKI forum members have linked your public articles regarding gold and the mining stocks.
I’ve been focusing on the gold stocks since 1983 and have have read a multitude of analysts/chartists. Your analyses have earned my rather rare respect. SKI’s indices are truly unique, but your analysis is so much more widespread to a variety of markets. My public articles started on Kitco on 1/02/2000 and then have continued on www.321gold.com (http://www.321gold.com/editorials/kern/current.html).
I don’t accept advertising on my website and it seems that you follow the same policy, but I would appreciate it if you would provide a link to my website.
Regards, Jeff Kern
……………………………………………………….
#3…JORDAN-ROY BYRNE (The Daily Gold)
I respect Rambus because he makes insights that others don’t find and he’s not a dangerous permabull like many are but he’s also a bit overzealous with pattern identification.
……………………………………………………….
#4…DAN NORCINI (Professional PM Trader and Blogger)
(Regarding Charts from Rambus)
Thanks Gary – it is good work.
Sincere best wishes,
Dan
……………………………………………………………
#5…GREG (Member)
Hi Gary
I continue to be very impressed with the amazing analysis Rambus does
with the charts. Yesterday afternoon’s post about EXK and FNV was
particularly impressive. He’s by far the best chartist I’ve come across
and I’ve been doing this for a while. Many thanks for the work he does
and for his willingness to share it with us at an affordable price. And
thanks to you for running the site and taking care of correspondence
(and probably lots of other stuff too!) My hat’s off to you both!
Greg
………………………………………………………..
#6…BOB (Member)
Hi
Thanks for the reply–this Kern guy most be very smart in that he is impressed with Rambus and his TA–
Yours is the only site that subscribe to–I’ve tried them all over the years and wish I had just stuck with yours–
I just find his analysis amazing but more important pretty darn accurate–
Just recently I referred over a few friend and they both think the same as I do–
They are really impressed and wonder how in the hell did I hear about this guy Rambus .
He is the best kept secret on the internet–
As far as I’m concerned you should be charging more—
Anyway great stuff he is doing—how he does it is beyond me–He is #1 in charting and TA not only with the metals but with all the markets .
as you can see can’t stand him–lol
Bob
Rambus is a genius –that’s all I can say–the best
Bob
…………………………………………..
#6…SILENTMAN (Goldtent Poster)
I’m a lurker and seldom post but follow this site with rabid interest if not rabid opinions. Within the past year I’ve become a Rambus subscriber and follow his charts with interest. Damn me, but I also regularly read Martin Armstrong’s blog. As a chartist, it’s my opinion that Rambus is very useful, but he does not predict; he guesses; there are breakouts and back tests then new breakouts. He does not predict how the market will behave at these targets. He watches the markets with his charts to see how they behave at key junctures. And then he suggests probabilities based on previous market behavior. To me this is useful information.
……………………………………………
#7…WAYNEW (Member)
wow that was fast! thanx 4 your help i’ve subscribed 2 many newsletters over the years rambus chartology is ‘head and shoulders’ above the rest
and i c the accounting department is also………….:)
have a good night! ,………..waynew
………………………………………………
#8…BILL (NUGTKILLA) (Member)
RAMBUS has just TOTALLY elevated my game (and he makes it fun man)
Again, you guys are seriously a GOD send (to me)-I have learned more in less than two months with KING RAMBUS than ever before with all other services combined..?
24/01/2013
Bill
…..Seriously, you guys should get a medal (GOLD of course) for “keepin’ it real” and Thank GOD for your service.
PEACE guys and pass this along to THE MAN 🙂
Bill
…..Excellent work RAMBUS-I am often caught in the “analysis paralysis” conundrum-great job
Bill
PAYDAY (again)…………….
April 15, 2013 at 6:28 am / NUGTKILLA7 /
DGLD, BAM
DSLV, BAM
DUST, BAM
GLD PUTS, BAM
SLV PUTS BAM
BAM BAM BAM
…………………………………………………
#9…MIKEY (Member):
“Thanks !
I came across your site from an email from a free email from Peter Grandich. I read quite a bit on your site and liked the teaching along with the interpretation. Please, always put the cookies on the bottom shelf for us and teach away!”
Mikey
…………………………………………………..
#10…BILL MURPHY (Lemetropole Cafe)
Regarding the Rambus Post
http://www.silverbearcafe.com/private/11.12/buckstops.html
Very Good …will put this in MIDAS
thanks
Bill
……………………………………………………….
#11…DAYADHAR (Member)
Gary,
I occasionally read the postings on gold-eagle.com and a couple of days ago read the Rambus posting. I’ve been reading these gold-eagle postings for years, but on reading Rambus I felt I need to join. And the price is reasonable, so glad I did. Wish it would have been a few months ago, I can’t complain since my portfolio is up 24% since Thursday (I have a lot of options in IAG, GLD, GDX, and GDXJ. Wish I would have known about those U etf’s (USIL, UNGT, etc.). Just read about them on a Rambus posting last night.
Peace,
Durr (Dayadhar)
…………………………………………………………
#12…SINBAD (Member)
Fully, I want to thank you for your replying when I wondered where Rambus was. Now I know he must have been commuing with the charting gods. Due to paying attention to his charting my accounts are screaming higher. I’m also learning a lot about trading what I see, not what I feel or think.
Chris
…………………………………………………………..
#13…ONTHEBEACH (Goldtent Member)
about Rambus
-> Posted by onthebeach @ 1:01 am on September 6, 2012 :: Edit post
Loved getting the photo of Rambus. Very handsome gentleman with loving eyes full of life love and wisdom. Thank you Rambus for all you do and I’m heartened to have a photo of you
……………………………………………………….
#14…BRENT (Member)
“Getting ready to get volatile”–wow! right call again…”
We salute you Sir Rambus!
Thanks for your hard work and have a much deserved restful weekend.
As a “die hard” gold bug; Sir Rambus saved me from myself last fall. I shall be forever grateful. His thesis is “fundamentals are baked into the charts”. Emphasizes trends, channels, triangular formations, and historical perspective. Excellent commentary and analysis. Combine his perspective/analysis with proficient day trading skills–all I can say is “BOOYAH”!
………………………………………………….
#15…RDI (Member..twice)
Just signed up tonight–used to be a member but long story short I’m back because with out a doubt you are the best in my opinion .
………………………………………………….
#16 JL (New ) Member
I saw your post on Market Oracle. I read a lot of their posts, and some are better than others.
I really liked your post on rising wedges – but I especially liked that you seem unattached emotionally to the instruments that you follow. It seems that others are not so unemotional, and that negatively affects their interpretations.
I was looking through the site after I signed up today, and I cant see any recent interpretations of S&P or Crude – both of which I like to follow.
Can you point me to your current tale on these? Both seem ripe for some big upcoming moves.
……………………………………………………………….
#17 JOHN (MEMBER)
Rambus and his work is really incredible and if i haven’t read all i have now seen, especially after today, how truly gifted this man is i wouldn’t believe it. Rambus is the best i’ve seen, for what that’s worth
Rambus, if you read this, you once said recently that you don’t know why when some people have a winning position, they look to sell. they can’t just sit tight. i can tell you why i do. because i’m so used to sitting and losing, having held gold stocks for “the mania freakin phase”. when i traded months back, like now, i just feel the need to rip that cash right off the table before it’s taken away. that’s the only time, other than buying physical, that i’ve done well.
i’ve been chartolified by the king of chartology. i’ve made every excuse, begged and pleaded that what rambus says isn’t true about the pm’s. i lose.
……………………………………………….
18 NUGTKILLA (Avid MEMBER)
Team RAMBUS-Great plays, SLICK service and you are a PHENOM IMO….
April 5, 2013 at 4:22 pm
Win, lose or draw-one has to admit that you elevate everyone’s game-keep up the great work guys 🙂 You ARE (beyond a shadow of a doubt) the best darn bang for the buck-anywhere!
……………………………………….
19 Anonymous Poster on Yahoo Board
RAMBUS Chartology-google it-become a member-He called ALL of this-ALL OF IT and he walks you through EVERY trade…
……………………………………………………………
20 E W (via email)
I enjoy your professional chart analysis very much which I have read on Goldseek.com. I have used charts and technical analysis almost exclusively since 1990. The price action tells me everything I need to know. I also read your comment about bullish rising wedge and know this by another name as rising scallops. Rising and falling scallops are great indicators for predicting price action.
I truly enjoyed reading you article on Goldseek.com.
……………………………………………………..
21….UNIGOLD (Member)
The Rambus 1390 gold call looks spot on! What kind of food and water does he have in Arkansas?
I have not been happy the last 3 months with PM’s and it has upset me that my favorite chartist has seen only red. However, if the last 2 days are the end of this hellish experience I suppose I can limp along.
Regardless, I am certainly happy to have been an early subscriber to this extremely talented and unwavering chartist!
Please pass this on!
B M (uni-gold)
………………………………..
22…..Dr. Im (email)
(Apocalypse Now ? ) Great work. Eye opening. If a picture’s worth a thousand words as the old saying goes …
what is Rambus Chartology worth I wonder. Thanx.
…………………….
23…..BLU (New Member)
came across your site on SeekingAlpha. You were mentioned on
a comment to an article on gold. I did some research and liked your
charting skills and analytical take on the stocks. I will consider joining
at the annual level if all goes well. I’m looking to get familiar with your
site and your analysis.
Much appreciated,
Blu-
……………………………
24 Mestro (Member in Waiting)
Are you still offering a 5 day free trial of your service? I am interested in your opinion of current crude oil prices. It appears that your skill level in reading the markets is unmatched.
I never thought the gold market could be more dangerous than the Federal Reserve. Thank you for your assistance.
……………………….
25 SIMON (Member in Waiting)
I must say I’m very impressed with Rambus’s output, both the quality (which I was already aware of) but now the quantity. Does the guy ever sleep?
………………………………………..
26…JAKEB ( MEMBER)
Rambus:
I have been following you since November and I must say I’m impressed by your skill. As an “old timer” I have paid “tribute to the so called best” thru the years until I realized a flip of the coin was just as good and a lot cheaper than paying for their advice. Since then I have been able to learn enough to become very comfortable in my old age. I do this now for fun and hopefully profit. I hope to learn some new skills following your lead.
My point is that charts are a reflection of our emotions and attitudes. As such they can and I believe are manipulated to a degree in the short term when it serves a purpose. I feel your approach to charting has in a sense unveiled some of the deceit designed to harm us and I thank you for your efforts. I was aided by your abrupt turn in gold as I lightened up on positions. I will be watching closely as I think at some point you will declare the “gold bull” is resuming as I know it will.
I apologize for deviating from the business at hand but I did want to thank you.
Jakeb
……………………………………………………………………..
27…LEOLA5 (Member)
Thank you for the welcome. Yes, I discovered Rambus from reading his contributions at the goldseek.com site. I’m really looking forward to learning to become a more “serious” investor. There are many things that don’t make sense to me in the “markets”- especially what’s happened in the precious metals area.
I’m very excited about choosing your service.
……………………………..
28….Sir David (Neophyte member)
Sir Rambus,
I am in awe at the charts and brilliance, but as I am new to the round table, I often do not understand some of the terms and am unsure whether you mean the HUI is going up or down or gold is moving up or down. I am maybe the only simpleton in the court but definitely need an occasional line of explanation.
Many thanks
Sir David
……………………………………….
29…BRENT (Member)
Thank you for the excellent update last night Sir Rambus…
Just in time for the “ride of a lifetime
As a “diehard goldbug” Sir Rambus saved me from myself last fall–I shall be forever grateful.
30…DAVID (Member)
Great Post Sir Rambus
May 15, 2013 at 9:44 am / David Kanani / 0 Comments
Edit
Sir Rambus
Great post on physical gold and silver which is my main interest.
Fantastic!
You have slain the dragon of ignorance.
Helps explain alot in simple terms.
I remain your humble and obedient investor
David
31…JM (New Subscriber)
Hello Fully, I was at TFMetals report and somebody posted a link to your weekly letter………I took a look at it and liked the approach to reading the charts………I have been looking for a technician who is not biased towards gold,silver and the miners………..just analyzing what the charts are telling us, not what we want to hear……………Jeff.
…………………………………
Last Word goes to Rambus
January 27, 2012
“Today were going to look at the HUI from top to bottom. Its been a long two year drought for most of the precious metals stocks. When silver had it’s near parabolic move higher last year the stocks barely budged and even declined in many case. Same thing when gold had it’s big move later in the year. The frustration felt by the precious metals stock investors was beyond frustration. How could gold and silver have such big moves and the underlying stocks actually go negative. All I can say its the nature of the markets to make life as difficult as possible, to wear one out with frustration, and then when the investor finally can’t take it anymore he quits in disgust blaming everybody and everything for his failure. Remember we are competing against the best and brightest investors around the world who want your money. This is a game where only the strongest and smartest survive. So keep those thoughts in mind the next time you put your hard earned capital in markets. If it was easy everybody would be millionaires and we know that can’t happen no matter how smart we think we might be.”
……………………………………………………………………..
Rambus Chartology is gathering a nice following from 26 countries and counting…fun to watch it grow
http://rambus1.com/
Compiled by Fullgoldcrown (Gold Permabull turned Darth Trader)
…………………………………………………….

Ditto that Sir Marty, my last 2 yrs kinda parallels yours.
The subscription to Rambus Chartology is my best investment ever!
Nuss2
Totally agree. Best investment ever !
………………………………………………………………..