Fully
How do I start. I can’t believe you day traded the model portfolio yesterday. I thought we had a game plan that we were going to use. Here we are the first day out of the H&S and bingo its time to day trade. I don’t get it Gary. Did your emotions get the better of you? What changed from last week when everything you tried to trade went against you? Unless you can tell me that the devil came to your house this last weekend, for a drink, and you discussed with him that you wanted to be a day trader for your soul then that’s a different story. But if the devil didn’t come to your house for your day trading soul then there’s a problem. Gary your not a day trader, I’m not a day trader and there are damn few day traders that can do it day in and day out. Discipline and having control of ones emotions are the two biggest factors for being successful in the markets. What yesterday’s trade will do to you is embolden you to try it again and again because you got lucky. But I can assure you it won’t work. What you did is called sabotaging the trade. What if ZSL kept going up and you couldn’t get back in at a lower price? Do you chase it higher, do you wait for it to come back down or do you stay out altogether because your afraid now that it has gotten away from you. I’m trying to be gentle Gary but if we don’t have any discipline and a game plan to follow, for the markets, its like taking candy from a baby. If you feel the compulsion to day trade could you please do it with just 25% of the model portfolio? I hope you take this as constructive criticism because that’s all it is. What strikes me as odd Gary is how you can sit on a losing gold stocks for years and not trade it and then once the model portfolio starts to show alittle gain its time to day trade. Please tell me you made a pact with the devil so you can day trade and we’ll all be rich beyond our wildest dreams. Your brother in the Ozarks….Rambus
Category Archives: public
Weekend Report…..Picture Perfect
Last week I showed many H&S patterns that were still in the developing stage of their right shoulders. This week we got the neckline breakdown from their H&S topping patterns that is suggesting, in no uncertain terms, that deflation is going to rear it’s ugly head. Just about every index I showed you in the last Weekend Report have broken their necklines. To make this breakout “Picture Perfect” is for a small counter trend rally back up to the underside of the necklines which would be the last bit of work that needs to be done before the next impulse leg down gets underway in a big way. This would be a good place to reread last weekend’s report on all the H&S patterns that were still trading above their necklines. http://rambus1.com/?p=1583. As this weeks price action was so critical to the big picture, we’ll look at those same H&S topping patterns, from last weeks report again, so you can follow along and see the breakout process up close and personal.
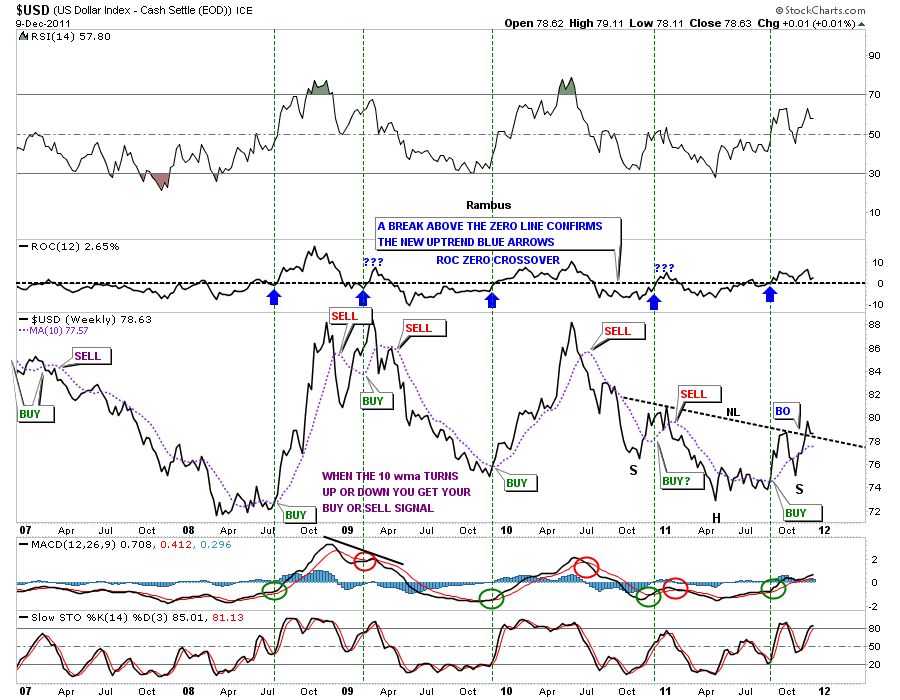
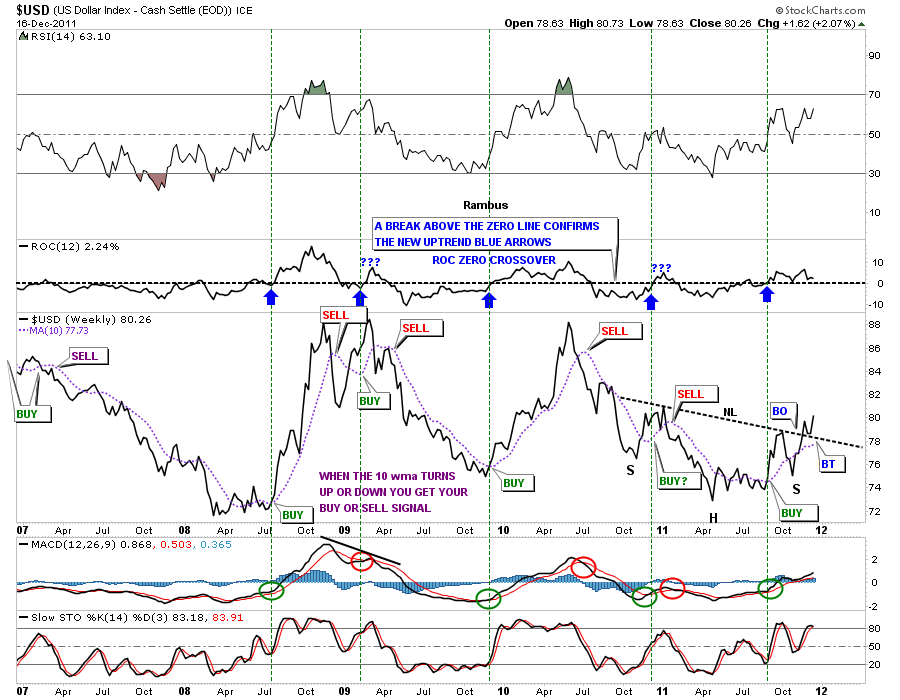
We’ll start with the all important US Dollar index that is most critical in understanding the big picture. I used a line chart that showed how the dollar had already broken the neckline and was in the process of doing it’s backtest. So far its picture perfect.
US Dollar weekly line chart with H&S breakout and backtest complete.
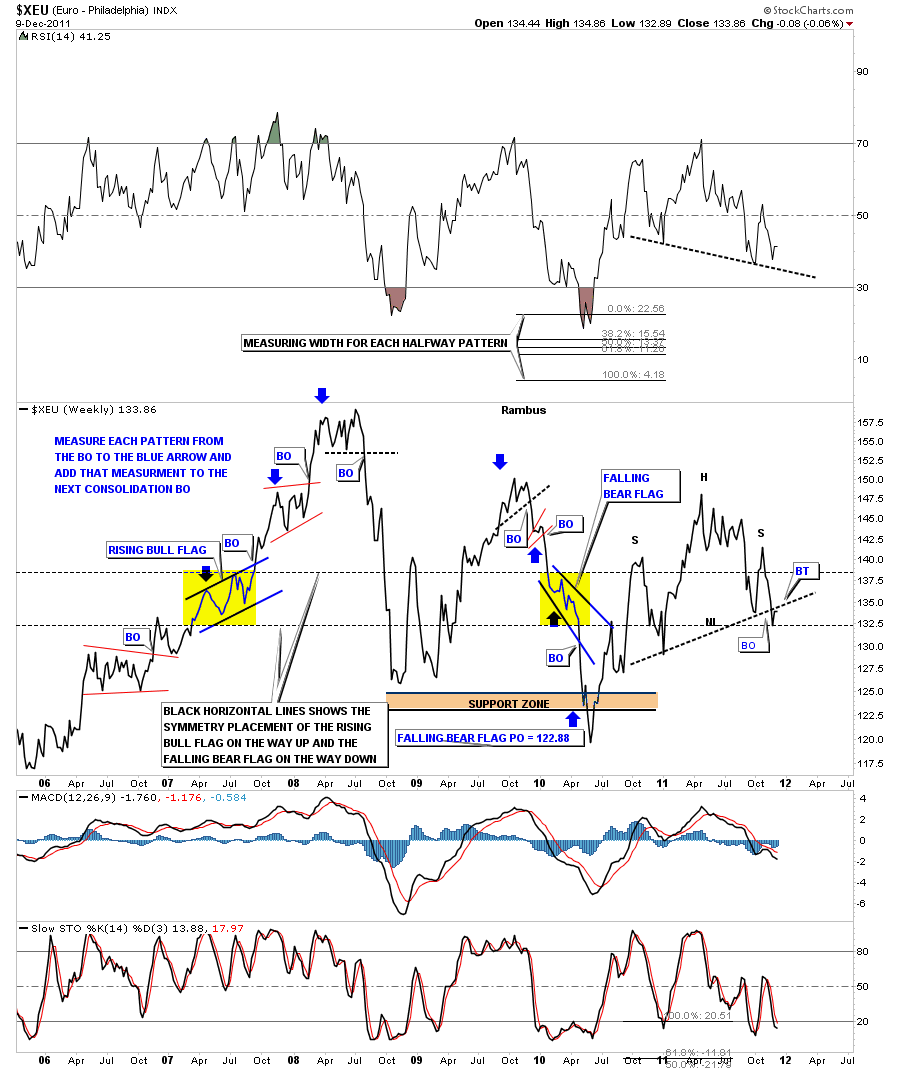
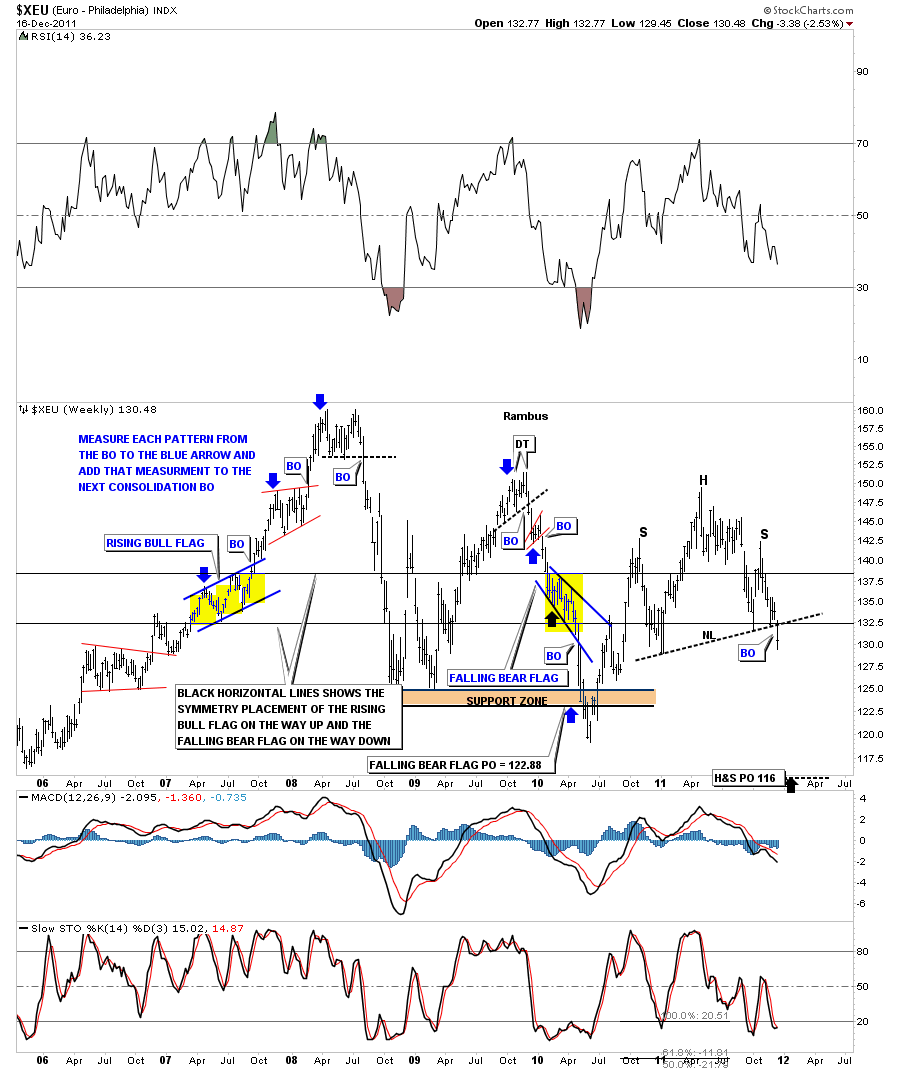
Next is a weekly look at the Euro and it’s inverse look to the dollar. If the dollar is putting in a H&S bottom then the Euro is putting in a H&S top. This bar chart shows this weeks breakout from the H&S top formation. One nice long bar through the neckline says it all. The only question now is if we’ll get a backtest to the underside of the neckline.
Xeu weekly H&S top breaking the neckline.
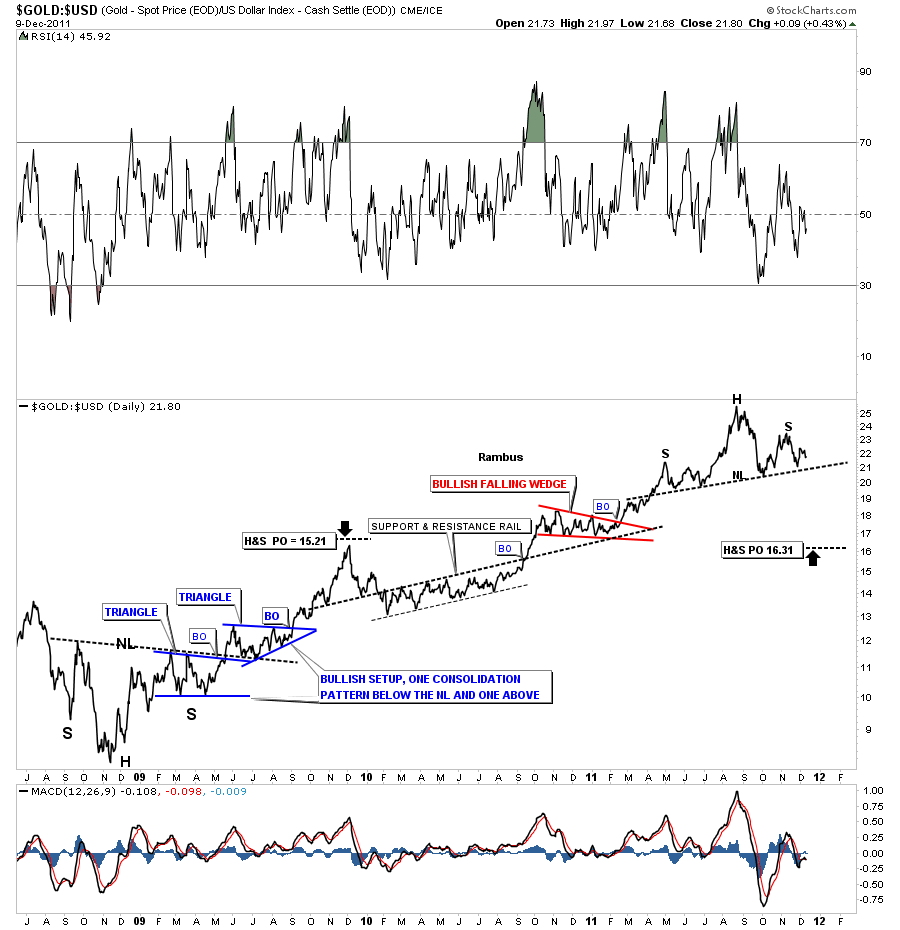
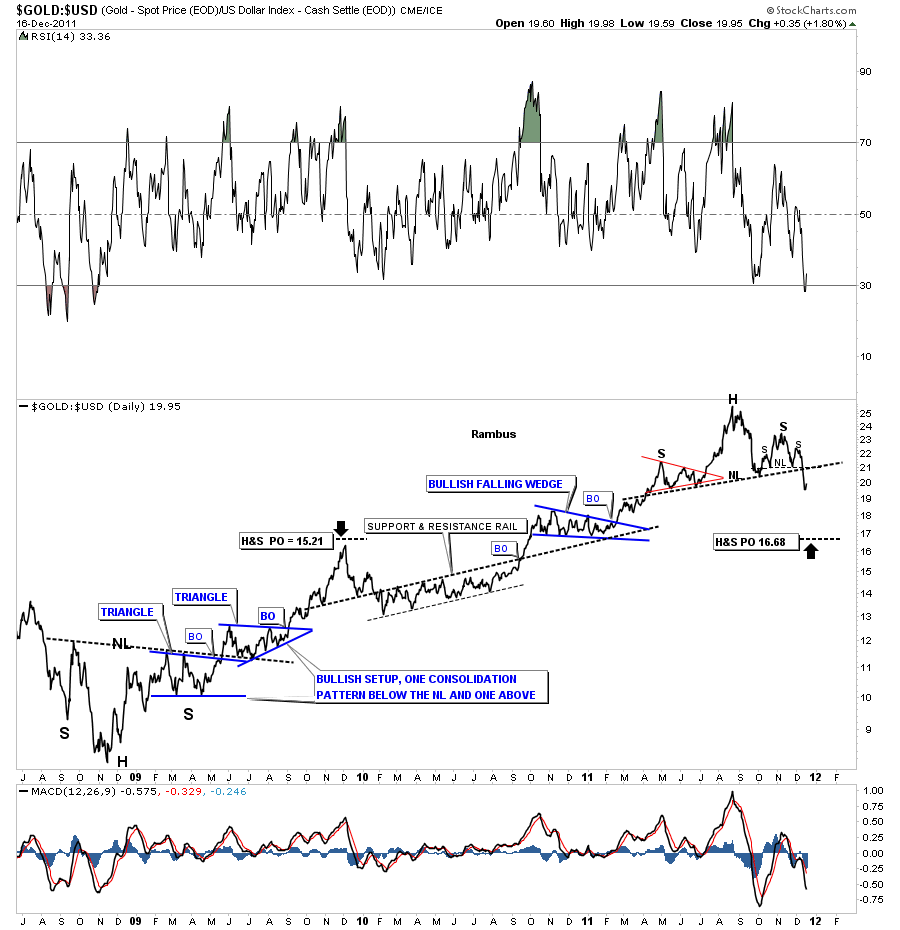
I have been showing the gold to the US Dollar ratio chart for awhile now. Last week I said it was a very ominous looking chart and that if it broke the neckline, to the downside, would not be a very good sign for gold. As you know gold fell hard this week against the US dollar which broke the neckline confirming the H&S pattern has topped. We could now see a short term rally to the underside of the neckline as it’s backtest before the next impulse leg down gets started in earnest.
Gold to the US Dollar ratio chart showing the breakdown from the neckline.
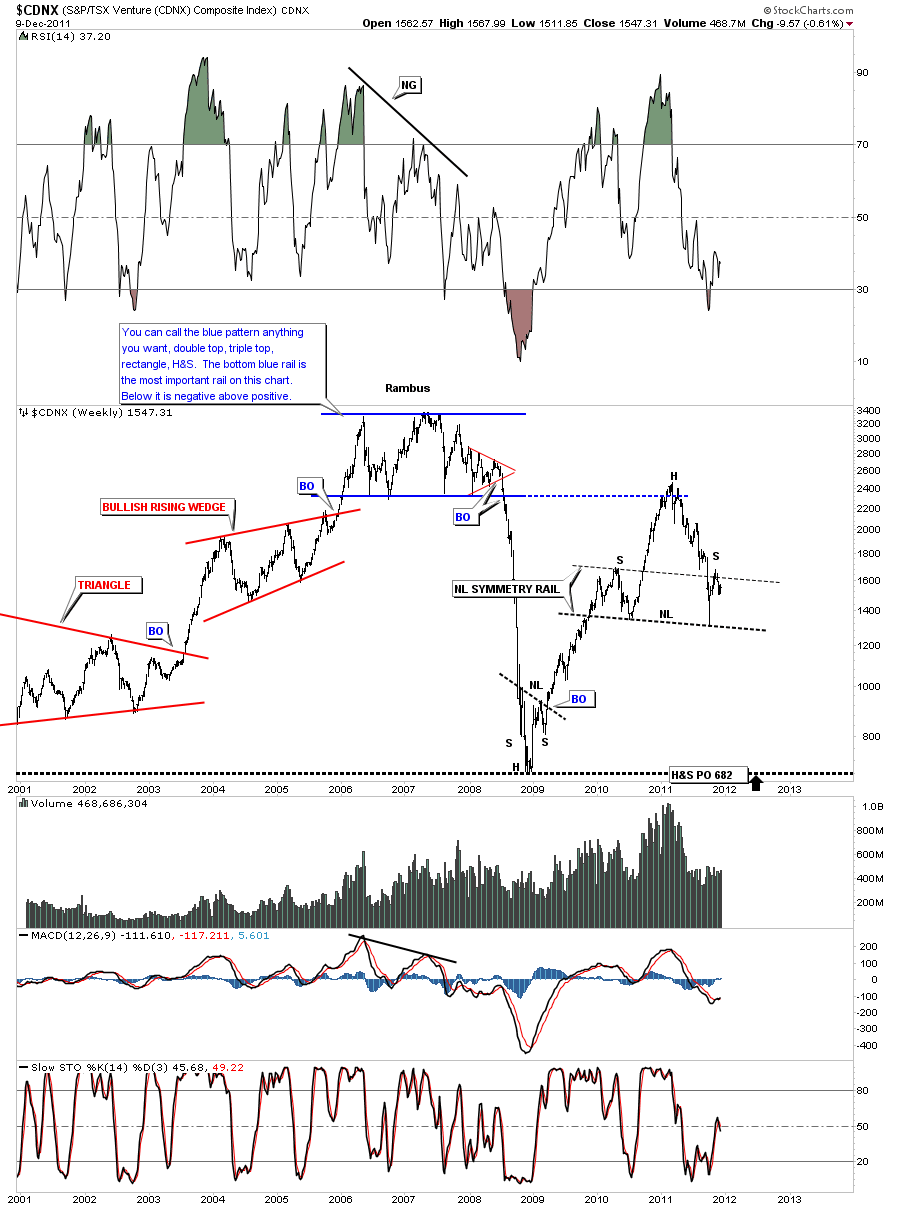
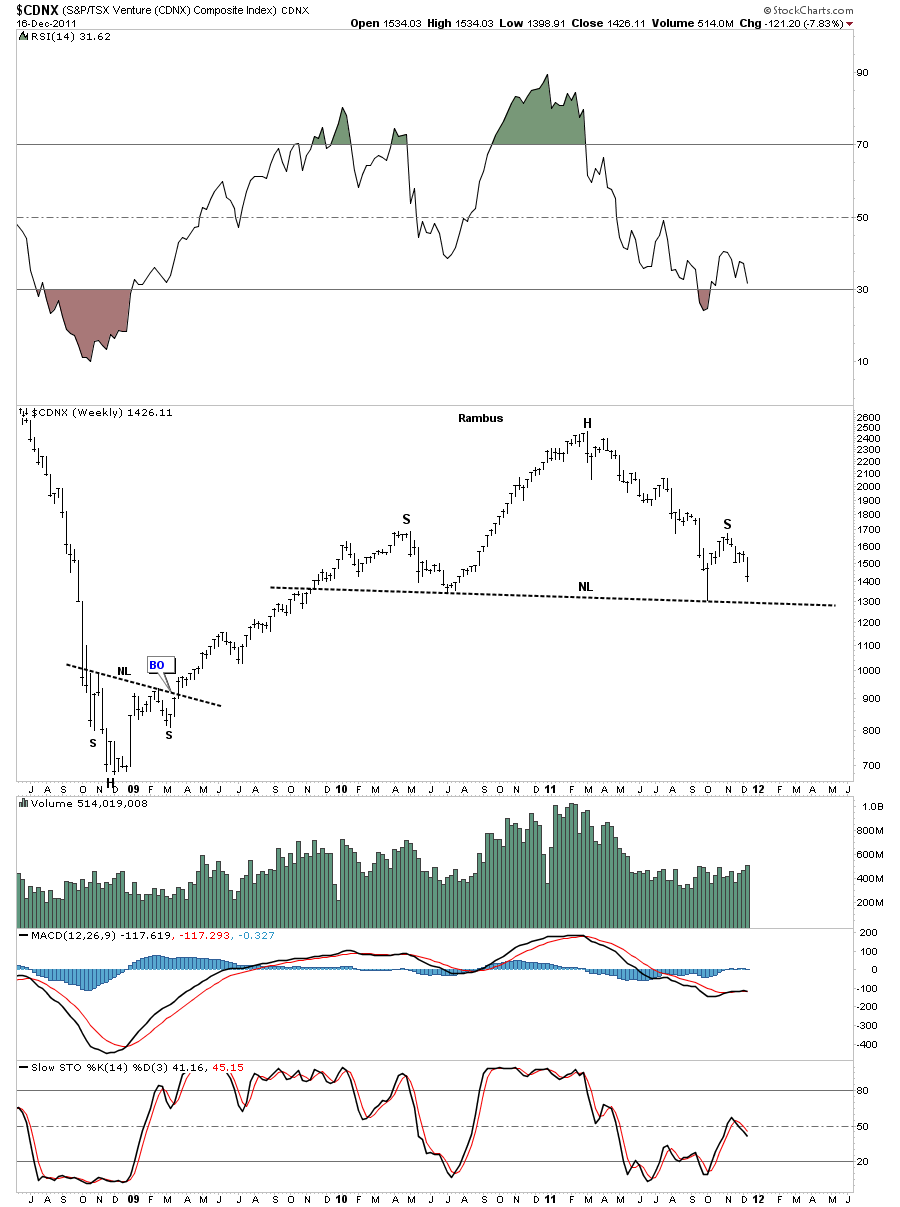
The next chart is the CDNX index where many of the small cap mining and oil companies are located. You can see the CDNX is still building out the right shoulder of it’s H&S top. If you own a bunch of small cap mining companies this is a good chart to keep a close eye on because it led the precious metals stocks lower back in the 2008 crash.
CDNX small cap index working on the completion of it’s right shoulder.
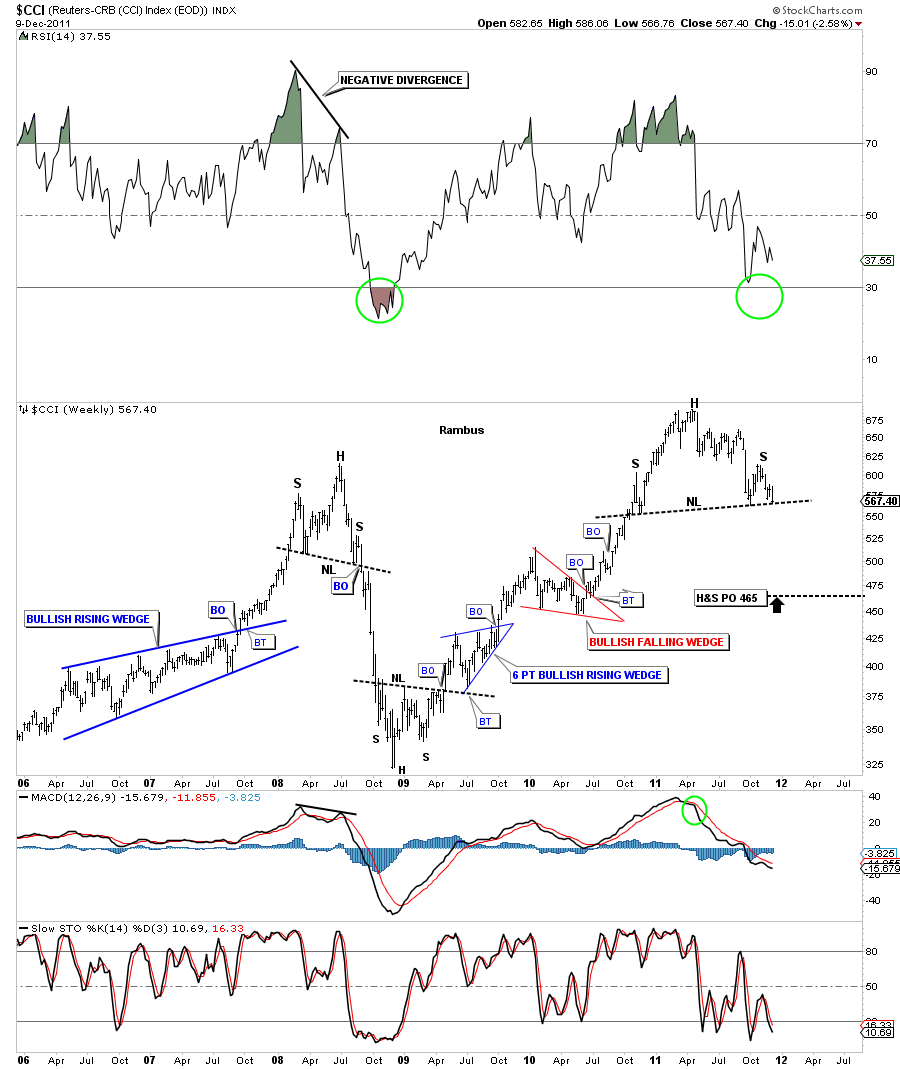
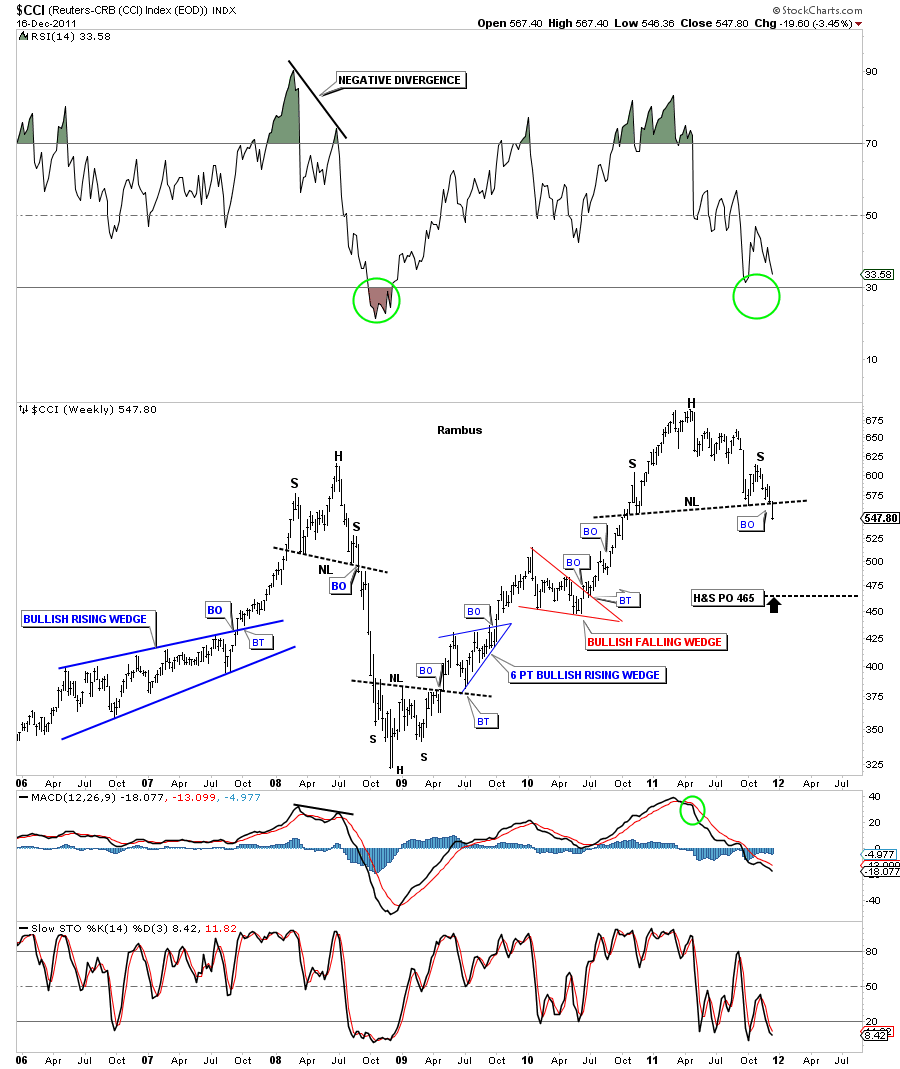
Last week the CCI commodities index was sitting right on the neckline. This week you can clearly see it has broken support at the neckline. I hope I’m painting a clear picture of what is unfolding right before our very eyes.
CCI weekly H&S breakout. Will we get the backtest?
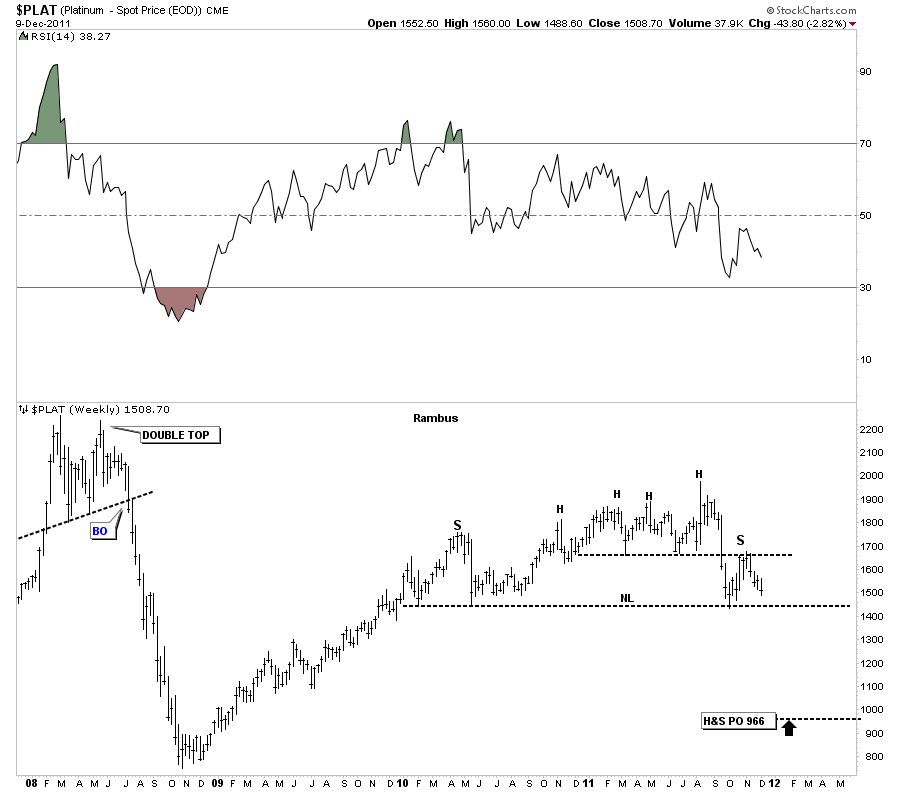
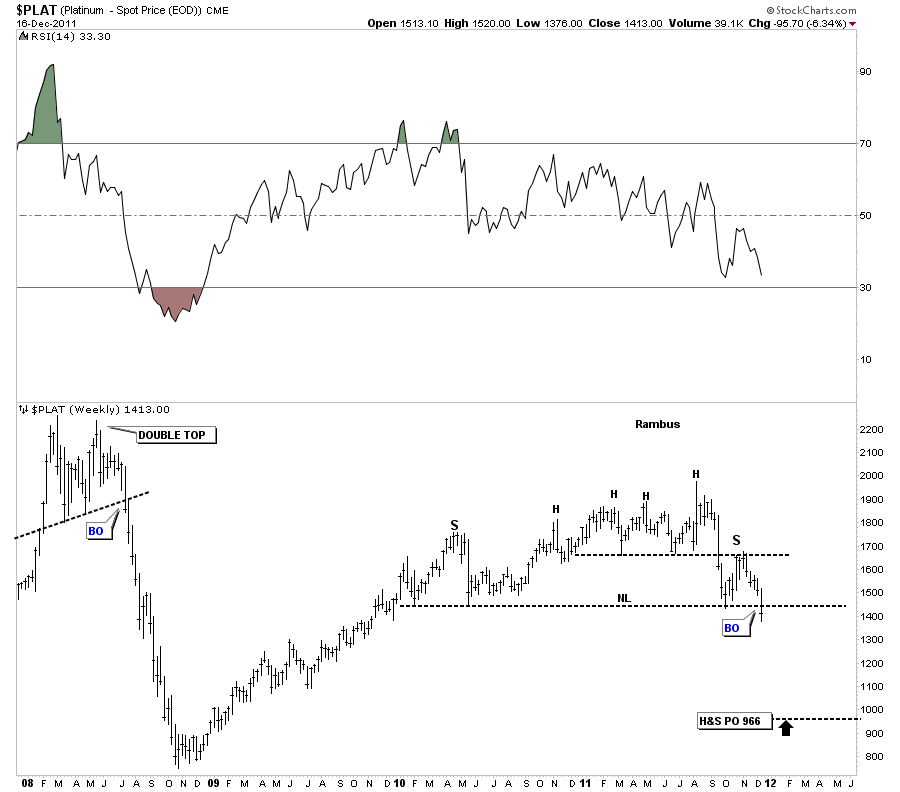
Platinum was also sitting above it’s neckline as last weeks trading ended. This week you can clearly see the neckline was broken. If Platinum is breaking down so must the other precious metals. Again you can see where there is just a little wiggle room for a backtest to the neckline.
Platinum weekly H&S breakout.
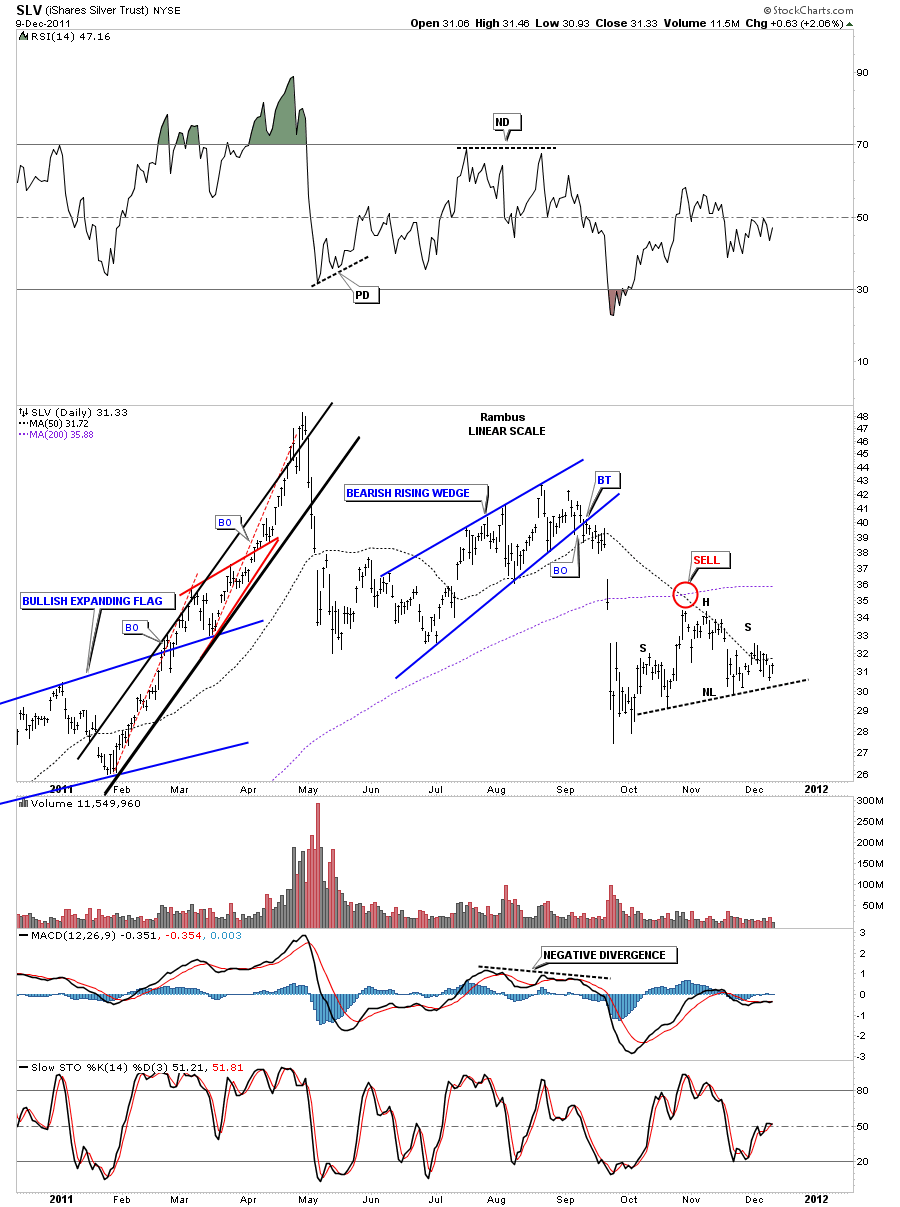
Lets now focus on silver and gold to see how this weeks price action showed the completion of several H&S patterns. First, SLV broke it’s small, right shoulder H&S pattern on Tuesday of this last week. You can see the huge gap that formed on the breakout move. Here again you can see the potential for a backtest to either the neckline or just high enough to close the big gap. So alittle strength at the beginning of the week should be expected for the backtest move. Should be expected but not guaranteed.
SLV daily H&S breakout of right shoulder.
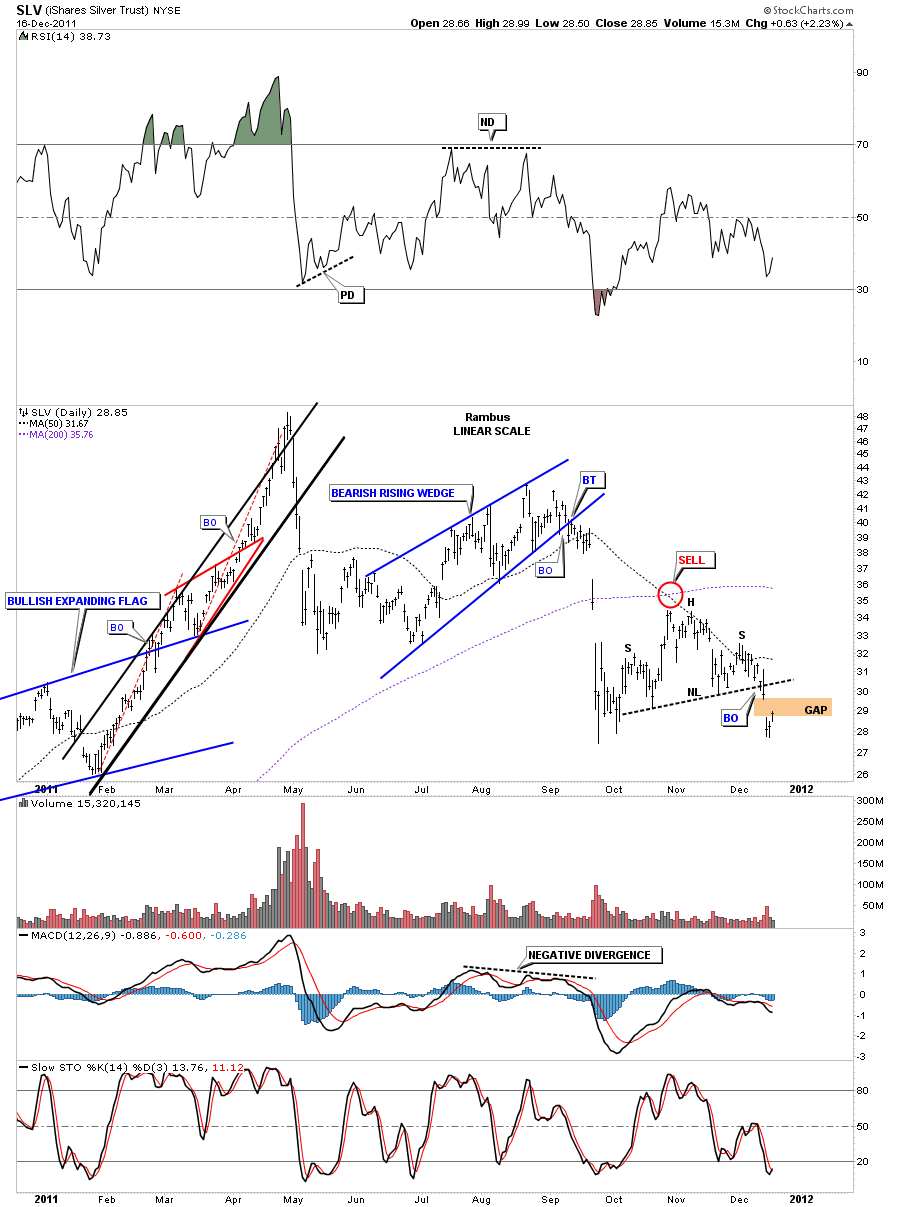
The daily chart for silver shows the breakout from the small H&S, above chart, that formed the right shoulder of the much bigger H&S topping pattern. What this weeks action did was break two H&S pattern necklines, the small right shoulder and the big H&S top neckline. A backtest to 31.50 should offer stiff resistance if we get it.
Silver H&S top with 2 necklines being broken this week.
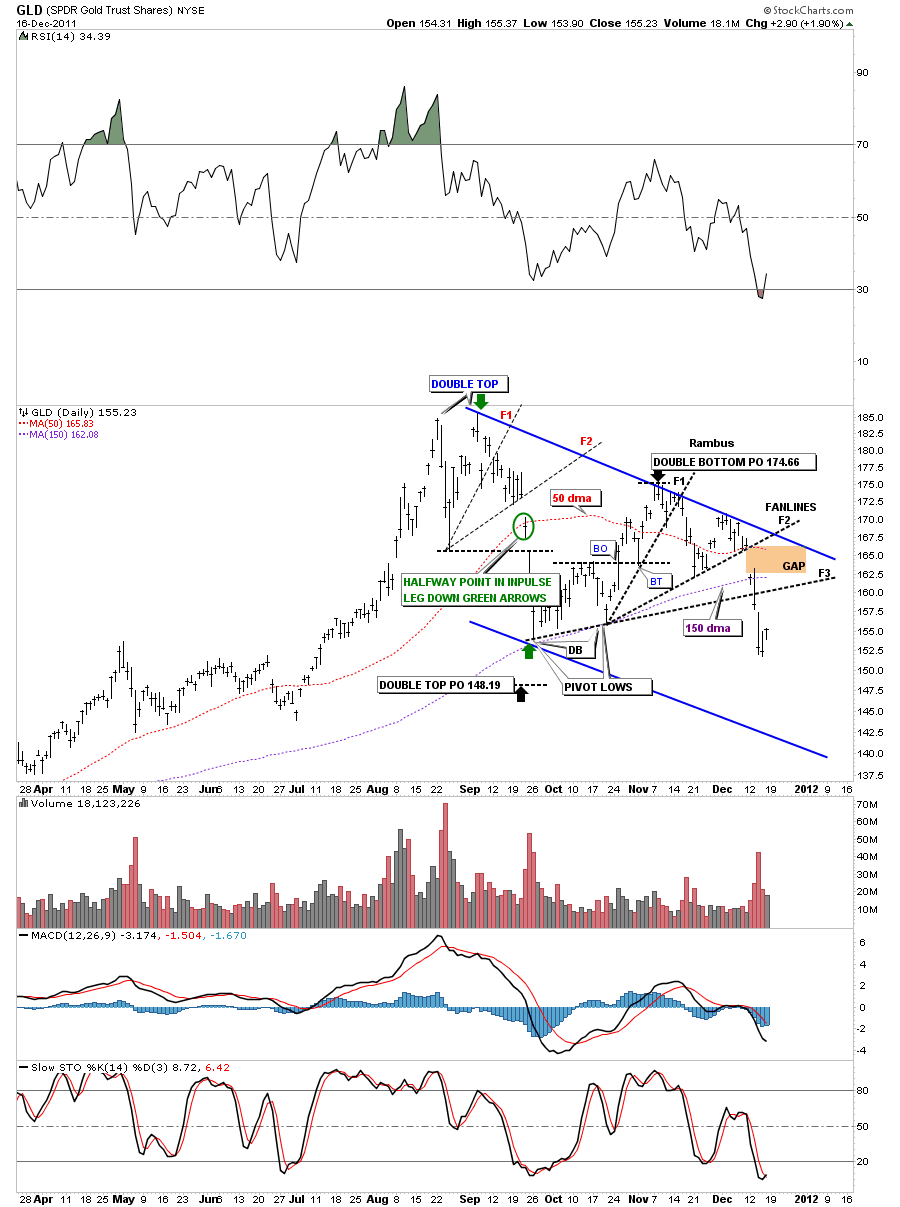
A week ago I showed this chart on Gold showing the fanlines. At the time we were sitting right on black fanline # 2. You can see the big gap that accompanied the breakout from fanline #2 on Monday. The third fanline didn’t offer any support as we plowed right through a potential support rail. If we get any type of counter trend rally this week I would expect that fanline # 3 would act as resistance.
GLD daily fanlines.
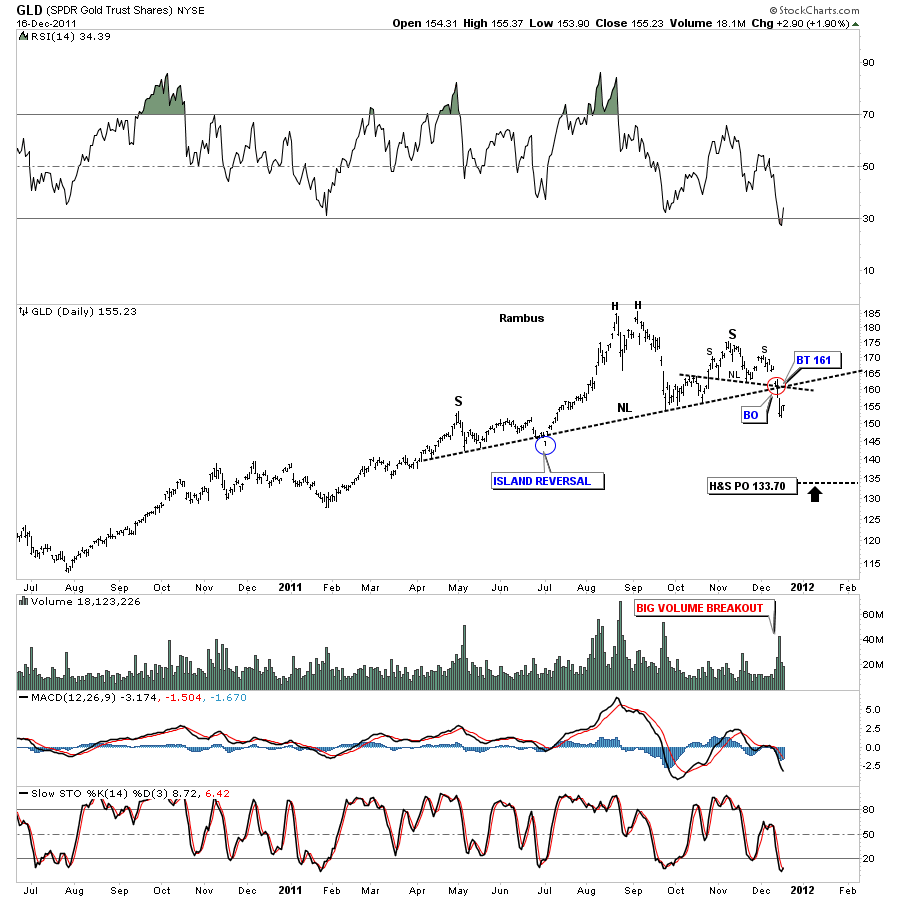
One last chart for Gold. You can see that we could be building a serious H&S topping pattern going all the way back to May of this year. As with silver, GLD formed a beautiful small H&S right shoulder, of the much bigger H&S pattern. I put a red circle around the breakout of the two necklines. Any little counter trend rally to backtest the necklines should be stopped at the 161 area which would be a good low risk entry point for short.
GLD daily H&S breakout and possible backtest.
So the bottom line is that last weeks big decline for the risk off trade is starting to confirm that a serious bout of deflation maybe starring us directly in the eyes. Its no coincidence that we are seeing so many H&S tops being completed. Alittle strength this week should be expected that will put the last nail in the coffin showing that deflation and the risk off trade is how you want to play the markets going forward. I’ve said before and I’ll say it again its time to protect your hard earned capital by whichever means necessary. Keep in mind that markets go down alot faster than they go up.
All the best…….Rambus
UUP and XEU neckline backtest
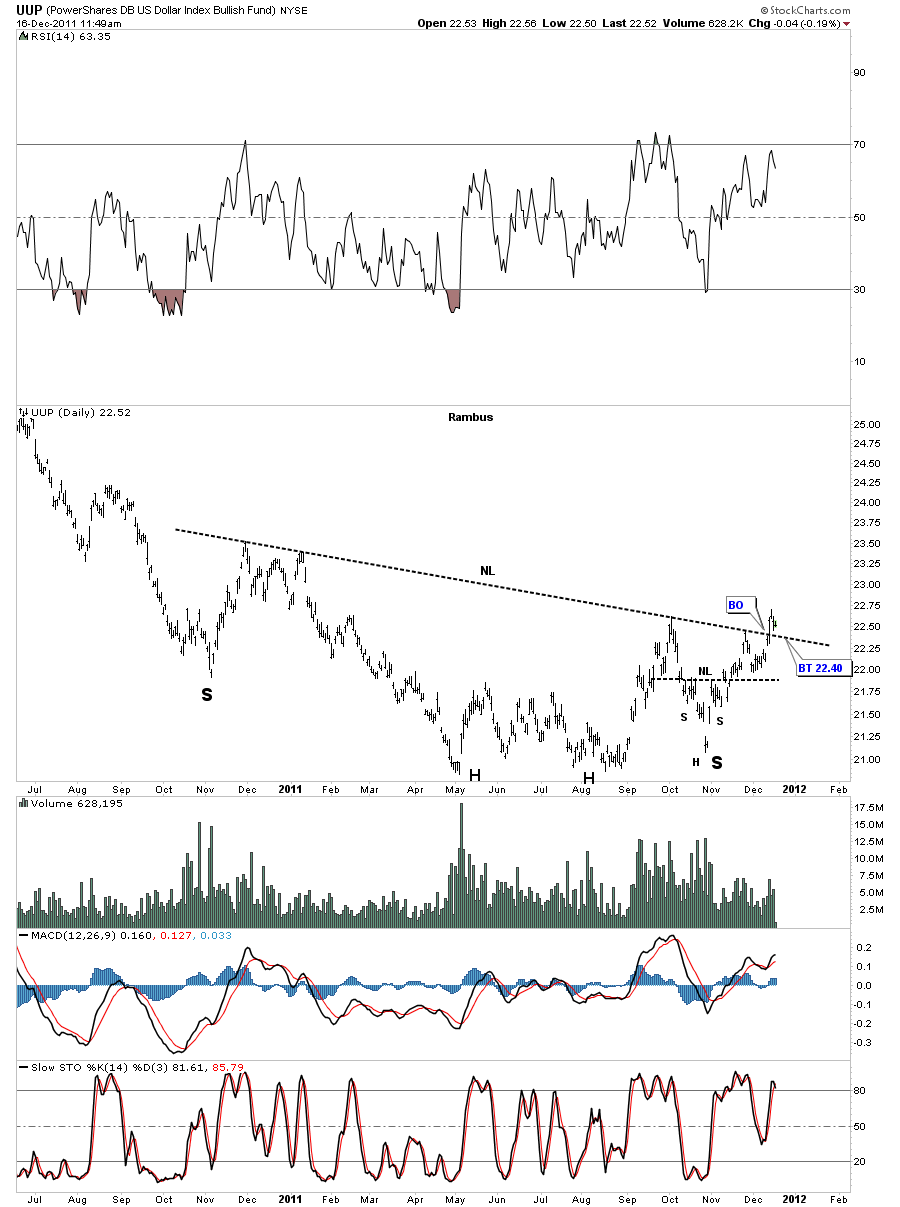
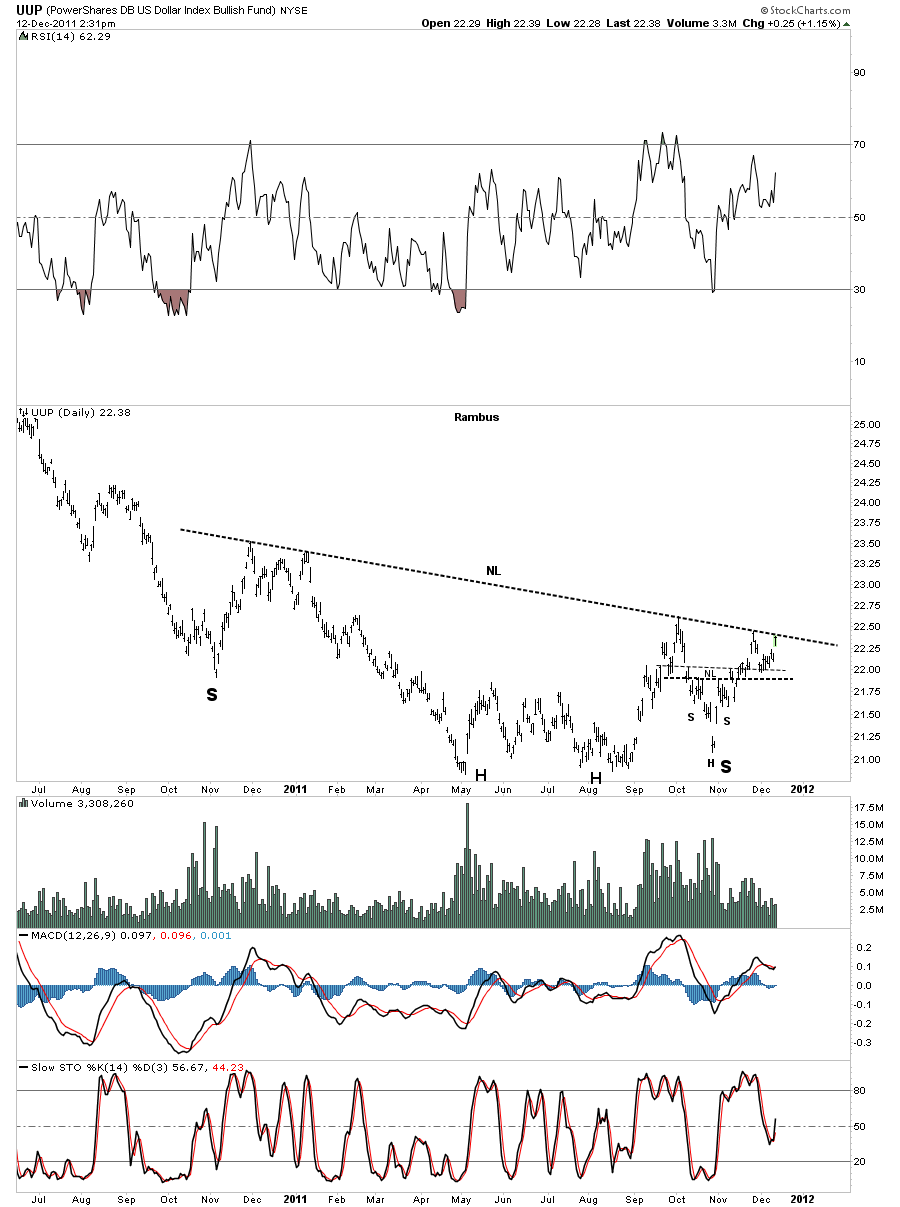
With so many H&S patterns breaking out this week I always look for the backtest to the necklines as a low risk entry point. The UUP daily chart shows this weeks breakout of it’s neckline and it looks like we are in the process of getting our backtest. It looks like 22.40 will do the trick which is about 10 cents below today’s price. I really want to see the backtest fulfilled just to confirm the big one year neckline is HOT.
UUP daily H&S breakout and backtest.
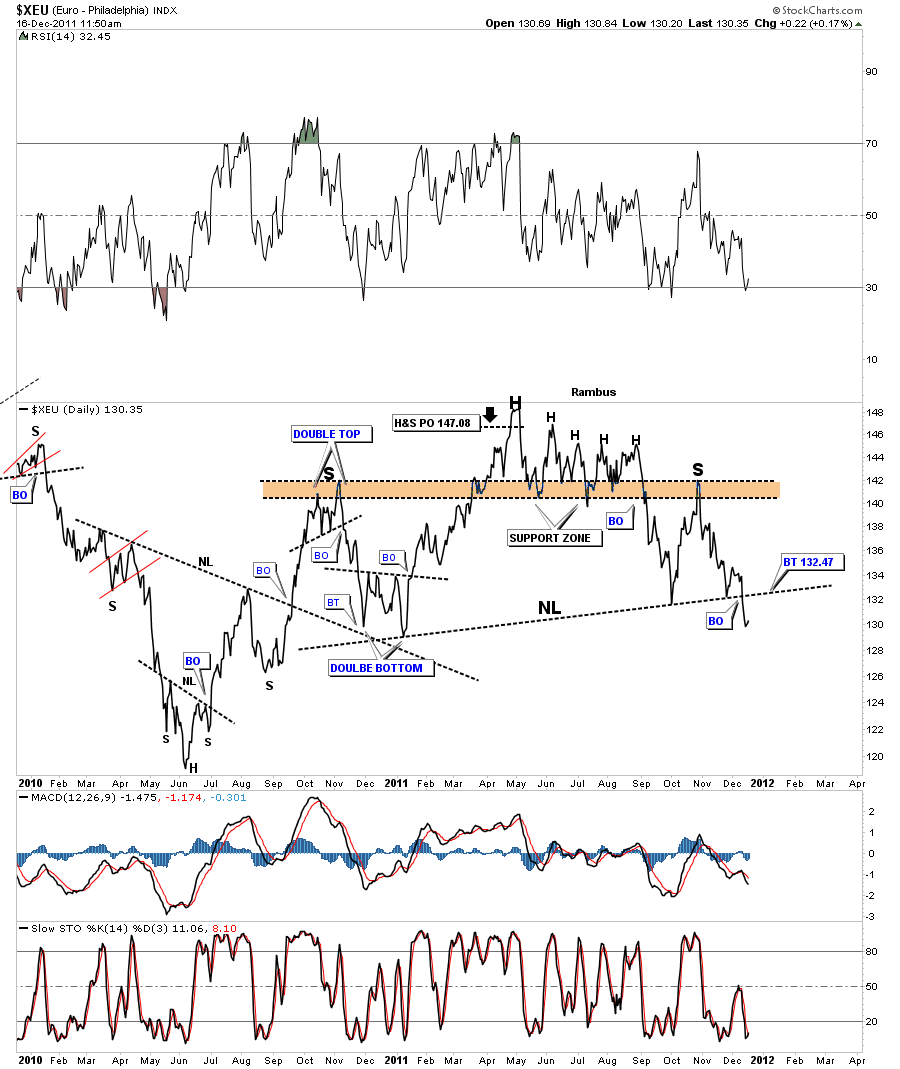
If the dollar is breaking out of the top of it’s neckline then the XEU is breaking out of the bottom of it’s neckline. As you can see the XEU has broken down from it’s H&S top, this week, and could be ready to backtest the neckline from below. Again I would like to see the backtest completed to confirm one more time for me the neckline is HOT.
CCI and CDNX H&S breakout
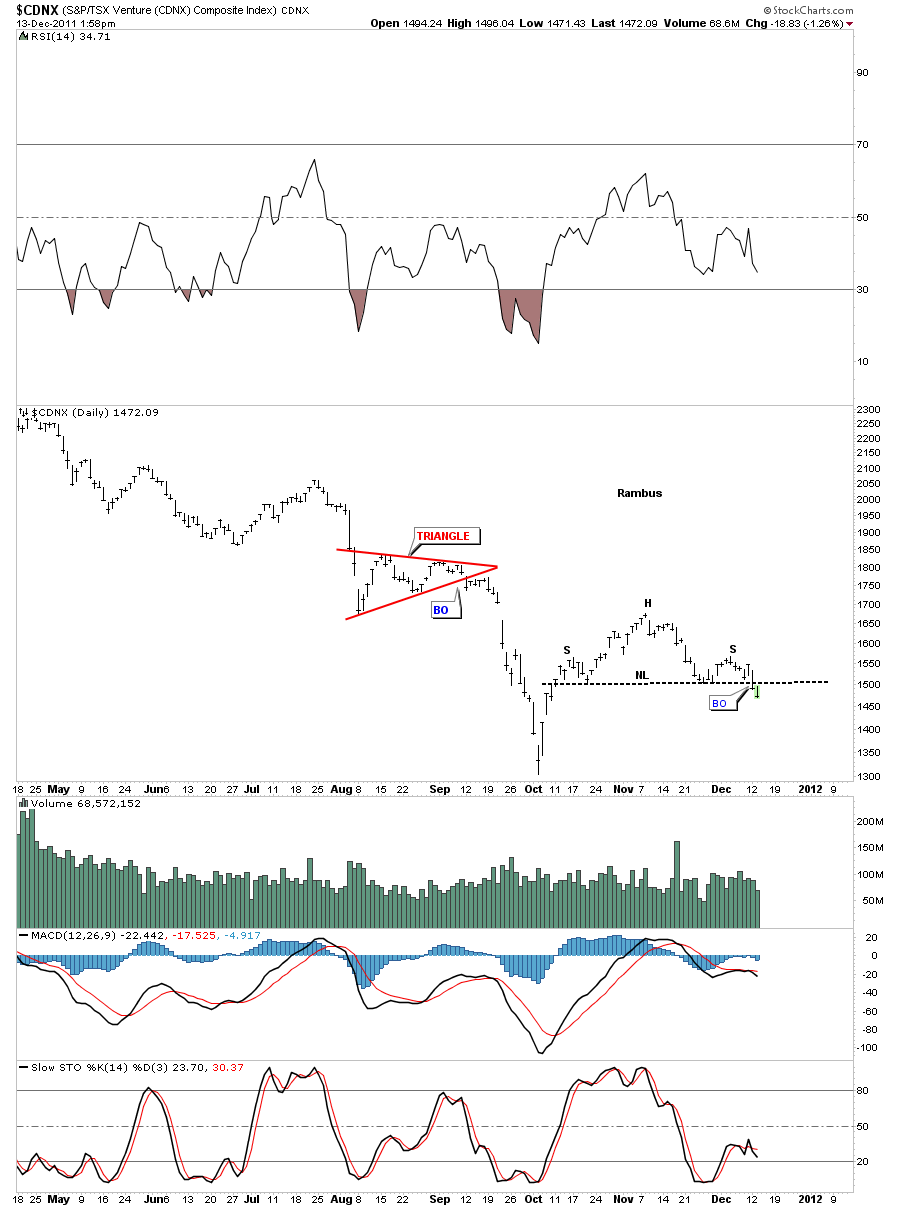
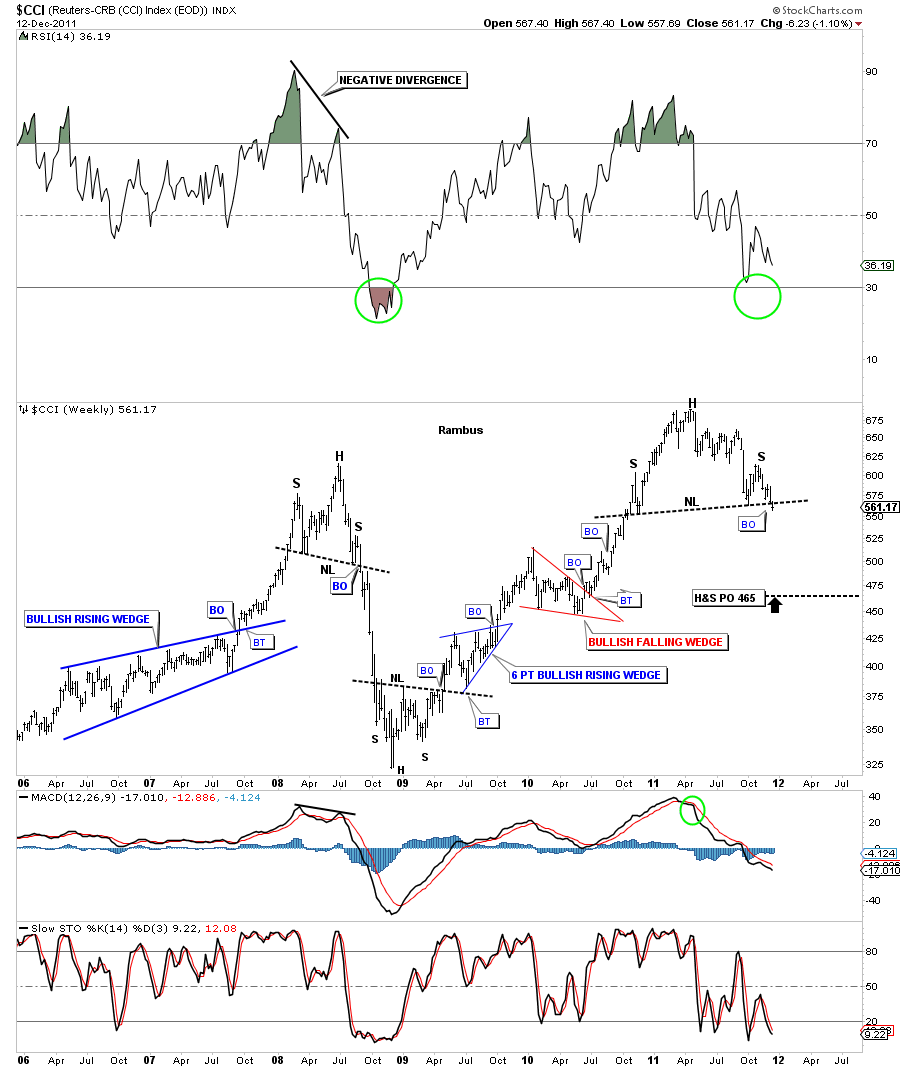
In the weekend report on H&S patterns I showed these two stocks that had a nice H&S top in place but hadn’t broken the neckline yet. With the dollar breaking it’s own neckline today, on the upside, the CCI and CDNX have broken their own necklines, to the downside, this morning.
CDXN daily H&S breakout.
The CCI commodities index broke it’s H&S neckline yesterday. That is telling you commodities are going to under pressure going forward.
Folks I can’t stress enough how important it is right now to protect your self from what I see coming down the road. All these H&S patterns are shouting loud and clear to protect your hard earned capital. There will be few if any stocks that will be able to go against the liquidation in a deleveraging spiral that seems close at hand. We are just at the very beginning stages of this process. There is an old adage on wall street that says “he looses the least amount of money in a bear market is the winner” to that I say “bah humbug”. There are many ETF’s that make it easy to short these markets. This is not a time to be thinking of buying your favorite little junior precious metals stocks because they may have good drill results or some other positive new. As 2008 showed the baby WILL get thrown out with the bath water. Having cash available at the end of what lies ahead will be the best way to pick up bargains but if you don’t raise cash now it will be too late and you will end up selling in a panic when the pain gets to much to bear. You can look at it this way. If I’m wrong the worst that could happen to you is that you still have all your capital to work with. Its a no brainier IMHO. The markets are going to be around alot longer than we will so there will be plenty of more opportunities, down the road, to put your hard earned capital to work.
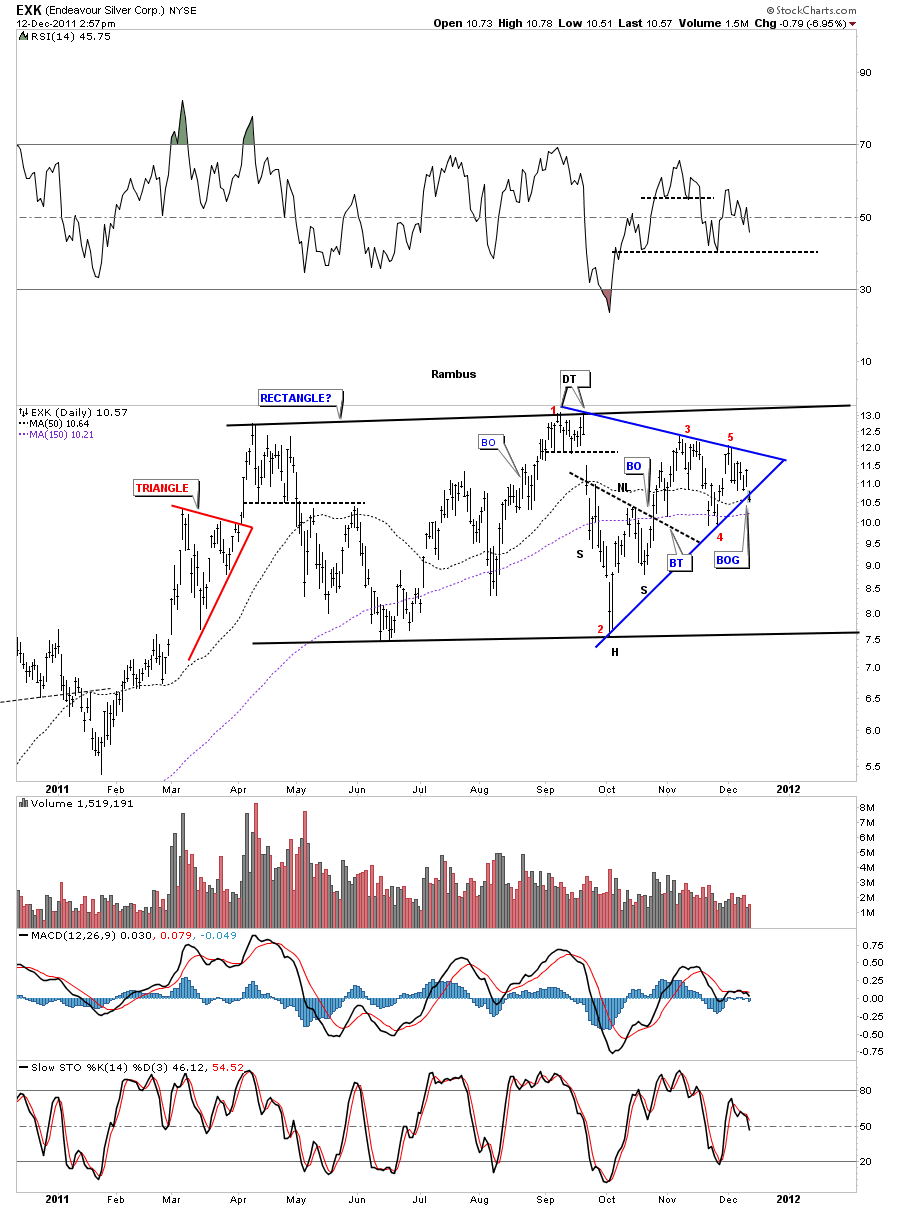
EXK…. Endeavour Silver Corp
I know alot of precious metals stock investors are holding this stock as it has been a start performer. The daily chart is showing a 5 point triangle reversal pattern that broke the bottom rail, on a big gap, this morning. I’ve labeled the reversal points with red numbers. Remember an odd number of reversal points equals a reversal pattern and an even number of reversal points equals a continuation pattern. In this case it looks like EXK will be heading lower. Preservation of capital is most important at this stage of the game.
EXK daily 5 point triangle reversal pattern.
Dollar update….UUP
The dollar is testing the neckline of it’s major H&S base today. A clean breakout from this big base is going to create a paradime shift for the precious metals complex, commodities and the stock markets. The dollar chart is the most important chart to focus on to get a feel for the direction of the many markets that it affects.
UUP daily testing the neckline.
Weekend Report H&S Patterns
In this weekend report I’d like to catch everyone up on the many H&S patterns I’ve been showing for several weeks now. So far none have been completed yet as most of the work, right now, has been on the developing right shoulders. I’ve been showing these H&S patterns in their early development so you can follow along, in real time, to see how the net results turn out. Just remember the actual buy or sell signal won’t come until the neckline is broken. Once that happens we will then be able to measure a possible price objective base on the height of the H&S pattern. That price objective would be a minimum. As H&S patterns, are for the most part reversal patterns, the price may go much further than just the minimum price objective.
The first chart I want to show is the all important US dollar. Everything from my perspective has to do with which way the dollar is going to move as that should affect the precious metals complex, commodities and the stock markets in an inverse manner. The weekly line chart shows several buy signals. The first buy signal is just a simple 10 week move average. It works good as a trending tool. When it turns up or down you get your buy or sell signal that you follow until it reverses at some point. Our latest buy signal came at the very end of August. You can see it is starting to flatten out a bit so the dollar needs to start showing some strength in here to keep the 10 wma rising. The indicators at the bottom of the chart, MACD and the slow stochastics are still on a buy signal. The ROC indicator just above the dollar chart is also on a buy signal. I’ve added some green dashed vertical rails so you can see how the 10 wma and the ROC, rate of change indicator, working together to show the buy signals. When the 10 wma turns up and the ROC passes up through the zero line together, that is your buy signal. One last note. Notice how the line chart is showing the dollar already breaking the neckline and if you look real close you can see we did some backtesting last week from above. Getting interesting.
Now we must look at the Euro as it should have an inverse look to the US dollar. I did this chart originally as a bar chart but switched it over to a line chart to see if we had the same breakout and backtest as the US dollar, only inversely. Its diffidently there. Now we need to start seeing some follow through to the downside to confirm the H&S top is in place. Notice the RSI at the top of the chart. It appears to also be building a H&S pattern.
XEU…Euro H&S top line chart.
Here is a ratio chart showing gold to the US dollar. This H&S pattern has a very ominous look to it. If gold is outperforming the dollar the chart will show a rising trend and if the dollar is outperforming gold then the trend is down. As you can see the rally off the 2008 low has been in a very nice uptrend. What is so ominous about this H&S pattern is that it is coming after a nearly 3 year rally phase. Note the big H&S base at the bottom left side of the chart. That H&S base was built to reverse the 2008 crash. You can see how important these patterns are and what the implications are if we break the current neckline. Food for thought.
Gold to the US dollar ratio chart, H&S top.
Next is a weekly chart of the CDNX which is a Canadian small cap index that was our only proxy for the small cap precious metals stocks until they came out with the GDXJ. There are other small cap stocks such as oil stocks in this index. So its a good index to look at to get a feel for the speculative feel for the precious metals complex as a whole. We know if the little juniors are rising, money is coming into the sector as the appetite for the speculative investor is good for the overall precious metals sector. When the juniors are falling that is not a good sign. The CDNX actually led the 2008 crash by starting their decline much sooner than the big caps. Note the H&S base that was made at the end on the big crash in 2008 and the straight line decline from the breakout of the big top pattern.
Next up is the CCI commodities index. This chart shows how precarious the situation is for commodities. We are sitting right on the neckline. Notice the other 2 H&S patterns. One was made at the top in 2008 that foresaw the panic crash that ensued. The other H&S pattern was made after the crash was over and reversed that vertical drop of the 2008 high. As you can see the 2008 H&S top and the 2008 H&S bottom went much further than the H&S measured price objective. For the most part think of a H&S pattern as a reversal pattern, reversing a trend that has been in play for a period of time. There can also be a H&S consolidation pattern but they are much more rare.
CCI commodity index weekly H&S top.
Next lets look at a precious metal that most don’t follow real close but is important nonetheless. Platinum is trading for less than gold which is kind of anomaly. It happens from time to time as is the case right now. Again lets take a weekly look at it’s H&S top that has been in place for almost 2 years now. If this H&S top plays out can the other precious metals be far behind? Time will tell.
Platinum weekly H&S top.
Lets look at one more chart that has a H&S consolidation pattern instead of the reversal pattern. I’ve been showing the Silver H&S consolidation pattern for sometime now, on the daily chart. You can see how this H&S pattern is forming in the middle of the downtrend and not at a top or bottom, thus a consolidation pattern. The 50 dma is governing SLV right now.
SLV H&S consolidation pattern on the daily look.
All these H&S patterns are painting a very bearish picture. I think once the dollar finally shows it’s hand and breakouts out, all these H&S patterns will follow suit which will lead to a cascading effect that will be in progress for some time as most of the charts above are on the weekly look. Make sure you keep this in mind, we haven’t broken any of the necklines yet. The dollar is very close but no cigar. So watch the necklines very closely and act accordingly. We are very close but not quite there yet.
All the best ….Rambus
SLV 30 minute real time breakout and backtest
Below is the 30 minute chart for SLV that I showed earlier this morning. I just wanted to show you in real time how a breakout and backtest work. I’ve put on a green circle so you can zero in on this mornings breakout of the right shoulder bear flag and then the backtest to the underside of the rail. Once an important rail is broken it will reverse it’s role. In this case the bottom rail of the bear flag held support during it’s formation and then this morning when we broke thru, it reversed it’s role and acted as resistance. This is a fundamental function of support and resistance. Its all based on psychology.
SLV breakout of the bear flag rt shoulder with backtest.
SPX backtest
In the weekend report I showed a chart of the SPX with a H&S top that had broken down. The massive one day rally last week took the SPX all the way back up to the underside of the neckline. I said 1260 was critical resistance and the backtest to the neckline. This week we have been hanging around the bottom side of the neckline waiting for something to happen. Usually after about 3 or 4 days of little movement the price action will make some kind of move. As you can see on the chart below, today’s action maybe suggesting that the 1260 neckline resistance is hot so a sell/stop can be placed above the 1260 area if one decides to go short. There is also a neckline from the big H&S top that should also offer resistance.
SPX daily backtest to the neckline at 1260.
Below is the US dollar chart on top and the SPX chart on the bottom. This is the chart I showed in the weekend report. The red circles shows the inverse setup between the two. You can see how the US dollar is backtesting it’s neckline while the SPX is backtesting it’s own neckline. Just a side note. Until the dollar can break through the neckline don’t expect alot of action. Once the breakout and backtest are finished is when the next impulse leg up will start. So watch those two necklines very carefully. If your an aggressive trade you can start a small position as close to 1260 as possible and can then add as the dollar breaks out and backtests.
US dollar chart on top and the SPX on the bottom. Red circles shows inverse look.