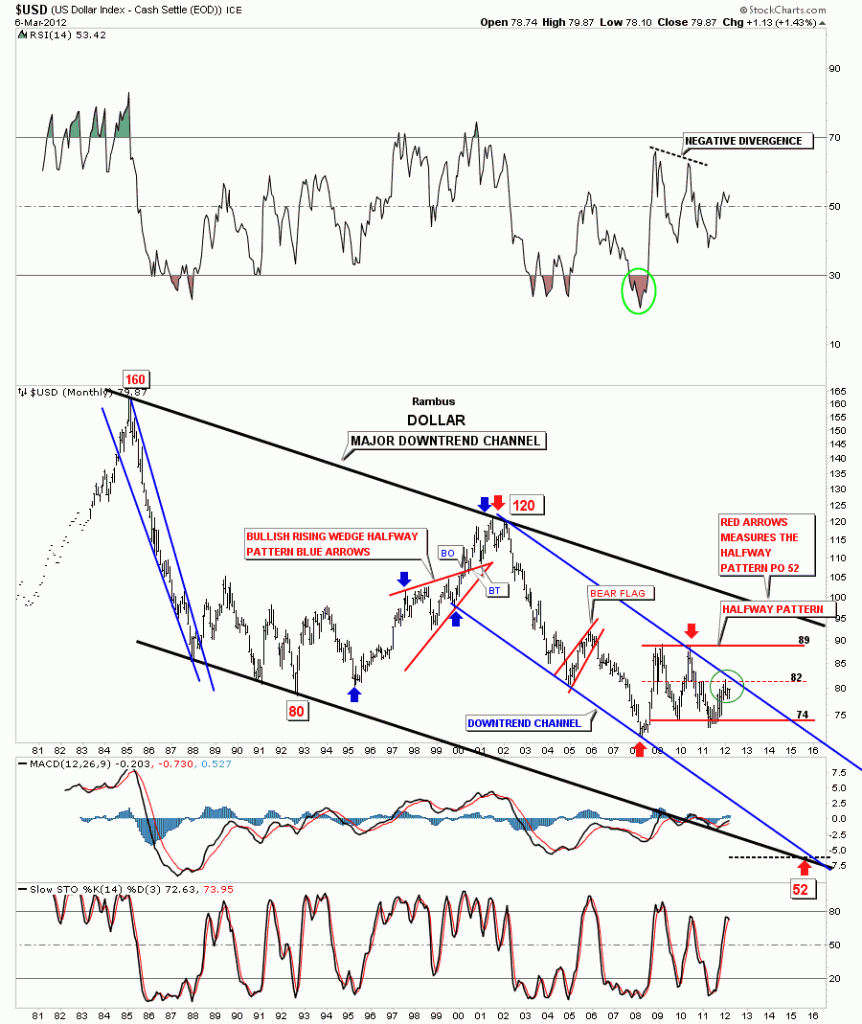
This Afternoon I would like to show you the very long term chart of the US Dollar that goes all the way back to 1986 where it topped out at 160. As you can see on the chart below it has been in a confirmed downtrend that is still on going. What I want to focus on is the blue downtrend channel that began in 2000 at 120. The top and bottom blue rails are perfectly parallel with each rail having two hits on them. Now I want to focus your attention on the red horizontal pattern. At this point the only thing I can name it is a 2 1/2 double top. I’ve seen this pattern on other stocks that can show up at a bottom also. Whenever I see a horizontal trading range like this, similar to a rectangle, I always put in a center line in the middle of the consolidation pattern. This is the thin red dashed horizontal line. You can see how this center rail has halted the advance in the dollar since 2011 with the last touch about 2 1/2 months ago at the 82 level. The dollar is currently trading just under 80 so we are nearing the strong resistance points where the top blue rail of the center downtrend channel and the red dashed horizontal rails converge, green circle. The red 2 1/2 top halfway pattern has a measured move down to 52 sometime in 2015 which is only 3 short years away. A subscriber asked me the other day what will it take to finally get the precious metals stocks into rally mode. This long term chart of the dollar is your answer. We are within one or two points of reaching the strong resistance point at 82. As the dollar is looking for a high right in here I think the precious metals stocks are looking for a low right now which makes perfect sense. Jim Sinclair used this chart several years ago in one of his commentaries on the US Dollar. As this is a long term monthly chart its still the same chart with only the red halfway pattern developing within the blue downtrend channel that is new. One last note on the dollar chart. There was a bullish rising wedge that formed as a halfway pattern back in the late 1990?s that measured to the last major top in 2000.
all the best Rambus


